Water Resources Data System & State Climate Office
Water Resources Data System & State Climate Office
Water Resources Data System & State Climate Office


Wyoming Climate Atlas
 Snow
Snow
Snow falls frequently from November through May and, at lower elevations is light to moderate. About five times a year, on average, stations at lower elevations will have snowfall events exceeding five inches (Figure 5.1). This quantity of snow usually requires some roadside removal. Snowfalls of 10 to 15 inches or more from a single storm occur but are infrequent outside of the mountains. Wind will frequently accompany or follow a snowstorm and pile the snow into drifts several feet deep. The snow sometimes drifts so much that it is difficult to obtain an accurate measurement of snowfall. An unusually heavy snow occurred at Sheridan on the 3rd and 4th of April in 1955.47a During this period the snowfall amounted to 39 inches, had a water equivalent of 4.3 inches and blizzard conditions lasted more than 43 hours. Blizzard conditions consist of high winds in excess of 35 mph, low temperatures below 20°F, blowing snow with a visibility of less than 1/4 mile, and lasting for a minimum of three hours. In the 1980s there were at least 9 statewide blizzards in Wyoming, in the 1990s there were at least 25. Figure 5.2 depicts the greatest 24-hour snowfall from 1961-1990.
Total mean annual snowfall varies considerably (Figure 5.3). At the lower elevations in the east, the range is from 60 to 70 inches. Over the drier southwest region of the state, amounts vary from 45 to 55 inches. Snow is very light in the Bighorn Basin with annual averages from 15 to 20 inches over the lower portion and 30 to 40 inches on the sides of the basin where elevations range from 5,000 to 6,000 feet. The mountains receive a great deal more at higher elevations annual amounts are well over 200 inches. At Beckler River Ranger Station in the southwest corner of Yellowstone Park, the snowfall averaged 262 inches over a 20-year period. Snowy days (snowfall equal to at least one inch) more than doubles as one moves from the eastern plains to the western mountains (Figure 5.4).
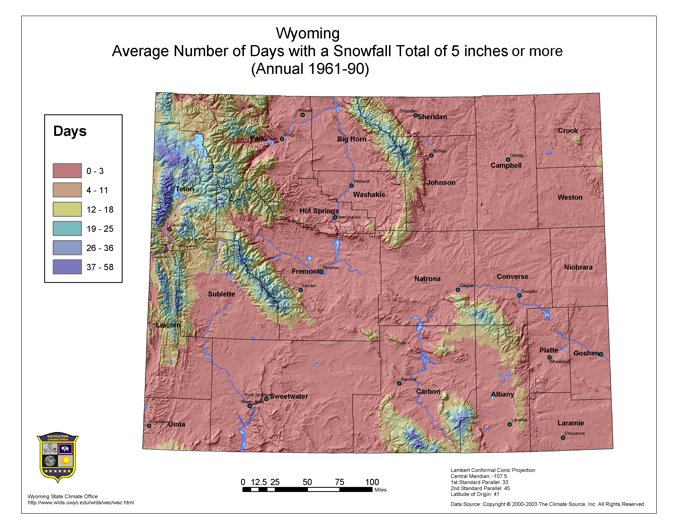
Figure 5.1. Wyoming average annual snowfall days of at least five inches (PRISM, 1961-90)
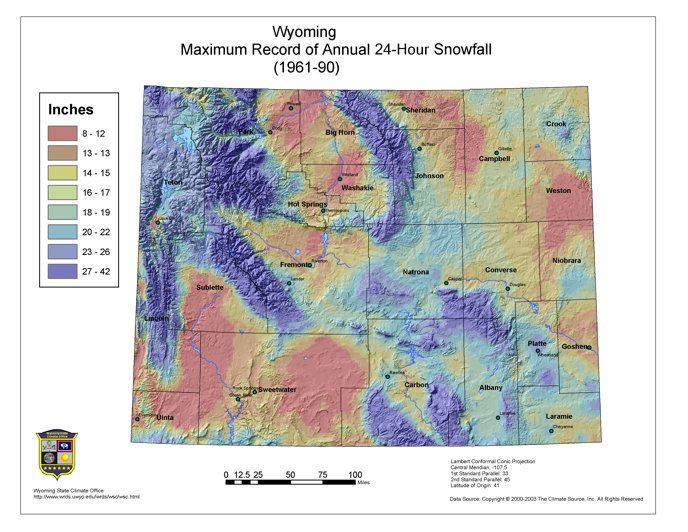
Figure 5.2. Wyoming annual maximum 24-hour snowfall amounts (PRISM, 1961-90)
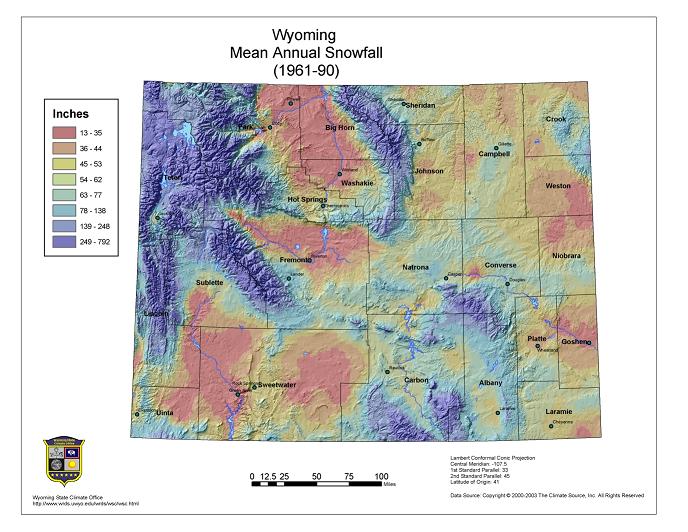
Figure 5.3. Wyoming mean annual snowfall (PRISM, 1961-90)
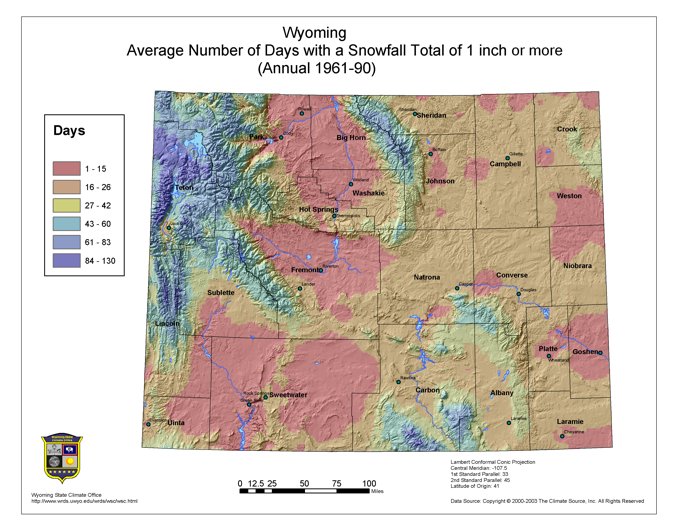
Figure 5.4. Wyoming average annual number of days with snowfall totals of at least one inch (PRISM, 1961-90)
The weather pattern most favorable for precipitation is one with a low-pressure center slightly to the south of the state. Normally, this will provide a condition where relatively cool air at the surface is overrun by warmer moist air. Studies of wind flow patterns indicate that Wyoming is covered most of the time by air from the Pacific. A smaller percentage of time the state is covered by cold air masses that move down from Canada.
The measurement of snowfall is difficult at best, and without adhering to strict measurement guidelines, errors can quickly accumulate. Snowfall measurements are easily impacted by wind, which causes drifting and scouring of the snowfall on measuring snowboards. Temperatures near or above freezing will also impact the measurement of snowfall resulting in some melting of the snow.
The type of snow itself, including the degree of crystallization and the observational interval used for measuring the snow will have a great impact on the snowfall measurement. The more frequent the snowfall measurement, the less time there is for settling to take place. Likewise, settling rates also depend on snowflake type with larger flakes (aggregates) settling much more over time than smaller flakes (single crystals or broken and irregular flakes).49
Using Cheyenne's and Lander's long term climate records of snow to water equivalent (SWE) ratios reveal that the highest ratios occur when the total daily precipitation amounts are the least. When 0.01 inch of precipitation is reported, the average SWE ratio is close to 20:1 in Cheyenne and 30:1 in Lander. One would expect that colder days yield lesser amounts of moisture, so fluffy powdery snows would be expected. A correlation approximating r2 = 0.8 using a power curve fit helps to illustrate this exceptionally well (Figure 5.5).
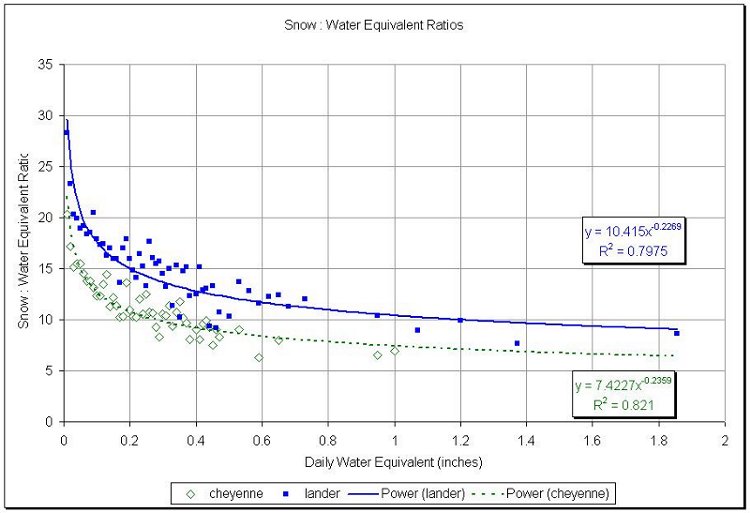
Figure 5.5. Cheyenne (1915-2000) and Lander (1948-2001) daily average snow to water ratio based on average daily water equivalent
Because hourly snow measurements are not taken as a rule, snow can fall throughout the period between observations while the temperature varies. So, another approach is considered when determining these ratios. In Figure 5.5, the snow-to-water ratios were taken with respect to the same daily water equivalent amounts. In Cheyenne between 1915 and 2000, there were 416 events in which 0.01 inch of daily total water equivalent occurred. The same averaging was performed for the other daily totals. The minimum, average, and maximum daily temperatures were then averaged for this particular daily total (Figure 5.6). As would be expected, the minimum temperatures yield the highest correlation. Correlations were even higher for Lander (Figure 5.7), since wind speeds are considerably less than what Cheyenne experiences.

Figure 5.6. Cheyenne snow-to-water equivalent as a function of total water equivalent (1915-2000). Correlations improve using daily minimum temperatures. Ratios of 10:1 were not computed as discussed below.
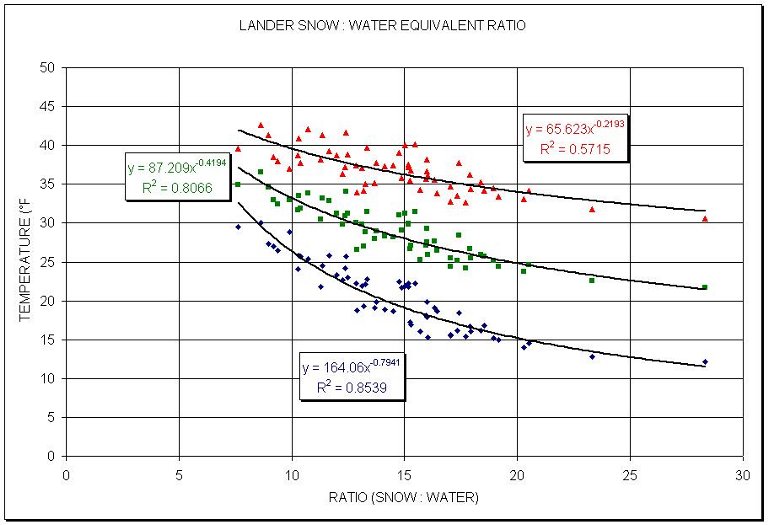
Figure 5.7. Lander snow-to-water equivalent as a function of total water equivalent (1948-2001). Correlations improve using daily minimum temperatures.
A good rule of thumb for determining snowfall is to melt whatever snow has accumulated and multiple by 10. For Cheyenne with a 9.9:1 ratio, minimum daily temperatures averaged 22.3°F while the maximum daily temperature averaged 39.3°F. For Lander the values were 28.9°F and 37.0°F respectively. In Wyoming, where winds often either blow snow away or accumulate it in drifts, sometimes the 10:1 rule has been applied as a matter of convenience or estimation. However, the problem in using this approach is that average conditions are seldom observed. As noted in Figure 5.6 and Figure 5.7, temperatures vary considerably during the day. When comparing minimum temperatures to maximum temperatures on the same day that 10:1 ratios are reported, the amount of scatter is considerable (Figure 5.8). It can be safely assumed that when the maximum temperature exceeded 70°F (on two occasions), that the snow actually fell when the minimum temperature was in the low to mid 30s. However, when the maximum temperature failed to reach 20°F it is more difficult to explain why the snow-to-water ratios were not higher.
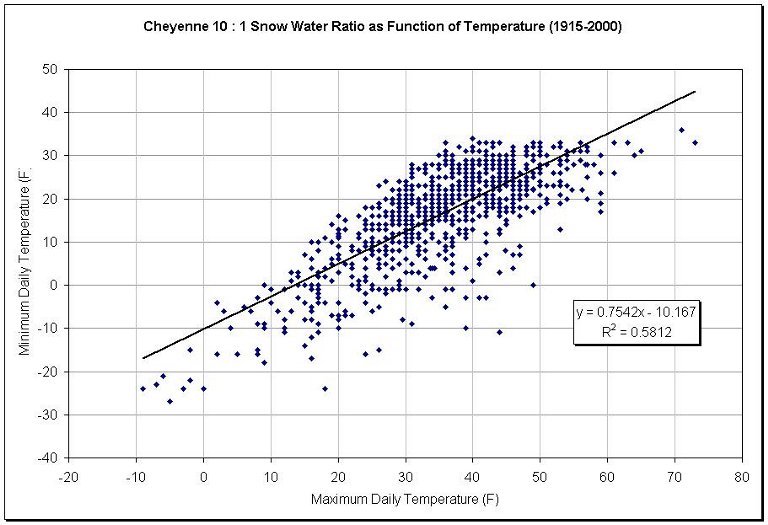
Figure 5.8. Cheyenne maximum and minimum temperatures during days when snow-to-water ratios were reported as 10:1. A total of 895 events were reported in 86 years.
Considering whether this apparent problem has been systematic or not, the number of days per year in which the 10:1 ratio was reported is shown in Figure 5.9. The linear trend is increasing although there is a large annual variability. Snow measurement became more problematic with the introduction of the Automated Surface Observing System (ASOS) in 1996.
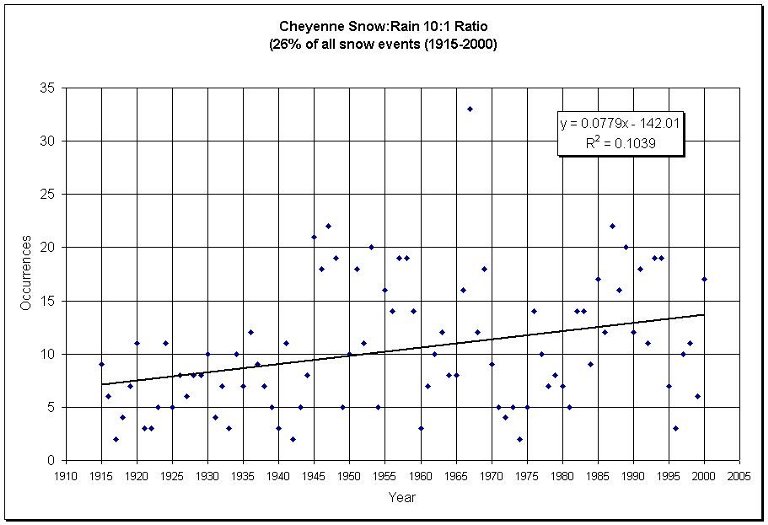
Figure 5.9. Cheyenne reported 10:1 snow-to-water ratios by year (1915-2000)
As noted in Figure 5.9.0., SWE is a function of altitude. Since measured snow "values" are greatly degraded due to high winds, the lower graph reflects an applied correction factor that is more in line with measurements that would be made if snow fell with no wind.
Figure 5.9.0. SWE during the snow accumulation season in Wyoming (actual measured-top, and adjusted-bottom)49a
Snow survey data can be used to help determine the weight that the snowpack exerts on the ground at the site in that area or elevation zone. To determine the snow load, one needs to know how much the snowpack weighs. The weight of the snow varies with the water content of the snowpack. The SWE or water content of the snowpack is the amount of water in the snowpack measured in inches if you were to melt the snowpack.
One could isolate a column of snow, melt it, and then weigh it to determine the weight over that area. However, this is very difficult especially if the snowpack is five feet deep and much more difficult if the snowpack is 10-15 feet deep. An easier method to determine snow loads (if you have a set of snow measuring tubes) is by measuring the snow-water content and using the following formula. If you are concerned about the snow load in your area many of the Natural Resources Conservation Service Field Offices located in most counties have snow tubes and can assist you in determining the current snow load information.
(1 US gallon) * (1 ft3) * (62.418 lbs) * (1 ft) * SWE (inches) = Snow Load (lbs/ft2)
(0.1337 ft3) (7.48 gallons) (1 ft3 of water) (12 inches)
Or just remember the conversion factor of "5.2" (or rounded to 5) to multiply the SWE value to estimate the snow load. SWE (inches) * 5.2 = Snow Load (lbs/ft2). The average weight of water at 32° F is 62.418 pound per cubic foot.
Snow-water equivalent amounts can be quickly obtained using the Natural Resources Conservation Service's SNOTEL50 (SNOw TELemetry,Figure 2.4) stations. There are 88 automated snow measuring sites in Wyoming. These SNOTEL stations transmit daily snow-to-water equivalent, precipitation, and temperature data on a daily or more frequent basis. Some sites also transmit depth of snow at the site. Table 5.A. illustrates the ground snow loads for selected snow measuring stations. The average SWE for the selected dates are shown for reference.
Table 5.A. Example of snow loads
| Site name | Elevation | Date | Depth | SWE | Average | Snow Load |
| (feet) | (inches) | (inches) | SWE | (lbs/ft2) | ||
| Station 1 | 4920 | 1/03/03 | 37 | 11.8 | 2.7 | 61 |
| Station 1 | 4920 | 1/06/03 | 65 | 22.0 | 8.0 | 114 |
| Station 2 | 6090 | 1/01/03 | 114 | 41.4 | 22.1 | 215 |
| Station 3 | 6110 | 1/01/03 | 150 | 48.8 | 25.8 | 254 |
| Station 3 | 6110 | 1/03/03 | 230 | 97.9 | 63.2 | 500 |
The snow load calculated in Table 5.A. is for ground snow loads and will provide an indication of the roof snow load. Roof snow loads can vary depending on melting and re-freezing of snow and ice, roof slope, type of roof, aspect, drifting, etc. Building codes vary depending upon the elevation zone and the amount of snow and precipitation that falls.
Individuals can contact their local city or county agencies for specific building codes in their
area and the codes that were in effect when the structure was built. Additional rain or snow can quickly
increase the snow load because a snowpack can absorb rain until its density is about 45%.
Typically, the snowpack is about 25-30% dense in January and 40-45% dense in April. The
snowpack will start melting when the density is about 45%. New snowfall has an average
density of 10% (i.e., 10 inches of new snowfall = 1 inch of liquid).
The density of newly fallen snow averages about 100 kg/m3
(6.2 lb/ft3). The density of the snowpack increases with
time due to the compaction of overlying snow, and the changes that
result from vapor movement within the snowpack.
Drifted snow is usually denser than undisturbed snow because the
particles are initially smaller and more compact. Density of newly
deposited snow varies with weather conditions, however, and concurrent
snowfall is a dominant factor. The density of a newly deposited layer
of blowing snow can as low as 100 kg/m3 (6.2
lb/ft3) in the presence of snowfall, or as high as 300
kg/m3 (18.7 lb/ft3) in its absence.
The pressure of overlying snow compacts and rearranges snow particles by
plastic yielding, particle fracture, and sliding. Before the onset of
melt, the density of drifted snow is approximated as shown in Figure
5.9a.
SNOTEL data are extremely important to State and Federal agencies. The higher elevation snowpack determines how to manage the water that flows in and out of reservoirs across the state. By the middle of April, the season's snowpack normally reaches its maximum SWE. Because of long periods of record, knowledge of the SWE history enables water managers to best estimate whether there will be a water surplus or deficit during the agricultural growing season. In Table 5.B., a partial listing 51 of SNOTEL sites is shown.
Table 5.B. Wyoming snow-water equivalent measurements (1971-2000 normals), partial list
For comparision between the average annual SWE changes (delta) for the current Normals (1971-2000) and the previous Normals (1961-1990), see Table 5.C.
Table 5.C. Annual average delta SWE (new - older) Normals
|
Delta SWE (in) |
Percent of Occurrence |
|
<-3.0 |
0.8 |
|
-3.0 |
0.4 |
|
-2.0 |
1.2 |
|
-1.0 |
6.7 |
|
no change |
54.9 |
|
+1.0 |
29.5 |
|
+2.0 |
3.7 |
|
+3.0 |
1.6 |
|
>+3.0 |
1.6 |
There is a marked increase in SWE during the most recent Normals period, especially for a delta around +1.0 inch. Some of this might be attributed to a station's change in elevation or exposure. Sites in the vicinity of trees might have accumulated more snow since the trees act as a natural wind break and shade snow from melting in the direct sunlight. Or, perhaps there was a real increase in SWE with slightly elevated air temperatures, especially during the 1990s.
One thing that should be kept in mind is that neither the 1961-1990, nor the 1971-2000 Normals should be considered "true" SNOTEL Normals. Most of the earlier SNOTEL sites came online in 1979, and several more came online in 1986. For these earlier sites, data were estimated or back-generated from co-located or nearby snow courses.51a Although these are not "true" SNOTEL Normals, very stringent statistical requirements were applied to any data estimated from snow course data. When using normals for any data element, the user should always be cautious and is advised to look into how those normals were generated.
Although Wyoming is a land-locked state, far from moisture sources such as the Pacific Ocean and Gulf of Mexico, its high terrain enables uplift to squeeze out copious amounts of moisture from passing weather systems. In Table 5.D., impressive statewide snow events are shown. For a complete list of one, two, and three day record snowfall totals by county, see Atlas Appendix C.
Table 5.D. Record snow events in Wyoming
Mountain ski resorts augment natural snow cover with man made snow, especially during meteorological droughts. 28° F is the "magic number" for snowmaking. When the temperatures drop below this mark, snow production is greatly enhanced. Ten inches of natural snow, when packed, usually adds only one inch of snow to the ski slope<92>s base while 10 inches of man-made snow adds seven inches of base. Man-made snow is usually more dense and durable. Four to five times as much snow can be made when temperatures are in the low 20°s than when it is 28°F. Humidity is a factor as well. The lower the humidity, the better for making snow. If you add the temperature plus the humidity, that sum should equal less than 100 for favorable snowmaking weather. Figure 5.10 shows that even when the air temperature is above freezing, snow can be made so long as the wet bulb temperature remains below 32°F. Likewise, if the temperature is near the dewpoint, although both are a bit below freezing, the water droplets will not freeze quickly enough to create snow.
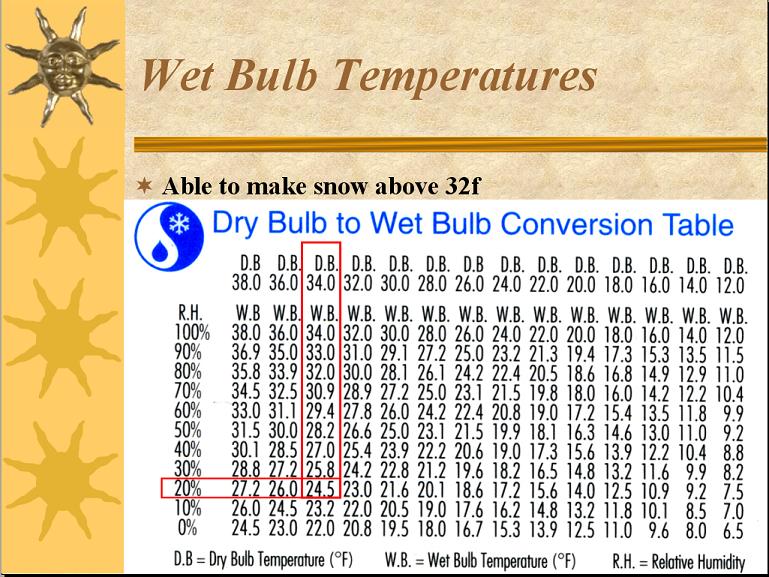
Figure 5.10. Snowmaking conversion table
48. http://www.eas.slu.edu/CIPS/Research/snowliquidrat.html
49. http://climate.atmos.colostate.edu/snowbooklet.shtml
49a. Courtesy of Tabler and Associates
50. http://www.wrds.uwyo.edu/wrds/nrcs/nrcs.html
50a. Courtesy of Tabler and Associates: http://www.tablerassociates.com/images/NoMoreBS.pdf, pages 40-42
51. See Atlas Appendix B for complete listing of stations
51a. Personal communication with Tom Perkins, Natural Resources Conservation Service.
51b. http://www.firsttracksonline.com/snowmaking.htm
51c. Courtesy of Tabler and Associates: http://www.tablerassociates.com/images/NoMoreBS.pdf
State Climate Office | Water Resources Data System
Last Modified: Fri, 23 May 2025