Water Resources Data System & State Climate Office
Water Resources Data System & State Climate Office
Water Resources Data System & State Climate Office


Wyoming Climate Atlas
 Precipitation
Like other states in the west, precipitation29 varies a great deal from one location to another. With a limited number of weather stations reporting rainfall, estimates from weather radar30 have some limitations over the intermountain west, but some data are still better than no data. The period of maximum rainfall occurs in the spring and early summer for most of the state. Rainfall is greater over the mountain ranges and usually at the higher elevations, although elevation alone is not the predominant influence. For instance, over most of the southwest portion of the state, the elevation ranges from 6,500 to 8,500 feet, and annual rainfall varies from seven to 10 inches. At lower elevations over the northeast and along the eastern border, where the elevations range mostly from 4,000 to 5,500 feet, annual averages are 12 to 16 inches. The relatively dry southwest portion is a high plateau nearly surrounded by mountain ranges.
The Bighorn basin provides a striking example of the effect of mountain ranges in blocking the flow of moisture-laden air from the east as well as from the west. The lower portion of the basin has an annual rainfall of 5 to 8 inches, and is the driest part of the state. The station showing the least amount is Lovell at 3,837 feet with an annual mean of about 6.74 inches. In the southern part of the basin, Worland at 4,172 feet has an annual mean of eight inches as compared with Thermopolis at 4,313 feet with 12 inches. Only a few locations receive as much as 40 inches a year. The least, annual lower elevation total recorded, for any place in Wyoming is 1.28 inches at Lysite (5,260 feet) in 1960 and the greatest, annual lower elevation total is 55.46 inches at Grassy Lake Dam (7,240 feet) in 1945 (Table 4.A.). The long-term (1895-2003) statewide average rainfall is 13.07 inches.
|
Table 4.A. Record precipitation events in Wyoming (inches) | |||
|
Maximum Annual |
55.46 |
1945 |
Grassy Lake Dam |
|
Minimum Annual |
1.28 |
1960 |
Lysite |
|
Max 24-hours |
6.06 |
1 Aug 1985 |
Cheyenne |
|
Average Maximum Annual |
32.31 |
|
Snake River |
|
Average Minimum Annual |
5.11 |
|
Lysite |
|
Consecutive Days Measured |
25 |
Jan-Feb 1950 |
Moose |
|
Consecutive Days with No Measured Precipitation |
180 |
Nov 87-Apr 88 |
Deaver |
From 1961-1990 (the previous Normals period), there were about 130 stations across Wyoming that had a continuous climate record. Certainly the spacing of these stations would not allow for the accurate resolution of any climate element such as precipitation.
However by using PRISM, (Parameter-Elevation Regressions on Independent Slopes Model) an expert system that uses point data and a digital elevation model (DEM) to generate gridded estimates of climate parameters31, 31a a more representative depiction of Wyoming climate has been achieved. In Figure 4.1, the annual precipitation across Wyoming is shown at a 2km resolution (1 km = 0.6 mile, or 1 mile = 1.6 km).
During the summer, showers are quite frequent but often amount to only a few hundredths of an inch. Occasionally there will be some very heavy rain associated with thunderstorms covering a few square miles. There are usually several local storms each year with one to two inches of rain in a 24-hour period. On rare occasions, 24-hour amounts range from three to five inches.
The greatest official 24-hour total recorded for any place in Wyoming is 6.06 inches at Cheyenne on August 1, 1985 (39% annual total). Precipitation occurs on average only one in five days across the state during the year.
In this chapter the three characteristics of rainfall; frequency, duration, and intensity will be discussed. In most climate atlases, the typical information showing total average amount of rainfall for a given period does not provide enough information for optimal planning of activities. For example, if the tourism industry wants to advertise the best times to visit the state, then knowing when the winter snows will dominate is important. Or, if the ranching community knows that spring precipitation will be normal and distributed more or less evenly week after week, they can adjust their livestock numbers accordingly to yield maximum grazing ratios (i.e., cattle per acres). However, if the normal total spring rains occurred in just a few days, the prairies would fail to effectively "greenup". As a final illustration, if a structural engineer knows when to expect a 100-year flood, bridge supports can be built or retrofitted to withstand these unusual stress events at the best dollar cost-to-risk consideration.
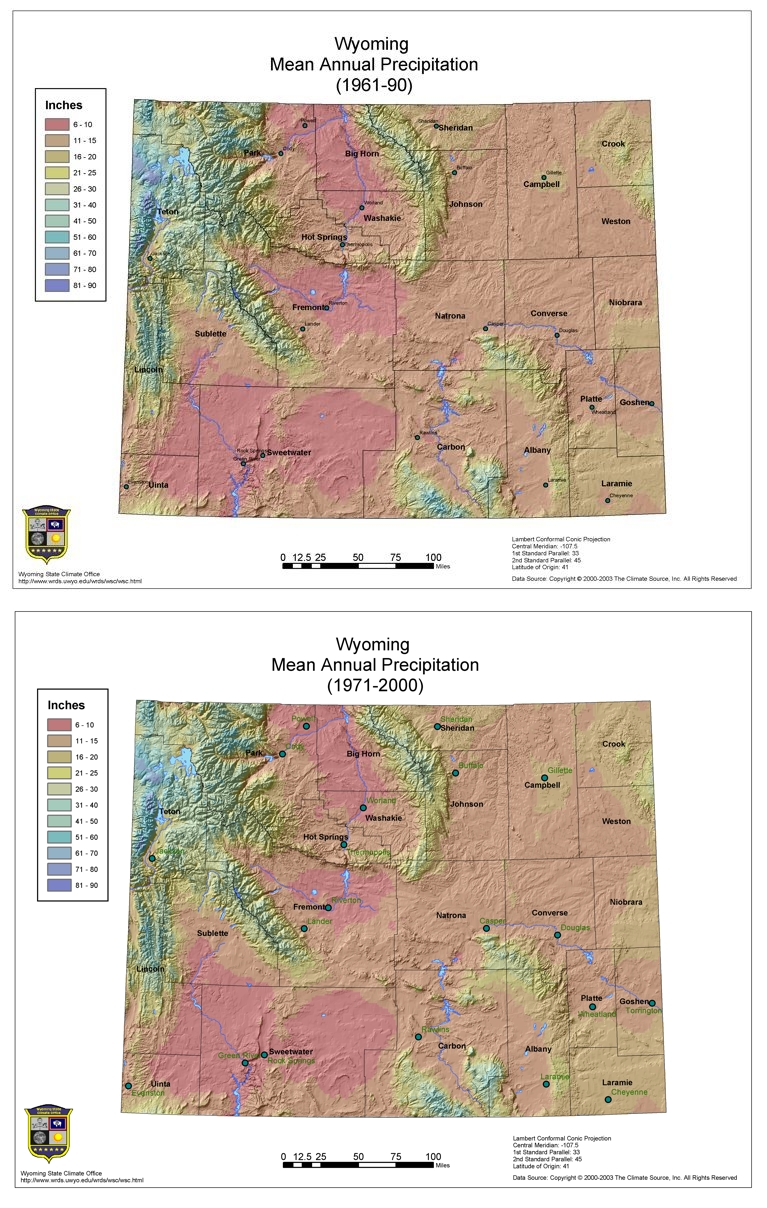
Figure 4.1. Annual precipitation at 2km resolution in Wyoming (PRISM)
When we look at climate data statistics, a normal distribution (bell shaped curve) is assumed which represents the likelihood of an event occurring (if they are truly random). By definition, one standard deviation (sd) approximates 68% of all occurrences while two sd represent about 95%. Therefore the more extreme an event is, the higher the absolute sd value. Because climate averages are seldom experienced, knowing the range of possible values helps to provide flexibility for adjusting to all conditions.
In Wyoming, there are currently only four first class weather stations where hourly precipitation measurements are in excess of 50 years are available. In Table 4.B., the hourly frequencies for Casper, Cheyenne, Lander, and Sheridan show that from 1949-2001, more than 70% of the time no precipitation fell, and of the remaining period of what fell, more than 75% occurred at a rate less than 0.26 inch per hour. In Table 4.C., the frequency of the first 0.1 inch at 0.01 inch increments is shown for a given day with precipitation.
Figure 4.2 shows that the lowest frequency of light precipitation occurs in the morning during July and the highest frequency in the spring and fall during late evening and early morning.
In Figure 4.3, the average number of days with measurable precipitation ranges from less than 53 days per year over the central and southwest basins to well over two to three times this number over the highest elevations across the state.
Table 4.B. Hourly precipitation bins for Wyoming first class stations measured in percent of occurrence during days with precipitation (inches) (1949-2001)
|
BINS |
no precip |
0.01-0.25 |
0.26-0.50 |
0.76-1.00 |
1.01-1.25 |
1.26-1.50 |
1.51-1.75 |
1.76-2.00 |
2.01-2.25 |
2.26-2.50 |
2.51-2.75 |
>3.01 |
|
Casper |
73.8 |
86.1 |
9.0 |
2.3 |
0.5 |
0.2 |
0.1 |
0.1 |
0.1 |
|
|
|
|
Cheyenne |
72.9 |
82.4 |
10.1 |
3.8 |
0.6 |
0.4 |
0.2 |
|
|
0.04 |
0.04 |
|
|
Lander |
80.5 |
76.7 |
12.9 |
5.3 |
1.2 |
0.3 |
0.2 |
0.1 |
0.08 |
0.03 |
|
0.02 |
|
Sheridan |
72.4 |
84.0 |
9.9 |
3.1 |
0.5 |
0.2 |
0.1 |
0.1 |
0.02 |
|
0.02 |
|
Table 4.C. Hourly precipitation frequencies (%) for very light amounts (1949-2001)
|
Total/hr |
0.01 |
0.02 |
0.03 |
0.04 |
0.05 |
0.06 |
0.07 |
0.08 |
0.09 |
0.10 |
|
Casper |
15.9 |
12.3 |
7.6 |
6.9 |
6.0 |
5.1 |
4.2 |
3.2 |
2.6 |
2.9 |
|
Cheyenne |
17.1 |
12.1 |
7.7 |
6.5 |
4.9 |
4.2 |
3.8 |
3.2 |
2.8 |
2.7 |
|
Lander |
13.3 |
9.8 |
6.4 |
5.6 |
5.3 |
4.2 |
4.4 |
3.1 |
2.3 |
3.0 |
|
Sheridan |
14.9 |
12.1 |
8.1 |
7.2 |
4.7 |
4.7 |
4.1 |
3.3 |
3.1 |
2.6 |
Figure 4.2. Hourly precipitation frequency (%) for all amounts up to 0.10 inch per hour by month (1949-2001) averaged for Casper, Cheyenne, Lander, and Sheridan
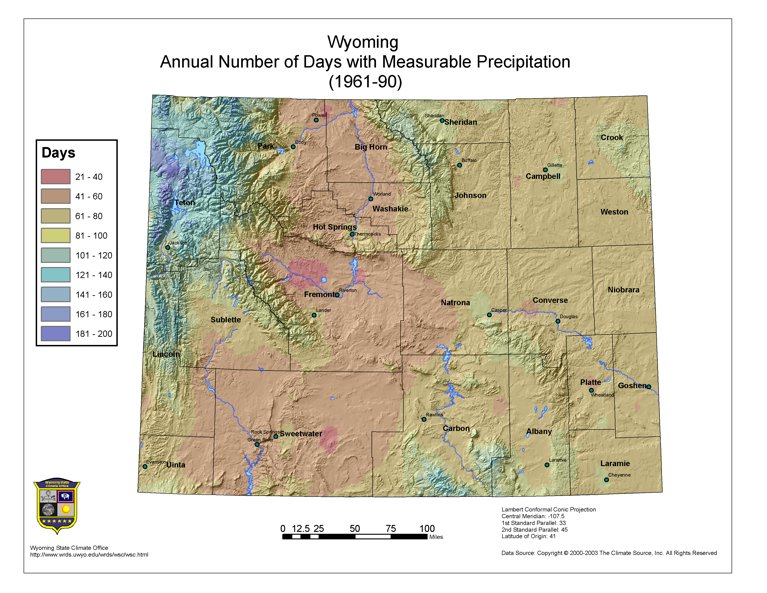
Figure 4.3. Average annual number of days with measurable precipitation in Wyoming (PRISM, 1961-90)
Most valley or plateau stations such as those represented and depicted in Figure 4.4 have the majority of a day's worth of precipitation occurring under four hours (under six hours for Sheridan). Cheyenne has the most number of days with one to three hours of measurable precipitation. All stations fall under 5% of occurrence for any specific period greater than six hours on any given day, but still total 17% for the remaining 17 hours (28% for Lander). At higher elevations where prevailing winds create substantial uplift conditions, precipitation probably falls at durations two to four times longer.
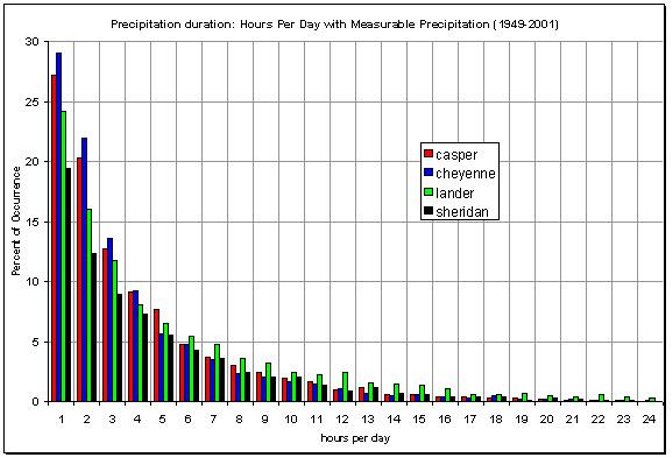
Figure 4.4. First class weather stations in Wyoming show duration of precipitation during a given 24-hour period
Regional weather patterns such as the summer monsoonal flow from the Gulf of California can cause enhancement of thunderstorm activity in June (Figure 4.5). If precipitation occurred randomly, one could expect during any month an average of 8.33% of a year's worth of precipitation (12 * 8.33% = 100%). Clearly, the greener colored areas reflect higher than the 8.33% average (1961-1990). This phenomenon is more dominant in July and August over Arizona and New Mexico. As shown in Figure 4.6, the monsoon's influence extends northward into eastern and northern Wyoming (April through June). Note that, during this period (25% of the year), more than twice the expected amount of precipitation falls across portions of Wyoming. During years of drought, the monsoon fails to reach Wyoming. However, during other periods, the monsoon can result in nearly half a year's worth of precipitation as noted in Table 4.D. No strong relationship to El Niño Southern Oscillation (ENSO over the East-Central Pacific Ocean) is evident although all intensities of El Niño appear to dominate. A lesser correlation is noted regarding the Pacific Decadal Oscillation (PDO) index.
Due to topographic influences, different river basins experience dry and wet periods at different times. As shown in Figure 4.6, April to June wet periods dominate eight of the 10 basins across Wyoming. The dry season dominates most basins during the coldest months. In Figure 4.7, the percent of annual precipitation by month shows late spring and early summer as the wettest period of the year for most basins. However, the highest elevations see the greatest monthly precipitation in mid fall and mid spring.
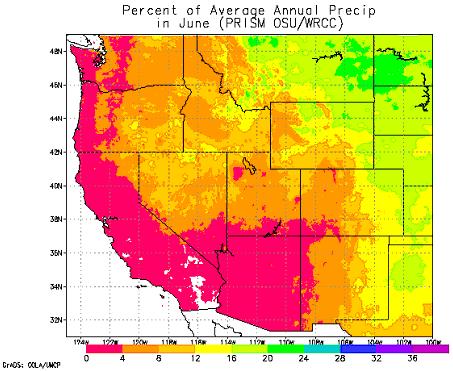
Figure 4.5. June is the peak month under the influence of the summer monsoon over the Front Range of the Rocky Mountains32
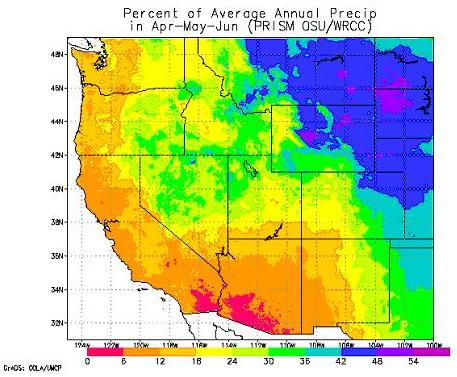
Figure 4.6. April through June percent of average precipitation (1961-1990,PRISM)
Figure 4.7. Lower elevation basin and sub-basin annual precipitation (percent) by month.
Table 4.D. Notable June monsoonal flows over Buffalo, WY show some years when nearly half a year's total precipitation fell during one month
|
YEAR |
Percent of 1971-2000 Annual Average Total |
Intensity, phase, and trend of PDO |
Intensity of ENSO Nino 3.4 |
|
1967 |
48.6 |
moderate warm > |
weak La Niña |
|
1963 |
45.4 |
moderate warm < |
weak El Niño |
|
1992 |
41.8 |
moderate cool < |
moderate El Niño |
|
1995 |
35.2 |
neutral |
weak El Niño |
|
1968 |
35.1 |
moderate warm < |
neutral |
|
1993 |
34.4 |
moderate cool < |
weak El Niño |
|
1975 |
34.2 |
strong warm < |
moderate La Niña |
|
1969 |
29.3 |
neutral |
weak El Niño |
|
1964 |
28.5 |
moderate warm > |
weak El Niño |
|
1982 |
24.8 |
weak cool >> |
strong El Niño |
|
1957 |
24.2 |
weak cool >> |
weak El Niño |
Key: < "decreasing", > "increasing", >> "increasing rapidly"
When examining the record of extra-tropical low pressure centers33 transiting Wyoming or passing within 100 km and 500 km, there has been a gradual decline in the number of systems (Figure 4.8). Since 1976, the inter-annual variability in the number of lows has remained small.

Figure 4.8. Extra-tropical low pressure centers transiting Wyoming (1961-1998) or passed within 100 km and 500 km of Wyoming
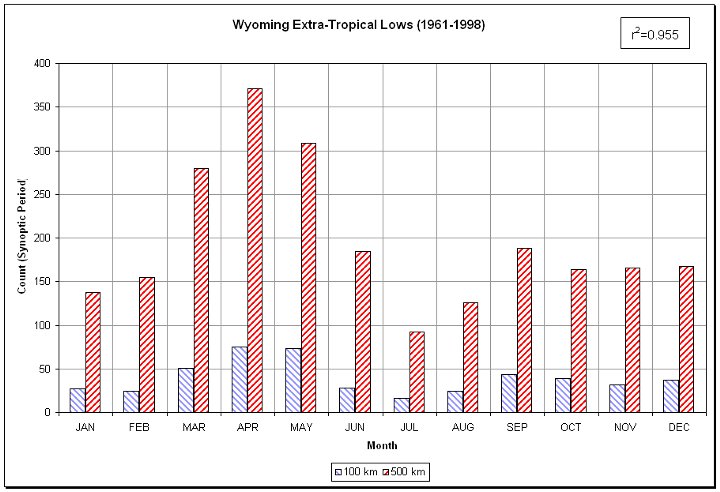
Figure 4.9. The primary period for precipitation in Wyoming is during the spring (1961-1998)
The correlation (r2=0.788) between the number of lows within 100 km and 500 km of Wyoming is statistically significant (>0.999). There were 2,341 synoptic periods (12 hourlies) counted lows within a 500 km buffer of Wyoming and 471 lows within a 100 km buffer. However, when comparing annual precipitation for Wyoming with the number of low pressure systems over or near Wyoming from 1961-1998 there is no correlation. This finding suggests that much of Wyoming's precipitation is derived from upslope and convective air mass thunderstorms. This finding can be argued when comparing springtime correlations between the number of lows in the vicinity of Wyoming and precipitation totals. When comparing month to month statistics (Figure 4.9), there is an obvious maximum frequency of lows transiting the area in the spring.
Finally, in Figure 4.10, the distribution of lows over or within the vicinity of Wyoming is of relatively weak to moderate intensity (85% occur with a minimum SLP between 992 mb and 1008 mb).
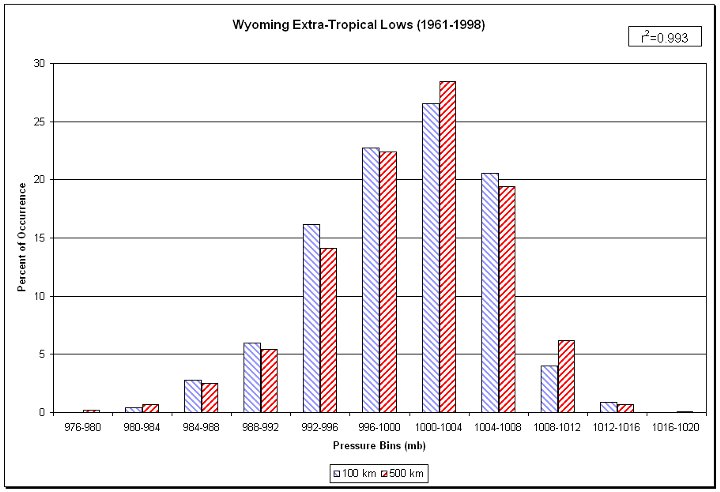
Figure 4.10. The primary intensities of lows in or near Wyoming is of weak to moderate intensity (1961-1998)
Estimated bounds on extreme precipitation events are used in the process of determining the flood-induced forces that structures might experience in their lifetimes. Engineering for flood survival is particularly important for high-hazard structures, such as dams above populated areas. There is usually a direct trade-off between cost and safety that sometimes result in confrontations between industry and regulators.35
Although 100-year storms are rare in one's lifetime for a given location, Wyoming's nearly 100,000 square miles provide ample opportunity for numerous exceptional events to occur every few years. For example: (1) the flash flood in southern Johnson county and the town of Kaycee, WY on August 27, 2002, where radar suggested 7.5 inches fell in about four hours36; (2) Opal, WY on August 16, 1990, where over seven inches fell in two hours37; (3) Cheyenne, WY on August 1, 1985, where a nearly stationary thunderstorm deluged Cheyenne with rain and hail. Six inches of rain fell in six hours producing the most damaging flash flood on record for the state (see chapter 7.8.1) and; (4) Savageton, WY between September 27, 1923 and October 1, 1923, 17.1 inches fell in 108 hours.38 All these events may have actually exceeded a 1,000-year return period.
In Figure 4.11, the 100-year, 24-hour precipitation return period shows a maxima greater than 5.5 inches over the Wind River Mountains, and less than 2.2 inches over the Great Divide Basin and northern Bighorn River basin. This map's depiction of Probability of Maximum Precipitation (PMP) is probably highly generalized as noted by the fairly smooth contours on a relatively coarse spatial scale. This smoothing falsely contributes to an implied degree of high accuracy. Thus the greatest disparities between generalized and site-specific estimates of maximum precipitation amounts appear for short-duration events (<6 hours) over small drainages (10 to 400 mi2).
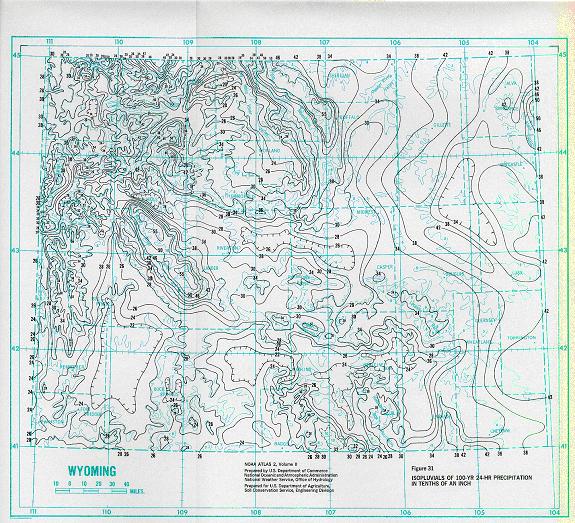
Figure 4.11. The 100-year, 24-hour precipitation return period is depicted in tenths of an inch. For the city of Cheyenne, less than 3.6 inches could be expected in a 24-hour period once every century.41
In Figure 4.12, the 30-day probability return rates for Cheyenne based on data from 1915-2004 show that lesser amounts are nearly 100% certain to occur throughout the year but monthly amounts as high as three inches occur quite often in the spring. More probability return rates for other Wyoming cities can be found in the atlas CD.39
Several studies40 have argued that increasing greenhouse gas concentrations will results in an increase of heavy precipitation events. However, examining the hourly precipitation record for Casper, Cheyenne, Lander, and Sheridan from 1949-2001 for extreme events of > 0.19 and >0.49 inch per hour (~ >3.5% of a station's annual precipitation), Figure 4.13 shows large inter-annual variability. While there is a slightly increasing trend based on a linear fit, no statistical significance can be attributed to this.
Figure 4.12. Statistics for Cheyenne showing 30-day precipitation probabilities for various totals an 89 year period
Figure 4.13. For the period of 1949-2001, hourly precipitation events greater than 0.19 inch and 0.49 inch were summed for Casper, Cheyenne, Lander, and Sheridan (data missing for Sheridan 1990-1992)
Estimation of soil moisture is necessary for a number of natural resource and agricultural applications. Soil moisture estimates are often considered to be proportional to the Thornthwaite precipitation-effectiveness (PE) index. The PE index is an attempt to estimate precipitation effectiveness for plant growth. It has been used by the National Resources Conservation Service (NRCS) for many years in a variety of applications. The equation is based on work by C.W. Thornthwaite published in 1931. The PE index, shown below, is the sum of monthly indices that are calculated with the monthly precipitation (inches) and temperature (F).
PE = Σ12 115 [P/T-10] 10/9
where P is average monthly precipitation (inches) with 0.5 being the minimum value, and T is average monthly temperature (°F) with 28.4° F being the minimum value used in the calculation.
One of the uses of the PE index is the calculation of the climatic factor (C) to characterize wind speed and surface soil moisture used in the Wind Erosion Equation. The climatic factor (C) is calculated using the following equation:
C = 34.48 * V3 / (PE)2
where C is the annual climatic factor, V is average annual wind velocity, and 34.48 is the constant used to adjust local values to a common base.
The equation below is the general form of the relationship currently used by the NRCS to estimate the average annual soil loss (E):
E = f (IKCLV) where,
I is the soil erodibility index, K is the ridge roughness factor, C is the climatic factor, L is the unsheltered distance along prevailing wind erosion direction, and V is the vegetative cover factor.
This illustrates how the C-factor and the PE index value are used as important components of conservation planning and are used to derive soil erosivity estimates.
Another use of the PE Index by the NRCS42a is as a soil climate property. In many of the Official Series Descriptions (OSD) for soils in the Great Plains, the PE Index is included as an element of the geographic setting. It is considered an indicator of the potential for plant growth in this region where moisture is frequently the most limiting factor.
A simpler estimate43 of monthly effective precipitation is contained in Table 4.E.
Table 4.E. Average precipitation effectiveness for plants
|
Total Amount of Precipitation in Any Month |
Monthly Precipitation Considered Effective |
Accumulated Total |
|
Part of each inch increment |
||
|
Inches |
Percent |
Inches |
|
1 |
95 |
0.95 |
|
2 |
90 |
1.85 |
|
3 |
82 |
2.67 |
|
4 |
65 |
3.32 |
|
5 |
45 |
3.77 |
|
6 |
25 |
4.02 |
|
over 6 |
5 |
----- |
In a 4-year period, increased variability in rainfall results in the same long-term average amounts, but impacts the ecosystem in two ways. First, the grassland biomass is reduced by fewer precipitation events with greater rainfall amounts per event as compared to more events with lesser rainfall amounts per event. Second, plant species diversity increases. Thus, these findings suggest that the prairie can exhibit rapid changes to its biodiversity even though the climate rainfall totals do not show long-term trends. In Figure 4.14, the inter-seasonal precipitation during the critical April-June time frame reveals that most of the Northern Plains can experience up to 70% variation between the highest 20th and lowest 20th percentiles.
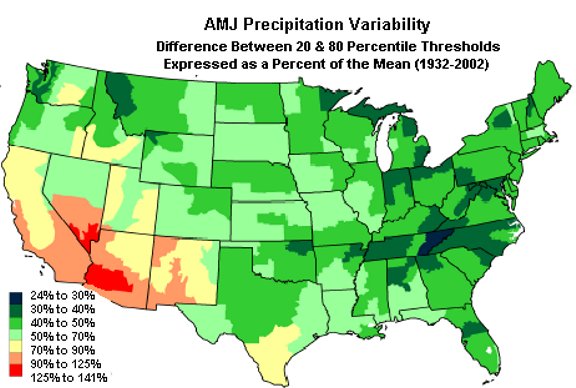
Figure 4.14. April through June precipitation variability for the U.S. based on 1932-2002 means
If the total amount of water vapor in the atmosphere were concentrated into a layer of liquid, this amount would be referred to as precipitable water (h). The importance of knowing what the h is relates to forecasting thunderstorms and making first-order predictions of the opacity of the atmosphere. Generally, for thunderstorms to occur at Riverton, the supply of moisture in the atmosphere should be at least 0.6 inch (15 mm). Given a conditionally unstable atmosphere, isolated thunderstorms with measurable precipitation could occur and, with 0.80 inch or greater h, scattered thunderstorms that could generate over 0.25 inch of precipitation are possible. Figure 4.15 shows the range of values for h from 1948-2000 for the atmosphere up to 300 mb. Many other factors come into play, to list a few: stability of the atmosphere, vertical wind profile, temperature, moisture advection, and the level where the most moisture is present (around central Wyoming, ideally moisture between the 700 mb and 500 mb layer or 10,000 feet to 18,500 feet helps to produce thunderstorms). Although a warm atmosphere can hold more water than a cold atmosphere, so an unstable profile with a surface temperature of 60°F and an h of 0.50 inch will result in more condensation, clouds and potential for thunderstorms and rainfall, than one with a surface temperature of 90°F and the same precipitable water value.45
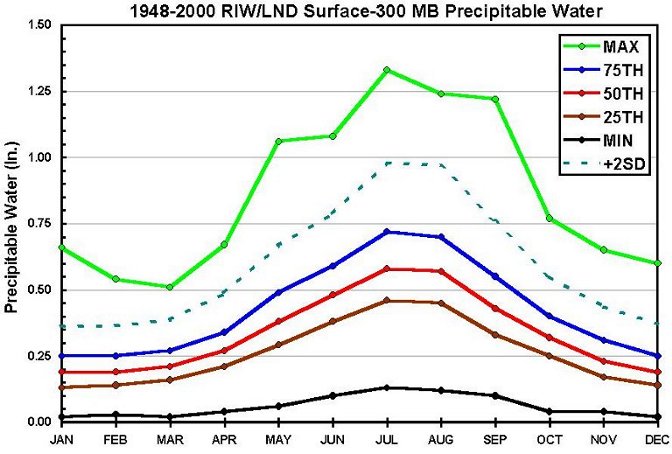
Figure 4.15. Precipitable Water from Lander/Riverton Rawinsondes (1948-2000).45a
Opacity (atmospheric attenuation) on the other hand impacts the propagation of millimeter-wavelengths. Since accurate measurements of h are limited to rawinsondes and remote atmospheric sounders, a method for estimating precipitable water at the surface is very useful and has been derived (Butler, 1998).46
The approximate value of h is:
h ∼ Po (3To)-1, where
h is in mm, Po is the water vapor partial pressure at the surface in μbar, and To is the surface temperature in ° Kelvin.
The h has been derived at Wyoming's first order weather stations based on hourly observations from 1961-1990. On average, precipitable water over Wyoming is quite low, especially during the cooler half of the year. The maximum values occur in summer at double or triple the winter values (Figure 4.16 (Casper), Figure 4.17 (Cheyenne), Figure 4.18 (Lander), and Figure 4.19 (Sheridan)). Diurnal variation in winter is about 20% while in summer is practically zero (not shown).
A new method for determining water vapor is discussed in Chapter 1.3 using GPS signal slant path delays due to variable atmospheric opaqueness.47 Because water vapor is so critical in forecasting weather and modeling climate, this technology is hoped to provide valuable data for in the future.
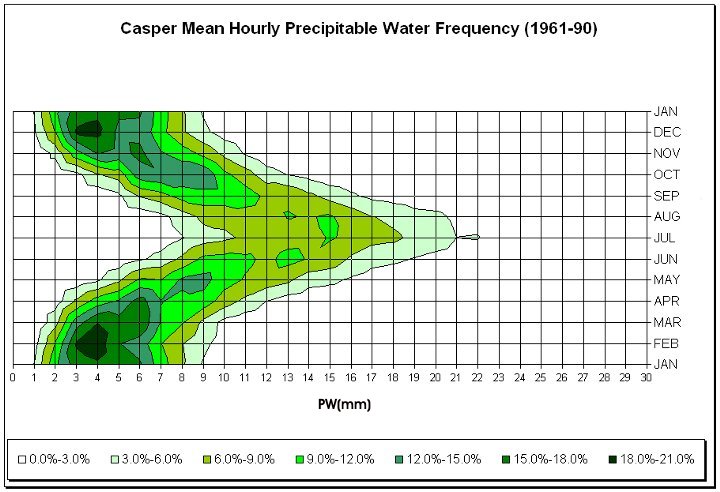
Figure 4.16. Casper precipitable water frequency based on hourly reports (1961-90)
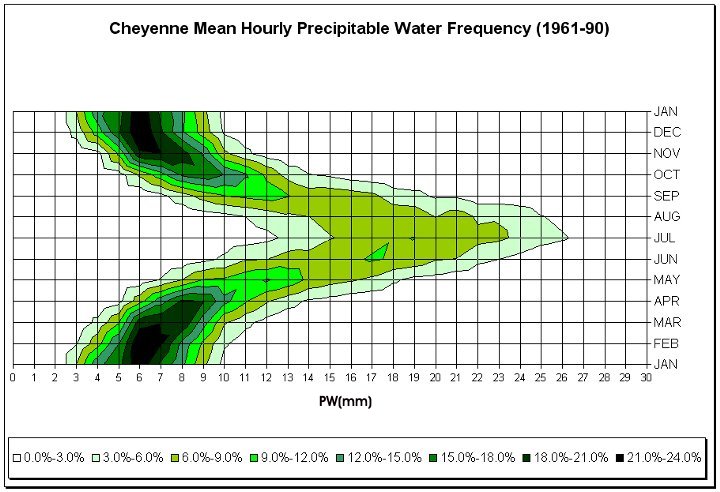
Figure 4.17. Same as Figure 4.16 except for Cheyenne
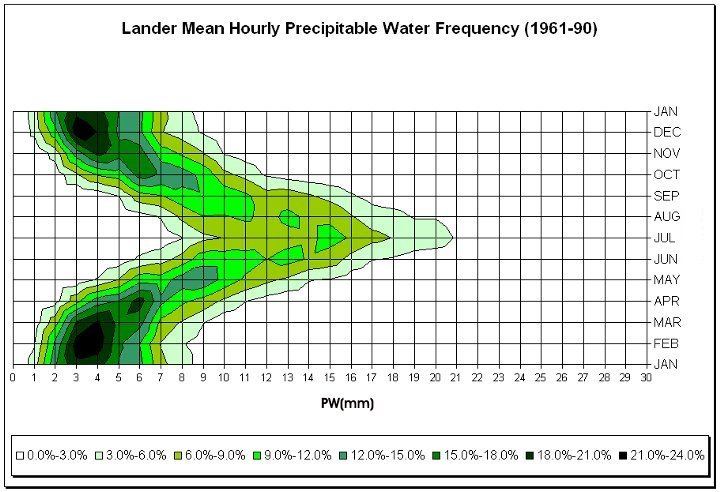
Figure 4.18. Same as Figure 4.16 except for Lander
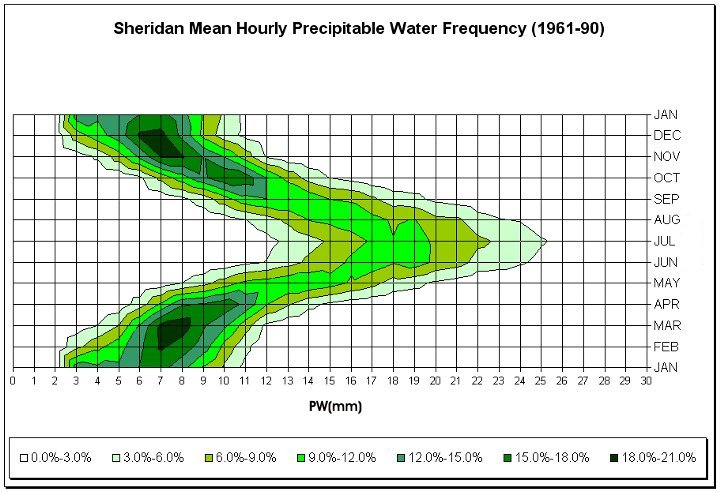
Figure 4.19. Same as Figure 4.16 except for Sheridan
Through the use of products such as PRISM, Geographical Information Systems (GIS) software now allows for numerous analyses that could not be performed in earlier days. One such effort involves quantifying the percent of precipitation as a function of elevation. Because of PRISM's high spatial resolution based on actual and modeled data, each grid point can be compared directly without the need for interpolation. In Figure 4.20, precipitation is clearly shown as function of elevation. Note that elevations below 7,000 feet contribute less precipitation than at higher elevations. For example, between 6,000 and 7,000 feet, there is nearly 7% less precipitation than land at that elevation. This is significant because the mountains serve as this state's natural reservoir and are the only locations where precipitation exceeds evaporation. If more precipitation were to fall at lower elevations, the state would still be arid, since the net difference between evaporation and precipitation exceeds 25 inches each year on average.
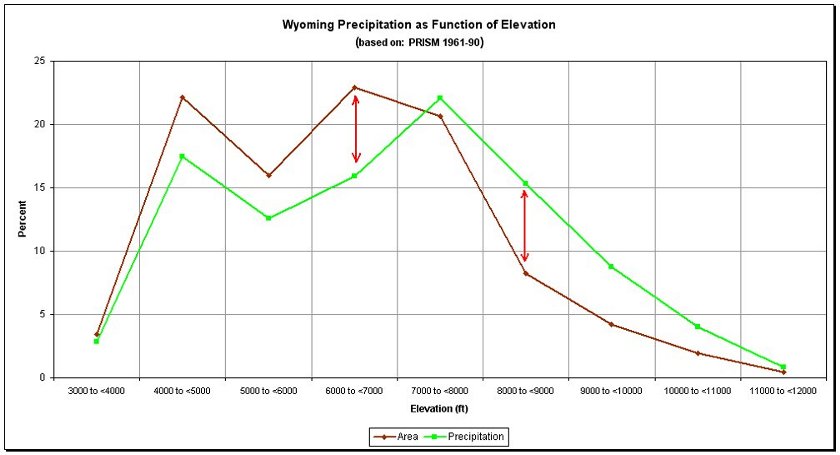
Figure 4.20. Wyoming precipitation as a function of elevation based on 1961-90 PRISM data
As was noted earlier in this chapter, precipitation when it occurs, generally results in light hourly rates. As shown in figure 4.21, for the period of 1961-1990, Casper, Cheyenne, Lander, and Sheridan have precipitation events mostly occur from the northeast (Casper) to the northwest (Sheridan).
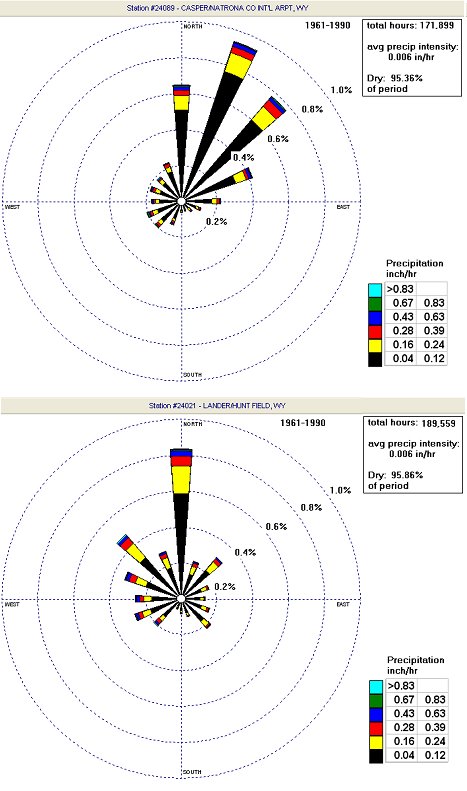

Figure 4.21. Annual precipitation rose for Casper, Cheyenne, Lander, and Sheridan (1961-1990)
In figure 4.22, annual precipitation events as a function of wind direction is shown. Note Casper's 1972-3 precipitation anomaly with north-northeast winds and Sheridan's dominant west-northwest to northwest precipitation frequencies.
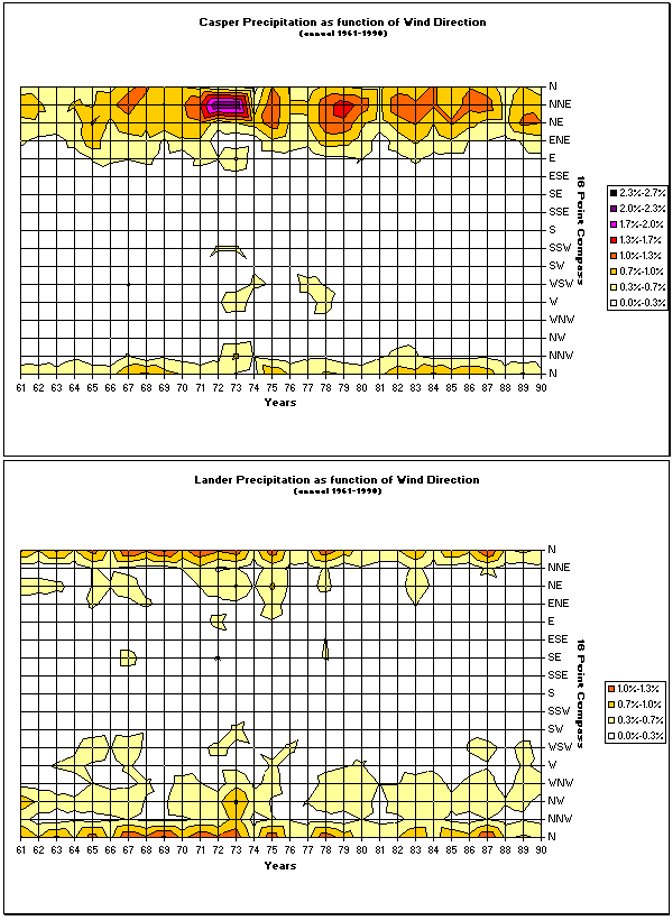
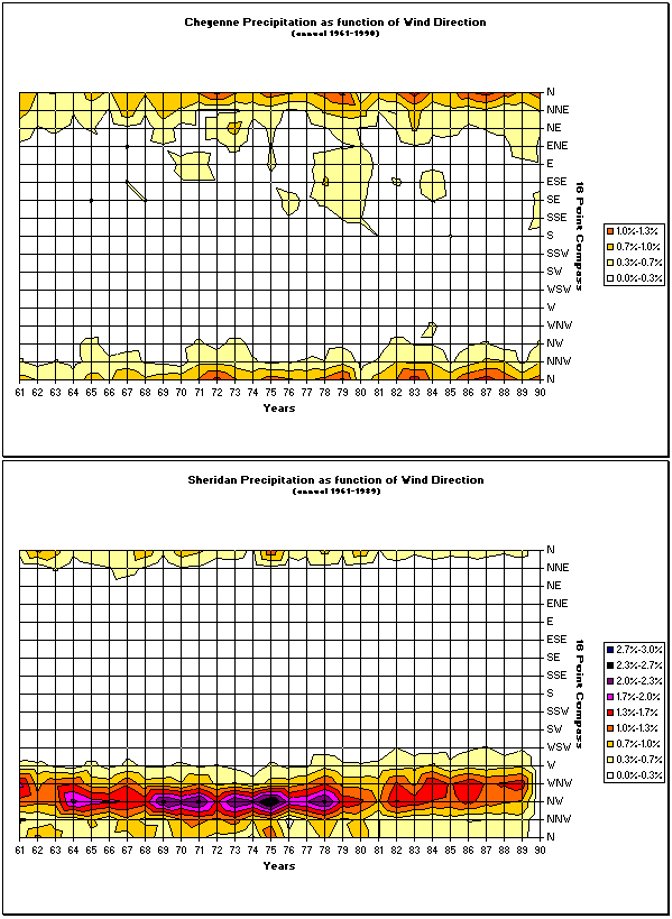
Figure 4.22. Annual precipitation as a function of wind direction for Casper, Cheyenne, Lander, and Sheridan (1961-1990)
When comparing Figure 4.1 (annual precipitation) to Figure 5.3 (annual snowfall), one can approximate the snow-water equivalency of Figure 5.3. Figure 4.23 (measured in cm) shows this estimate. It is interesting to note that mountain snows account for between 40 and 70 percent of the annual precipitation that falls but that over lower basins, snowfall accounts for less than 40 percent of this total.
Figure 4.23. Estimated SWE during the snow accumulation season in Wyoming47a
30. http://www.nws.noaa.gov/ohd/hrl/papers/papers.htm#wsr88d
31. http://www.ocs.orst.edu/prism/docs/tech_desc.html
31a. http://www.ocs.orst.edu/prism/doc.html
32. CD: precipitation, graphs, Prism_annual_fraction_west folders
33. http://www.giss.nasa.gov/data/stormtracks/
34. http://hdsc.nws.noaa.gov/hdsc/pfds/other/wy_pfds.html
35. http://rams.atmos.colostate.edu/precip-proj/articles/article1.html
36. http://www.crh.noaa.gov/riw/archive/kaycee.htm
37. http://www.nws.noaa.gov/oh/hdsc/studies/pmp.html#HR55A
38. http://www.nws.noaa.gov/oh/hdsc/studies/pmp.html#HR57
39. CD: precipitation, graphs, probability folders
40. Trenberth, K.E. 1998. Atmospheric moisture residence times and cycling: Implications for rainfall rates with climate change. Climatic Change 39: 667-694.
41. http://www.wrcc.dri.edu/pcpnfreq.html, Western U.S. Precipitation Frequency Maps, NOAA Atlas 2 published in 1973. (HDSC/NWS Office of Hydrology)
42. Dwain Daniels and Dr. Greg Johnson, Development of a New Precipitation-Effectiveness Index: http://gis.esri.com/library/userconf/proc01/professional/papers/pap466/p466.htm
42a. http://www.nm.nrcs.usda.gov/technical/fotg/section-1/references/weq-prediction-guide.html
43. Wyoming Water Planning Report No. 5, Water Resources Series No. 19.
44. Knapp, et al., Rainfall Variability, Carbon Cycling, and Plant Species Diversity in a Mesic Grassland (13 Dec 2002, Vol 298 Science, pp 2202-2205)
45. Correspondence with Art Meunier, Webmaster/Forecaster, WFO Riverton, WY
45a. http://www.crh.noaa.gov/unr/climate/pw/index.php
46. http://www.alma.nrao.edu/memos/html-memos/abstracts/abs237.html
47. http://www.gpsmet.noaa.gov/labreview/2004/gpsMetTechReview2004.pdf
47a. Courtesy of Tabler and Associates
State Climate Office | Water Resources Data System
Last Modified: Fri, 23 May 2025