 DroughtDrought
When Mark Twain remarked that, in the West, liquor is for drinking and water is for fighting, he wasn't very far from the truth. Water, Wyoming's most limited and important natural resource, contributes to our quality of life. The uses of water cover the spectrum of human activity from agriculture to recreation. Compacts and decrees between states limit the amount of water any state can access, store, and use. This is a particularly important issue since Wyoming is headwater to five significant rivers and has 10 important river drainages. When drought occurs, its immediate impact is a stark reminder that we live in a semiarid climate and must conserve, manage, and wisely use entitled water by all effective means that technology, law, and common sense allow.
Drought is by no means unusual or unnatural. Of all the natural disasters, drought is by far the most costly to our society. It indirectly kills more people and animals than the combined effects of hurricanes, floods, tornadoes, blizzards, and wildfires. And, unlike other disasters that quickly come and go, drought's long-term unrelenting destruction has been responsible in the past for mass migrations and lost civilizations. The 1980 and 1988 droughts in the US resulted in approximately 17,500 heat-related deaths and an economic cost of over $100 billion during the past quarter of a century.52
Drought occurs in four stages and is defined as a function of its magnitude (dryness), duration, and regional extent. Severity, the most commonly used term for measuring drought, is a combination of magnitude and duration. The first stage of drought is known as a meteorological drought. The conditions at this stage include any precipitation shortfall of 75% of normal for three months or longer. This criterion can be misleading if all the precipitation falls in a very short time period resulting in floods.
Additionally, winter precipitation is usually two to six times less than summer precipitation and these so-called seasonal droughts are normal in our semiarid climate. Conditions are often made worse with high temperatures, high winds, low humidity, and greater sunshine; all of these factors contribute to increased evaporation and transpiration and result in reduced soil infiltration, runoff, deep percolation, and groundwater recharge. The second stage is known as agricultural drought. Soil moisture is deficient to the point where plants are stressed and biomass (yield) is reduced. The third stage is the hydrological drought. Reduced streamflow (inflow) to reservoirs and lakes is the most obvious sign that a serious drought is in progress. The fourth stage is the socioeconomic drought. This final stage refers to the situation that occurs when physical water shortage begins to affect people.
As these stages evolve over time, the impacts to the economy, society, and environment converge into an emergency situation. Without reservoir water to irrigate farms, food supplies are in jeopardy. Without spring rains for the prairie grasslands, open range grazing is compromised. Without groundwater for municipalities, the hardships to communities result in increases in mental and physical stress as well as conflicts over the use of whatever limited water is available. Without water, wetlands disappear. The quality of any remaining water decreases due to its higher salinity concentration. There is also an increased risk of fires, and air quality degrades as a result of increased soil erosion in strong winds (blowing dust).
The most recent statewide drought that began in earnest in the spring of 2000 over Wyoming is considered by many to be the most severe in collective memory. However, some old timers have indicated that they remember streams drying up in the 1930s and 1950s. According to instrument records, since 1895 there have been only seven multi-year (three years or longer) statewide droughts (Figure 6.0). Based on deficit precipitation totals (negative departures from the long term average), they are ranked statewide (Table 6.A.) and by climate divisions (Table 6.B.).
Figure 6.0. Wyoming Palmer Hydrological Drought Index (1900-2004) showing the seven worst multi-year droughts in terms of this standard measure. Note that the 6th worst drought appears worst than the state's 5th worst drought when using this index.
|
Table 6.A. Wyoming recent worst multi-year, statewide droughts |
|
Period |
Drought Deficit (departure from annual precipitation) |
|
1952-1956 |
94% |
|
1999-200x (thru 2003) |
82% |
|
1958-1964 |
77% |
|
1900-1903 |
72% |
|
1931-1936 |
61% |
|
1987-1990 |
61% |
|
1974-1977 |
41% |
|
Table 6.B. Wyoming climate divisions recent worst droughts as a % of annual average precipitation deficit |
|
Greatest Total Deficit |
Greatest Average
Annual Deficit |
Climate Division |
|
1931-1936 116% |
1998-200x 23% (thru 2003) |
CD1: Yellowstone |
|
1987-1992 106% |
1958-1962 21% |
CD2: Snake/Salt |
|
1900-1903 120% |
1988-1990 34% |
CD3: Bear/Green |
|
1948-1956 211% |
1933-1936 25% |
CD4: Big Horn |
|
1959-1961 79% |
1959-1961 26% |
CD5: Powder-Tongue |
|
1930-1940 180% |
1952-1954 21% |
CD6: Belle Fourche |
|
1958-1961 96% |
1958-1961 24% |
CD7: Cheyenne |
|
1974-1980 110% |
1952-1954 22% |
CD8: Lower N. Platte |
|
1979-1990 229% |
1999-2002 32% |
CD9: Wind River |
|
1952-1956 114% |
1952-1956 23% |
CD10: Upper N. Platte |
|
Table 6.C. Percent of consecutive months
(CM) with below normal monthly |
|
CM |
CD1 |
CD2 |
CD3 |
CD4 |
CD5 |
CD6 |
CD7 |
CD8 |
CD9 |
CD10 |
ALL |
|
3 |
31 |
39 |
33 |
44 |
33 |
35 |
44 |
45 |
36 |
39 |
42 |
|
4 |
27 |
29 |
34 |
22 |
32 |
25 |
28 |
15 |
22 |
21 |
28 |
|
5 |
13 |
7 |
7 |
13 |
10 |
17 |
11 |
12 |
16 |
13 |
11 |
|
6 |
15 |
11 |
6 |
8 |
9 |
10 |
7 |
7 |
6 |
14 |
7 |
|
7 |
6 |
7 |
6 |
6 |
3 |
5 |
4 |
4 |
7 |
7 |
4 |
|
8 |
4 |
4 |
2 |
1 |
2 |
2 |
4 |
12 |
3 |
2 |
1 |
|
9 |
1 |
1 |
4 |
2 |
5 |
1 |
1 |
1 |
3 |
1 |
4 |
|
10 |
|
1 |
5 |
2 |
3 |
2 |
1 |
3 |
3 |
1 |
2 |
|
11 |
|
|
1 |
2 |
|
|
|
|
2 |
|
1 |
|
12 |
2 |
|
1 |
|
|
2 |
|
|
1 |
1 |
|
|
13 |
|
|
|
|
|
|
|
1 |
|
|
|
|
14 |
|
|
1 |
|
|
|
|
|
|
|
|
|
15 |
|
|
|
|
|
|
|
|
|
|
|
|
16 |
|
|
|
|
1 |
|
|
|
|
|
|
This does not mean that droughts cannot occur in isolation from other river basins. In fact, Wyoming averages severe or extreme drought conditions 10% in the eastern plains to more than 20% of the time over the southwest regions of the state.
These percentages are nearly doubled if all drought levels are considered (mild to exceptional). The frequency of consecutive monthly (CM) precipitation deficit totals based on 1895-2001 monthly averages for each climate division are shown in Table 6.C. Between 31% to 45% of the time, a meteorological drought is occurring within a climate division and generally between 80-90% of these events last no longer than six months, although below normal precipitation has been known to last up to 16 straight months. All climate divisions having a monthly precipitation deficit at the same time occur about 17% of the time during any dry or wet season. While entire years have precipitation deficits, it is rare that every month during that year has below normal precipitation. Widespread droughts in Wyoming, as determined from streamflow records, were most notable during three periods: 1929-1942, 1948-1962, and 1976-1982.53 In Tables 6D through 6G53-1, hydrological conditions using annual stream flow as proxy data for some of the major river basins during the past 30 years in Wyoming reveals that wet and dry years usually, but not always, occur simultaneously across nearby and adjacent drainages. Notes that in the later half of 1990s, generally wet conditions prevailed across much of Wyoming.
This section, written by Stephen T. Gray54, explores the long-term perspectives on Wyoming drought based on the tree-ring record.
Numerous studies from throughout the world demonstrate that instrumental weather records are insufficient for capturing the full range of climate that the people in any region should expect and plan for. This is particularly true for understanding extreme events like droughts. The length of these instrumental records rarely exceeds 100 years and, therefore, provides only a small sample of single- and multi-year drought events. Furthermore, instrumental records cannot effectively be used to examine long-term (> 50-year) trends and cycles that may underlie year-to-year precipitation variability.
Most trees in the western U.S. produce a single layer of growth called a "tree-ring" for each year of their lives. During years of favorable climate, trees will produce wide rings compared to the narrower rings formed in years of unfavorable climate.
Tree-rings, therefore, provide a means for developing long-duration climate records that can overcome most of the limitations inherent to instrumental observations. Tree-rings yield continuous, exactly-dated proxies of climate that are highly replicated. When properly analyzed, tree-rings provide records of seasonal to annual climate, and can be used to assess climate variability on time scales of decades to millennia.
By sampling trees growing on dry sites such as rock outcrops, scientists can relate tree-ring size to precipitation variability. When working with live trees, the wood that scientists need to analyze tree-ring patterns is usually obtained with an instrument known as an increment borer. The increment borer is, essentially, a hollow drill bit that provides a long cylinder of wood from the interior of a tree with little or no damage to the sampled tree. Scientists can also use tree-rings found in dead wood to extend the length of their records.
A technique known as "crossdating" uses patterns of large and small tree-rings to date wood of an unknown age against tree-ring records from living trees. Crossdating also allows scientists to confirm that the correct date was assigned to each tree-ring within their records.
While, over the past 40 years, tree-rings have commonly been used to reconstruct the climate of the southwestern United States, the systematic use of these dendrochronological (literally the "science of tree time") techniques to understand Wyoming's climate is relatively new. One recent study from the Bighorn Basin shows the promise of such methods for understanding drought in Wyoming. In this study, wood samples were collected from 95 Douglas-fir, ponderosa pine, and limber pine trees at five sites in the Bighorn, Pryor, and Absaroka mountains (Figure 6.1). Samples from these trees were used to develop a record of annual precipitation spanning 1260-1998 A.D. Results from this study show that single-year dry events before the instrumental period (1895-Present) tended to be more severe than those after 1900 (Figure 6.2). In general, multi-year dry events were longer and more severe prior to 1900. Dry events in the late-13th to mid-18th centuries surpass both the magnitude and duration of any droughts seen in the Bighorn Basin after 1900. The 14th, 15th, and 16th centuries are also notable for large numbers of droughts having greater magnitude and duration than any events in the instrumental period.
Trees from the foothills of the northern Uinta Mountains and the southern Salt Range provide insights on drought variability in southwestern Wyoming. Figure 6.3 shows reconstructed Palmer Drought Severity Index (PDSI) values for the Green River Basin region (Figure 6.1) from 1250-2000 A.D. High PDSI values indicate wet conditions while negative values represent droughts. Estimates for PDSI values prior to the instrumental period (1895-Present) were derived from the measurement of limber pine and pinyon pine tree-rings at four sites surrounding the basin. Samples from 102 trees (both living and dead) are included in the reconstruction.
While the 20th Century dry-events recorded in these trees were quite severe, several droughts prior to instrumental period (e.g., 1576-1590, 1620-1637, and 1773-1786) likely equaled or exceeded their duration.
A number of pre-instrumental droughts, particularly those in the 1500s through mid 1600s, were of greater magnitude or severity than any dry events after the early 1900s. The late-13th Century is particularly notable for the occurrence of a severe, 50-year drought.
These and other tree-ring studies from throughout the region suggest that severe, long-duration (>10 year) droughts are a common feature of Wyoming's climate and the climate of the Rocky Mountain West at large. While the droughts of the 1930s and 1950s were extreme events in terms of their social and economic impacts on Wyoming, the tree-ring record shows that the climate system is capable of producing longer and stronger droughts. Moreover, in some areas (i.e., southwest Wyoming) portions of the 20th century were marked by wetter than average conditions.
This means that predictions of future water availability based on stream gauge and instrumental weather observations during these years may be biased by abnormally high precipitation.
Overall, long dry-spells are a normal part of life in Wyoming. This knowledge should, in turn, affect how we plan for Wyoming's economic and agricultural development. We must also incorporate this fact into our management of natural resources and include severe, sustained droughts in our plans for timber production, wildland, and prescribed fires, non-native plant invasions, and water resources. Planning efforts should consider a wide range of climate scenarios, including droughts of different lengths, magnitudes, and intensities. Such scenarios may be derived from long-term proxies of climate variability such as those provided by tree-rings, but might also be obtained from model simulations of past and future climates. In any case, we must consider severe, sustained droughts to be an inevitable part of Wyoming's future.55, 56
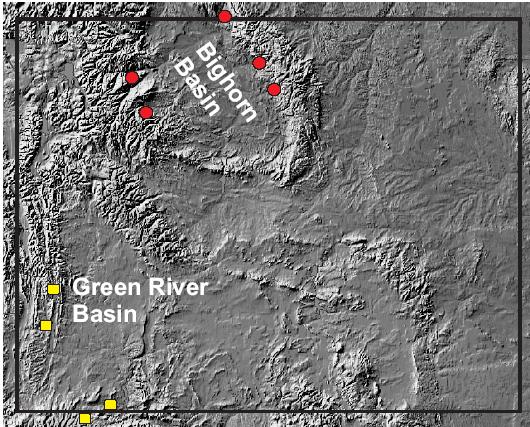
Figure 6.1. Map of Wyoming with tree-ring sites used in the Bighorn Basin (circles) and Green River Basin (squares) climate reconstructions
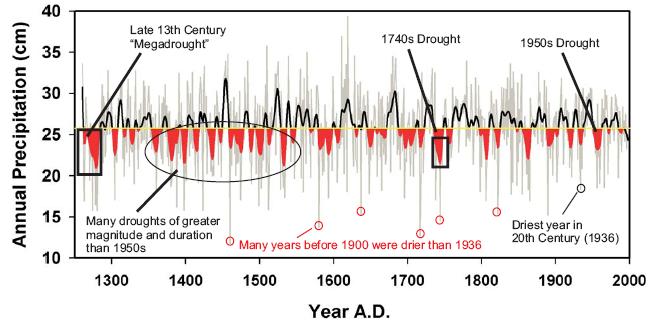
Figure 6.2. Reconstructed annual precipitation (in centimeters) for the Bighorn Basin region. Annual values are shown in gray. The 10-year running average of precipitation is plotted against the long-term mean (yellow line) with multi-year droughts shown in red.

Figure 6.3. Reconstructed (June) Palmer Drought Severity Index (PDSI) values for the Green River Basin region. The 10-year running average of PDSI is plotted against the long term-mean (yellow line) with multi-year droughts shown in red.
As a whole, Wyoming's precipitation record from 1895-2003 reveals that, for the first half of the 20th century (except for the Dust Bowl years of the 1930s), there was generally a surplus of moisture. During the second half of the century there was an increasing trend of increased periods of drought (Figure 6.4 and Figure 6.5).
Figure 6.4. Wyoming net annual precipitation accumulation based on the 1895-2004 annual statewide average of 13.06 inches
Figure 6.5. Wyoming Annual Precipitation (1895-2004)
Here are a few important traits of precipitation:
1) Unlike all of the other weather parameters, precipitation comes in episodes. Depending on where you are in Wyoming, precipitation falls about one in four or five days, and during a day with precipitation, it falls between 16-21% of the time. What does fall is usually very light (about 90% of the time, only 0.01 inch is recorded per hour) Table 4.B. shows the frequency of hourly precipitation amounts when precipitation occurs (1949-2001). More than half of the total days with precipitation occur with amounts not exceeding 0.05 inch (0.07 inch in Lander).
2) At any given point, annual precipitation totals can vary from about 57% of the long-term average in a very dry year to 55% above the average in a very wet year. In shorter intervals, the variability is even greater. Monthly the average variations range from nearly 10% of normal during a dry month to over four times the normal during wet ones.
3) The fraction of annual precipitation that falls as snow varies greatly across Wyoming. It ranges from less than 30% over lower elevation basins to more than 80% at high elevations in Wyoming's Wind River and Teton Mountains. This has a major bearing on our water balance and helps to determine how much moisture evaporates, soaks into the ground, or runs off to become streamflow and reservoir supply.
There are several methods for determining drought. One of the most popular is known as the Palmer Drought Index58:
The Palmer Index was developed by Wayne Palmer in the 1960s and uses temperature and rainfall information in a formula to determine dryness. It has become the semi-official drought index. However, in the west much of the surface water is derived from mountain snowpack (i.e., the snow-water equivalent (SWE) as measured at a number of SNOTEL sites).
Another popular index used to determine drought is the Standardized Precipitation Index. 59 This index measures the precipitation departure using the 1971-2000 average monthly totals.
Another index used to measure drought involves soil moisture. This is a highly complex element that is difficult to accurately determine because there are few weather stations that directly measure surface and subsurface moisture and because precipitation and soil type are highly variable over a given region.
Additionally, accuracy of direct measurement deteriorates when the soil temperature is below freezing. However, remote sensing from satellites can indicate the health of vegetation 59a by measures of greenness which can be used to indirectly determine soil moisture.
Streamflow is a good measure of how effective the snowpack is at filling reservoirs and lakes within the state. If the ground is very dry, a healthy snowpack, when it melts, will first be absorbed by the ground. Once the ground is recharged with adequate moisture, the remaining melt will flow to the basins and valleys through rivers and manmade diversions. Eventually reservoirs will fill. Rapid spring melt can help temporarily refill reservoirs but soil recharge is held to a minimum. A hydrological drought will probably still persist in the long term under this scenario.
The final ingredients for determining drought are past accumulation and the amount of precipitation forecasted. In Wyoming, the April and May precipitation is critical for adequate prairie grassland growth. If the rains are late, the summer heat will reduce or completely eliminate any yield. Since rangeland is not normally irrigated, the short-term, spring weather forecast must be accurate to ensure the most effective management of these lands. Farmers who depend on irrigation will know if drought can be expected if the 1 April snowpack is below normal and if the reservoirs are below 80% of their long term average levels. Percent of capacity of reservoirs is not a good standard to use because every reservoir's water level varies widely from one another throughout the year due to different management practices and environmental conditions. For example, water quality and endangered species protection require managers to maintain minimum downstream outflow. There are also large inactive conservation reserves and dead water allocations in reservoirs that are part of total capacity but cannot be used in any way.
So, the question as to how one makes use of all this information to determine the beginning, intensity, and end of a drought has been answered to some degree by the development of a drought trigger nomogram (Figure 6.6).
The methodology used for this colorful chart starts by looking at the 1 October reservoir levels (the start of the water year). If levels are less than 80% of normal, a drought alert is issued. Next, the 1 April reservoir levels are determined and compared with existing SWE and forecasted spring and summer streamflow and/or spring and summer precipitation forecast. If, for example, the reservoir level is 70%, the SWE is 90%, and the precipitation forecast and/or streamflow forecast is 80% of normal, then the reservoir drought index is considered "yellow", which means that there is a mild drought. Since streams tend to thaw after 1 April, stream gauge accuracy improves, and the next step is to use the upper left hand template (average weekly streamflow). If, as in this example, the weekly streamflow is at the less than 10 percentile level, then the drought index is considered "orange", or at a moderate drought level for agricultural and recreational interests. However, since drought is also determined by soil moisture, the template on the lower right circle can also be used. Let's say that the soil moisture is mildly dry (see rangeland table on Figure 6.6), "yellow", but the April precipitation forecast (using the same rings as the April-September precipitation forecast) is for less than 60% of normal. Then, the rangeland index is determined to be "red", or severe, for ranching interests. Note that, independent of the April 1 soil moisture conditions, average precipitation during the 60 days following 1 April will probably result in normal or near normal grass yields.
Figure 6.6. Wyoming drought triggers nomogram (higher resolution)
Now, with this methodology, one would need to increase the values of the rings within each circle by 10 percent for each drought year as determined by the greater than one year drought modifications table in Figure 6.6. Additional adjustments for much above or below average summer temperatures should be made as well. The SWSI in the table refers to the Surface Water Supply Index60 which is produced between January and May using reservoir and streamflow data. No annual adjustment is required for the SWE or April-September streamflow forecast for rangeland forecasted conditions.
Discussion about drought would not be complete without some mention about the merits of cloud seeding to artificially enhance precipitation. Based on the collective evidence from the various studies and operational projects, capability statements have been published by the Weather Modification Association, the American Meteorological Society, and the World Meteorological Organization. For precipitation augmentation, the accepted magnitude of increase to be expected from well-designed and properly conducted projects ranges from 5 percent to 20 percent for winter precipitation in continental regions.62 However, there are some physical considerations that may make the application of cloud seeding less than beneficial during periods of drought. In order for static cloud seeding to be effective, that is seeding in winter from fixed locations, the atmosphere must have adequate moisture (clouds) and prevailing upslope winds. These conditions occur less often in drought, thus making any enhancement of precipitation less likely. Additionally, science demands that any claims of the effectiveness of cloud seeding be verifiable, repeatable, and based on known physics. Since cloud seeding occurs in an open, uncontrolled environment, unexplained and unmeasured external factors probably skew any results and making future trials impossible to duplicate.
In a news release by CNN on November 12, 2003, the National Research Council, an arm of the National Academy of Sciences, said: "...while clouds across the globe have been seeded for 60 years to increase rainfall and reduce hail, there is no convincing evidence it works". Even if the claims of 5% to 20% total increase are true, the cost-to-benefit ratio may still be too high for most local and regional governments to afford.
During drought, one attempt to mitigate the frequency and intensity of wild fires is to conduct a pre-emptive strike by conducing prescribed burns. The following is provided by permission from Dr. Higgins, et al.
There is probably no element of a prescription burn more important than weather. Wright and Bailey (1980) contend that the secret to all prescribed burning is to let the weather work for you.Weather is the main controlling agent of fire behavior, smoke behavior, fuel condition and flammability, and fire containment; all of these affect the success and safety of the burn.
The weather variables most applicable to prescription burns are air temperature, relative humidity, wind direction, wind speed, precipitation, and air mass stability (Sando 1969). Because most of the NGP has low topographic relief, general weather patterns are usually not affected by topographic features.
A combination of wind speed, relative humidity, temperature, and solar insulation largely determines fuel condition which, in turn, affects fire behavior.
Seasonal wind direction is important when burning near areas having restrictions or smoke regulations. Daily and seasonal precipitation patterns often determine when burns can be conducted, whereas days since measurable precipitation (greater than 1 mm, or 0.01 in) determine the severity of the fire or completeness of a burn in terms of fuel consumption.
Air temperatures higher than 20 degrees C (68 F) are recommended when prescriptions call for total fuel consumption. These include initial reclamation burns or burning to reduce undesirable plant species and medium to heavy coarse fuels like brush or trees.
Hot (high intensity) fires also produce higher risks than cool (low intensity) fires, thus requiring more emphasis on control measures.
Day length in the NGP varies from 8 hr in December to 16 hr in June. Hottest parts of a day during the main burning season (March-November) generally occur between 1100 and 1600 hr. Temperatures generally drop after 1600 hr and are usually coolest within 2 hr of daybreak.
Fire behavior and fuel conditions are most unpredictable when temperatures are rising during morning hours. This should be considered in any burn action plan. Temperatures between 21 and 32 degrees C (70 to 90 F) would be optimum for complete burns in the NGP.
Relative humidity is an expression of the actual amount of moisture in the air compared to the total amount the air is capable of holding at that temperature and pressure.
A temperature rise of 11 degrees C (20 F) from sunrise to midafternoon reduces the relative humidity by about one half. A similar temperature drop in late afternoon or early evening can cause relative humidity to rise by twofold.
However, when a cold front passes over an area, the temperature drop is usually accompanied by a drop in humidity. The lower humidity is a result of a change in air mass from warm and moist to cold and dry.
Preferred relative humidity for prescribed burning varies from 25 to 50%. Under certain conditions, a wider range of relative humidities - as low as 20% and as high as 80% - can produce satisfactory burns.
When relative humidity is as low as 20%, prescribed burning is dangerous because fires are more intense and spotting is more likely. When the relative humidity is higher than 50%, fires may not burn an area completely or may not burn hot enough to accomplish the desired result.
Relative humidity changes can quickly affect the moisture content and flammability of grassland fuels Increases in air temperature and solar radiation cause relative humidity to drop, and falling temperatures and cloudiness or darkness cause relative humidity to rise.
Because relative humidity is so dependent on temperatures, sunlight, and precipitation, it is not a good weather variable to use for predicting fire behavior. Grassland fuels can be burned under certain conditions at any level of relative humidity (0 to 100%); however, we recommend that most prescription burns be done when relative humidity is between 20 and 80%.
Prescribed fires behave in a more predictable manner if some wind movement is present.
The most desirable wind speeds for burning in the region are fairly steady winds between 8 and 29 km/h (5 and 18 mph), but specific conditions may tolerate higher speeds.
Persistent winds from a constant direction before, during, and after a burn provide the safest conditions for burning. Gusty or variable winds are indicators of unstable atmospheric conditions. Immediate changes in wind direction can cause instant fire control and smoke management problems.
Probable wind directions for any particular burn should be obtained just prior to burn time and from your best weather forecast source. Placement of firebreaks and other fire containment measures and smoke management are largely dependent on wind direction.
Calm or low wind speed (less than 3 km/h, or 2 mph) days are not necessarily good burning days. Fire spread will be slow; the fire will take longer to complete and result in higher containment and labor costs; the fire will create its own wind and may change its own direction; and heat will dissipate more slowly, sometimes resulting in damage to non-target plant species.
Amounts of rain (or rain itself) are difficult to predict. Knowledge of the precipitation date and amount prior to a burn will be helpful in predicting fire behavior and intensity and will help you decide what control measures are necessary. Expect more smoke from moist than from dry fuels.
Grasslands have been burned successfully just 9 hr after 1.2 cm (0.5 in) of rain. Cool burns are achievable when 1.2 cm or more o rain has fallen 24 to 36 hr prior h the burn. Hotter fires usually require 5 or more dry days prior burning, but the drying time is dependent on solar radiation, air temperature, and wind speed. Average rainfall is highest in June as a result, vegetative growth is greatest in June and early July. Consequently, burning conditions during June and early July are regulated by precipitation events more than in other months.
Although we did not record sunshine duration or solar radiation during prescribed burns, we did notice some obvious differences in flammability of grassland fuels on sunny, partly sunny, and 100% overcast days. Fires spread faster and could be set sooner after rain on days with full or partial sunshine than on heavily overcast days.
Mobley et al (1977) reported that wide differences existed between air and fuel temperatures when fuels were exposed to sunshine and that moisture moved readily from the warm fuel to air, even though the relative humidity was high.
Atmospheric stability is the resistance of the atmosphere to vertical motion. A prescribed fire generates vertical motion by heating the air, but the strength of convective activity over a fire is affected by the stability of the air mass.
Strong convective activity will increase the drafts into the fire and can result in erratic fire behavior.
When the atmosphere is stable, a small decrease in temperature occurs with an increase in altitude. Under stable conditions, inversions can develop in which temperature actually increases with height.
Stable air tends to restrict convection-column development and produces more uniform burning conditions. However, combustion products are held in the lower layers of the atmosphere, especially under temperature inversions, and visibility may be reduced because of smoke accumulation. Temperature inversions can also be a problem at night.
When the atmosphere is unstable, there is a large decrease in temperature with height. Once air starts to rise, it will continue to rise, and strong convective activity may develop over the fire. Strong indrafts will help confine a fire to its prescribed area.
In extreme cases, the effect of air mass instability on fire behavior results in erratic spread rates and spotting. The burn no longer meets the prescription and might have to be extinguished.
Forecasts of low-level stability, inversion layers, or unstable conditions can be obtained from fire-weather forecasters. Local indicators at the fire site should also be observed. Indicators of stability are steady winds, clouds in layers, and poor visibility due to haze and smoke hanging near the ground. Unstable conditions are indicated by dust devils, gusty winds, good visibility, and clouds with vertical growth.
Three sources of weather information are available. Use at least one of these before starting prescription fires and during burning. The sources are (1) National Weather Service (NOAA), (2) Fire Damage Rating System (not available in all states), and (3) local observations.
Field observations of weather should be made at or near the prescribed burn area before and during burning. Such observations serve as a check on the weather forecast and keep the burning crew up-to-date on any changes or effects of local influences.
Compact belt weather kits containing a psychrometer and windspeed measuring instrument are available. With this kit, and by observing cloud conditions and other weather indicators, a competent observer can obtain a fairly complete picture of current weather.
Successful grassland burning and smoke management is based largely on adequate weather knowledge. Before a fire is set, the weather forecast should be known for at least the next 24 hr and when possible for the next 48 hr. A weather forecast for the next 4 to 5 days might be necessary on a large fire with high risk or potentially bad smoke management problems.
The National Weather Service (NOAA) is usually the best source of local weather forecasts and information, particularly for forecasts of several days in advance. Most states have at least one toll-free telephone number available to cooperators or agencies. Ask for a spot weather forecast. Permanently staffed airport terminals are another good source of daily NOAA forecasts. Some National Weather Service offices will also furnish daily fire danger forecasts.
Secondary sources of weather forecasts and outlooks are the meteorologists at local television or radio stations, who should be able to provide reliable 48-hr advance forecasts. Many local radio stations or weather radios provide an early morning daily agricultural forecast from 0600-0900 hr that gives relative humidity, wind, temperature, etc.
Current weather information may be checked via two-way radio communication with an automatic or instant indoor-outdoor weather station at a local headquarters, or with readings from instruments from a belt weather kit.
Although the reasons for conducting a prescribed burn can include pest control, removal of excessive undergrowth, wildlife habitat improvement, removal of invasive plants, etc., the most ideal weather condition for each controlled burn will be different. Figure 6.7 (Bighorn National Forest) and Figure 6.8 (Shoshone National Forest) identify general weather conditions (as well as other fire indices) that if exceeded, increase the risk of wild fires that cannot be effectively managed.
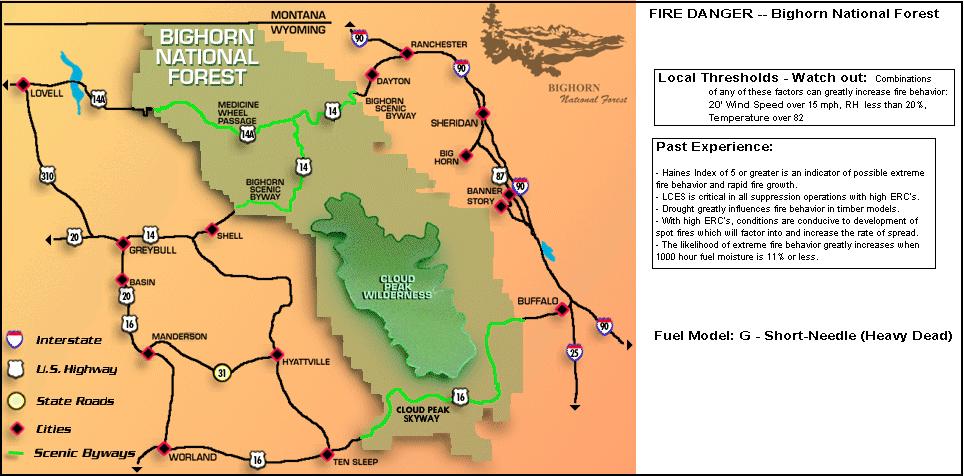
Figure 6.7. Bighorn National Forest fire danger criteria
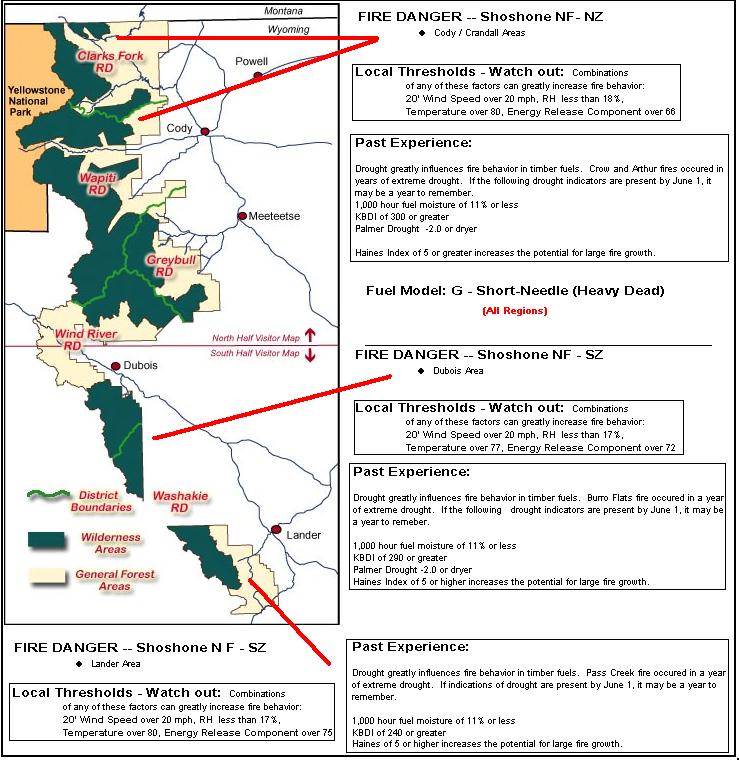
Figure 6.8. Shoshone National Forest fire danger criteria
53. USGS Survey Water-Supply Paper 2375
53-1. http://waterplan.state.wy.us/basins/7basins.html
53a. http://www.earthinstitute.columbia.edu/flash/drought_hi_res.html
54. Affiliation: Big Sky Institute, Montana State University, Bozeman, Montana and former Research Assistant, Department of Botany, University of Wyoming.
55. Gray, S.T., C.L. Fastie, S.T. Jackson, and J.L. Betancourt. 2004. Tree-ring based reconstructions of precipitation in the Bighorn Basin, Wyoming since 1260 A.D. Journal of Climate (in press).
56. Gray, S.T., J.L. Betancourt, C.L. Fastie, and S.T. Jackson. 2003. Patterns and sources of multidecadal oscillations in drought-sensitive tree-ring records from the central and southern Rocky Mountains. Geophysical Research Letters, 10:1029/2002GL01654.
57. Official Wyoming Drought Website: http://www.wrds.uwyo.edu/sco/drought/drought.html
58. http://www.cpc.ncep.noaa.gov/products/analysis_monitoring/regional_monitoring/palmer.gif
59. http://www.wrcc.dri.edu/spi/spi.html
59a. http://www.orbit.nesdis.noaa.gov/smcd/emb/vci/index.html
60. http://www.wrds.uwyo.edu/wrds/nrcs/swsimap/swsimap.html
61. http://rams.atmos.colostate.edu/gkss.html
61a. http://www.nap.edu/books/0309090539/html/
62. http://www.nawcinc.com/wmfaq.html
62a. http://www.npwrc.usgs.gov/resource/tools/burning/burning.htm
Higgins, Kenneth F., Arnold D. Kruse and James L. Piehl. 1989. Prescribed burning guidelines in the Northern Great Plains. U.S. Fish and Wildlife Service, Cooperative Extension Service, South Dakota State University, U.S. Department of Agriculture EC 760. Jamestown, ND: Northern Prairie Wildlife Research Center Home Page.
| ← Previous Chapter | | Table of Contents | | Next Chapter → |
State Climate Office | Water Resources Data System
Last Modified: Fri, 17 Oct 2008