Water Resources Data System & State Climate Office
Water Resources Data System & State Climate Office
Water Resources Data System & State Climate Office


Wyoming Climate Atlas
 Severe Weather
Wyoming's life and property losses due to severe weather are among the lowest in the country. This is due in part to the state's very low population density and its geographical location. Clashes between contrasting air masses that produce severe weather are minimized in part because of the Rocky Mountains' ability to separate and block prevailing air flows from the Gulf of Mexico, north central North America, and the Pacific Ocean. As a result, Wyoming has had the fewest one billion dollar weather disasters in the US during the past two decades.63 However, severe weather's impact on transportation, agriculture, ranching, tourism, and industry is still a force to be reckoned with.
Severe weather threatens surface transportation and impacts roadway safety (increased crash risk), mobility (increasing travel time delay, reducing traffic volumes and speeds, increasing speed variance), and productivity (disrupting access to road networks, and increasing road operating and maintenance costs). By understanding the climate of severe weather, transportation managers can incorporate three types of road weather management strategies: advisory, control, and treatment.64
While drought (see chapter 6), another form of severe weather, has the greatest negative impact to the agriculture and ranching communities, knowing approximate timing, frequency, and intensity of all weather threats such as high winds, snow, rain, ice, flooding, tornadoes, and hail, can help to improve crop yield and protect livestock.
Severe weather increases the likelihood of losses to life, property, and crops. Climate data relating to this phenomena are of special interest to the scientific community, natural hazard interests, and weather-sensitive industries. Scientists involved in studies to detect changing climate need quality data on extreme weather events. The weather insurance industry is deeply concerned about climate change since the weather extremes of the 1990s caused $78 billion in losses and killed 4,000 in the US.
The number of stations providing quality thunderstorm data in Wyoming from the period 1901-1995, are shown in Table 7.A.
Table 7.A. Wyoming metadata for thunderstorm observations
|
Stations |
Period of Record | Cooperative Station Name |
|
13 |
<10 Years |
Not Listed |
|
8 |
10-30 Years |
Border 1963-87 |
|
3 |
>30 Years |
Dull Center 1965-93 Ft Laramie 1949-78 Rock Springs 1949-80 |
|
4 |
1st Order Stations |
Casper 1940-95 |
An observation that records a thunderstorm is based on whether thunder is heard. While lightning can be seen over 100 miles away, especially at night, thunder is generally heard less than 10 miles from the observer. Thus, although a thunderstorm is recorded, it does not indicate whether any rain, hail, strong winds, or lightning is affecting the immediate area.
Based on the statistics from 1901-1995, Wyoming's thunderstorm activity is characterized as follows:
July has the most thunderstorms except for the extreme SW corner of the state which receives more activity in August. Annual average precipitation from thunderstorms ranges from 3.6 inches in the extreme northwest to 7.2 inches in the extreme southeast corner of the state. The frequency of thunderstorms ranges from about 30 days on its western border to about 50 days in the extreme northeast and southeast corners of the state. These values are 75% higher in the western regions and 55% percent higher over the eastern plains during wet summers, and from 45% lower in the western half of the state to about 63% lower over the southeast corner of the state during drought years (Figure 7.1 and Figure 7.2). Table 7.B. shows the long term average monthly days that thunder has been recorded at Wyoming's First Order weather stations.
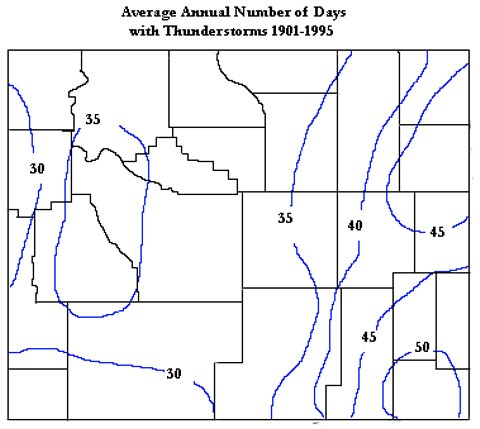
Figure 7.1. Annual average thunderstorm days for Wyoming (1901-1995)
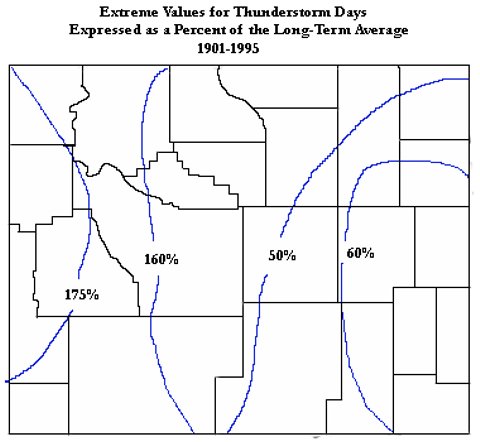
Figure 7.2. Range of expected number of annual thunderstorms expressed as a percent of the long term average
Table 7.B. Monthly thunderstorm days for select Wyoming stations (period of record in years)
|
Station |
POR |
JAN |
FEB |
MAR |
APR |
MAY |
JUN |
JUL |
AUG |
SEP |
OCT |
NOV |
DEC |
|
Casper |
56 |
0 |
0 |
0.3 |
1.5 |
6.4 |
8.5 |
9.4 |
7.0 |
3.1 |
0.5 |
0.1 |
0 |
|
Cheyenne |
95 |
0 |
0 |
0.2 |
2.1 |
7.6 |
11.2 |
13.4 |
11.4 |
4.7 |
0.9 |
0.0 |
0 |
|
Lander |
95 |
0 |
0 |
0.2 |
1.0 |
3.7 |
6.2 |
7.8 |
6.5 |
2.4 |
0.4 |
0.0 |
0 |
|
Sheridan |
89 |
0 |
0 |
0.0 |
0.9 |
4.7 |
9.1 |
9.7 |
6.7 |
2.5 |
0.4 |
0.0 |
0 |
Wind gusts in thunderstorms are frequently over 49 mph. These potentially damaging winds have been recorded 679 times across Wyoming since the 1950s although many counties started record keeping only more recently. A breakdown by county is shown in Figure 7.3.

Figure 7.3. Wyoming thunderstorm gust events by county through 2003
Converse county reports about one thunderstorm gust event every five years while Campbell and Fremont counties report 1.7 events annually. Another type of gust event responsible for tremendous damages besides the non-tornadic thunderstorm wind is the dry microburst. Evaporating rains cool small areas beneath developing clouds and the resulting denser air surges downward at hurricane velocities (>74 mph). Between 1996 and 2001, more than $510K worth of property loss has resulted from just three of 16 recorded events. Microbursts are particularly hazardous to aircraft on takeoff and landing by robbing them of lift. Doppler radar has helped warn air traffic controllers of these short-lived and less than 2.5 miles-wide phenomena on numerous occasions nationwide, saving untolled lives.
Perhaps the one weather element that should be feared the most is lightning. It cannot be predicted where and when it will strike.
Statistics in the US reveal that 1 in 345,000 lightning flashes results in a death and 1 in 114,000 results in an injury. Wyoming ranks 36th in number of lightning fatalities, 33rd in injuries, and 40th in property damage from 1959-1994. In Wyoming, hikers above the timberline should plan to be off exposed mountain tops and ridges by 2PM during the summer months. Rapid thunderstorm development can place even the most experienced climbers in jeopardy without warning. From 1994-2003, there has been six people killed, 33 injured, $692K property damage, and $9K crop damage in Wyoming.
Lightning strikes are routinely monitored nationwide by Global Atmospherics, Inc.(now Vaisala Inc.) with accuracies to within a 0.625 mile (1 kilometer) resolution. For the period of 1998-2000, the Wyoming annual lightning strike frequency is depicted in Figure 7.4. Clearly the eastern plains have more than three times the cloud to ground lightning strikes as does the western half of the state. Platte, Weston, Crook, and parts of Campbell, Niobrara, and Laramie Counties are the most active in the state. These values probably vary by 50% in a year depending on whether there is a drought or enhanced monsoonal flow. However, the locations of maximum and minimum strikes do not change much from year to year. In 1998 the state's precipitation average was well above normal, in 1999 near normal, and in 2000 was below normal.
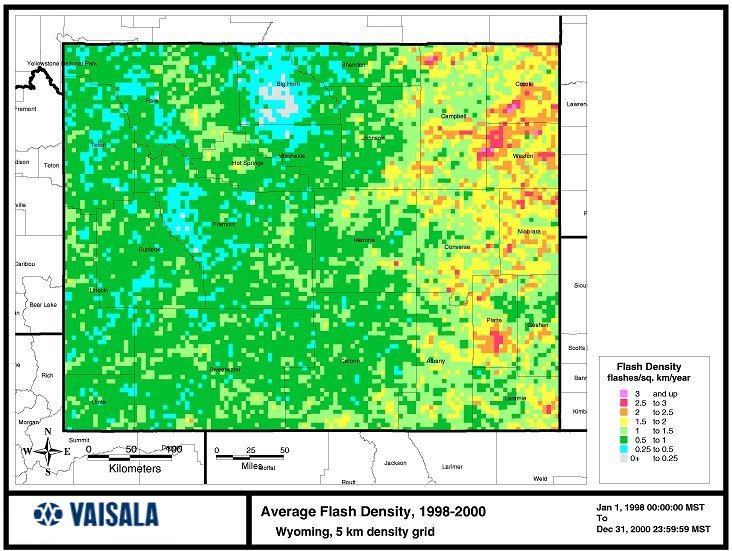
Figure 7.4. Average annual lightning flash density for 1998-2000 over Wyoming. Each pixel represents 5 km2.(Data courtesy of Global Atmospherics, Inc., now Vaisala Inc.).
Figure 7.5 depicts lightning climatology products based upon data collected from the Automated Lightning Detection System (ALDS) operated by the Bureau of Land Management from April 1985 through November 1997. These data provide a location and time of occurrence for cloud-to-ground lightning strikes.67, 68
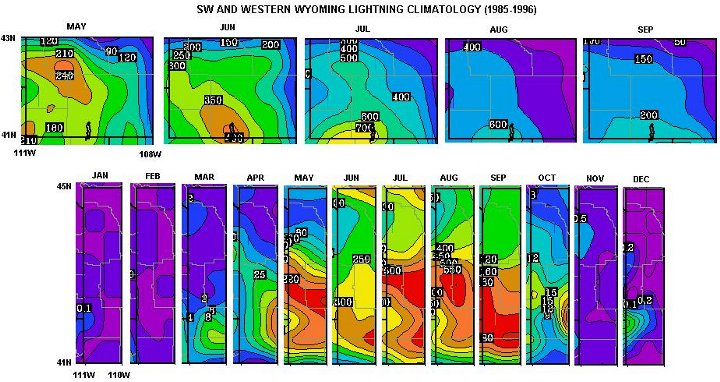
Figure 7.5. Southwest and Western Wyoming Lightning Climatology (1985-96) (note the monthly scaling differs)
The top sequence in Figure 7.5 shows southwest Wyoming average monthly cloud-to-ground lightning strikes during the fire season (May-Sep) for a 12-year period. Peak activity (>700 strikes/month) occurs in July over southeast Uinta and southwest Sweetwater counties and is followed by August and June. The bottom sequence shows extreme western Wyoming for each month of the year. Note that the northwest mountains experience less than one-tenth the number of strikes as compared to areas in the south during summer. In Figure 7.6, the peak of the July lightning activity is shown for the entire state of Wyoming. Grid resolution for these strips is at 0.5 degree. These depictions are equivalent to 1/92nd the resolution of the 1998-2000 lightning frequency map in Figure 7.4.
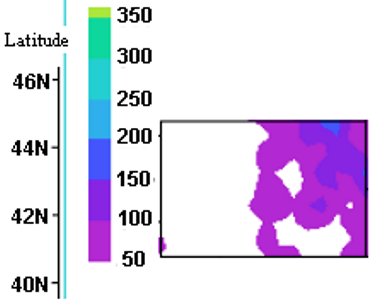
Figure 7.6. Wyoming lightning strike frequency for July (1990-2000) at 00UT (6PM MDT)
Whether in a drought or wet period, Wyoming's hot and windy summers can cause rapid changes to the fire risk over grasslands or forests. In Figure 7.7 and Figure 7.8, a 31-year record of lightning-caused wildfires as well as the percent of lightning-induced wildfires is shown.
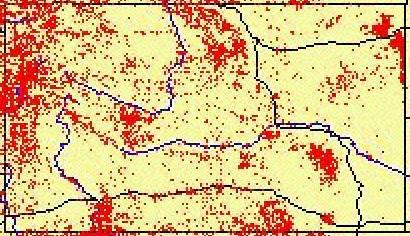
Figure 7.7. Lightning-caused wildfires (source points) in Wyoming (1970-2000)
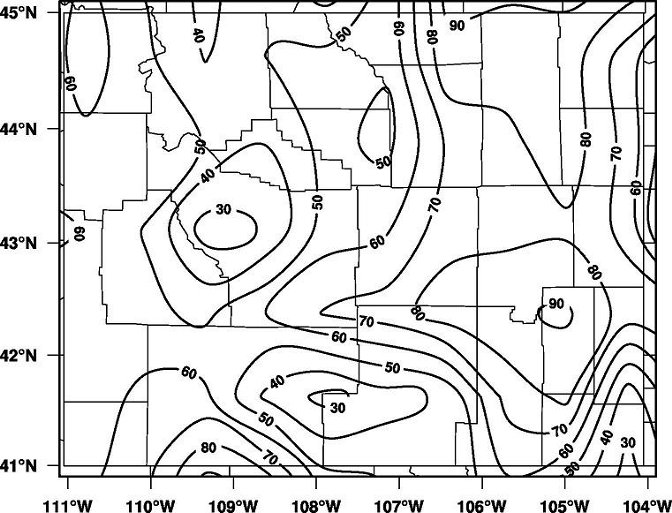
Figure 7.8. Percent of lightning-induced wildfires in Wyoming (1970-2000).
The top five Wyoming hailstorms are shown in Table 7.C. The hail loss-cost (Figure 7.9) contains annual loss-cost values for Wyoming for 1948-1995. Loss-cost is an annual value used by the insurance industry to normalize the yearly values and allows for temporal comparisons of annual losses. It is defined as the annual losses ($) divided by the annual liability ($) multiplied by 100. As noted, there is a lot of inter-annual variation with an overall negligible trend.
Table 7.C. Top Five Wyoming Hailstorms
|
ranking |
location |
year |
losses |
|
1 |
Cheyenne |
1985 |
$43.6 million |
|
2 |
Cheyenne |
1987 |
$36.0 million |
|
3 |
Casper |
1986 |
$29.0 million |
|
4 |
Gillette |
1993 |
$17.0 million |
|
5 |
Cheyenne |
1979 |
$16.5 million |
Severe hail (size 0.75 inch or larger) events occur about 29 times a year across the state with by far the greatest frequency occurring over the extreme southeast part of the state (Laramie County). Between 1950 and 2001 more than $13.9M in property and $1.26M in crop damage was reported, while nine people were injured. Smaller, less damaging hail occurs two to four times as frequently, and usually happens for a few minutes at the start of intense thunderstorms. In Figure 7.10 the number of severe hail events by county for various time scales is shown.
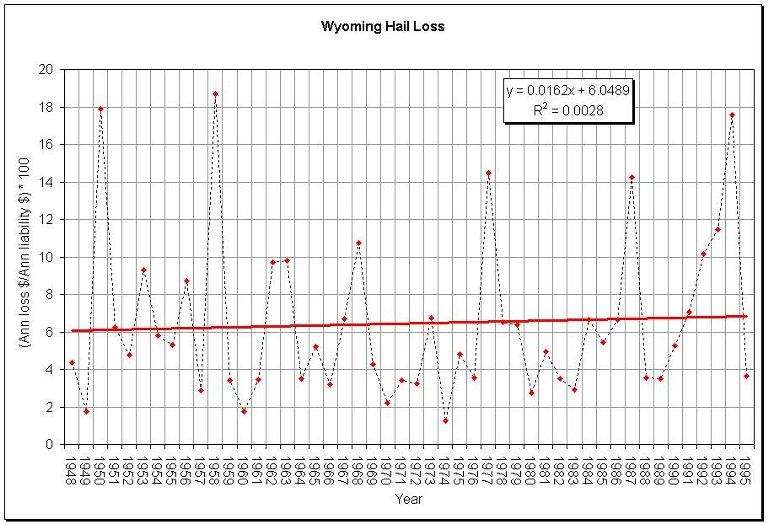
Figure 7.9. Normalized hail loss-cost for Wyoming (1948-95)69
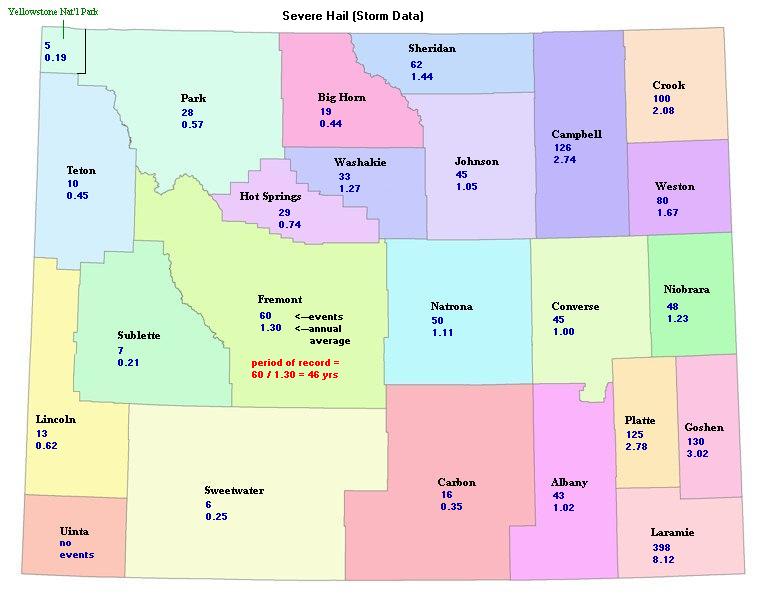
Figure 7.10. Wyoming severe hail events by county for period of record through 2003
Tornadoes, the most intense wind events on earth, have been recorded with winds in excess of 315 mph. Fortunately, Wyoming lies west of "tornado alley" and the frequency and intensity of tornadoes are greatly diminished in comparison. Wyoming ranks 25th in the number of annual tornadoes (10), 33rd in fatalities (six deaths per million people), 37th in injuries, and 36th in property damage ($34.13M) in the US from 1950-1994. Tornado statistics, especially prior to the 1970s, must be viewed as incomplete since many twisters must have occurred without being witnessed. Wyoming's open rangelands experience little if any damage from these storms so many go unreported. In the 1990s, the internet and Doppler radar increased the public's awareness of tornadoes with the potential of more being observed and reported. However, the trend in annual tornadoes has decreased by one third since 1976 and appears to have coincided with a major hemispheric weather pattern shift, despite the increased reporting based on Doppler radar vortex (circulation) signatures.
Annual tornado statistics show a wide degree of variation across the state. For example, 42 tornadoes were counted in 1979 while no tornadoes were reported in 1951 and 1970 (Figure 7.11). With respect to counties, of the 545 confirmed tornadoes recorded (1950-2003), Laramie County had the most with 90 while Teton County recorded only one. Although Laramie County has the largest population and, thus, the opportunity to see more tornadoes, the fact that extreme SE Wyoming is closest to "tornado alley" explains these higher numbers. The average length of a tornado in Wyoming is 3.05 miles with an average width of 79 yards. On average there are six tornado days per year. Based on Wyoming's size, one tornado on average would be expected to have a recurrence interval of 79,300 years at any given point within the state. However, many tornadoes have no recorded path length or width, are not evenly distributed across the state, and go unreported. Based on maximum wind speed probability the eastern third of the state can expect a tornado between 10,000 and 100,000 years, the middle third between 100,000 and 1,000,000 years, and the western third between 1,000,000 to longer than 10,000,000(or ten million) years.71
Figure 7.11. Annual Wyoming tornado count with longer term trend line (dashed) and shorter term trend line (solid) (1950-2004)
June has nearly twice the quantity of tornadoes as May and July while November through March has no reported tornadoes (Figure 7.12)
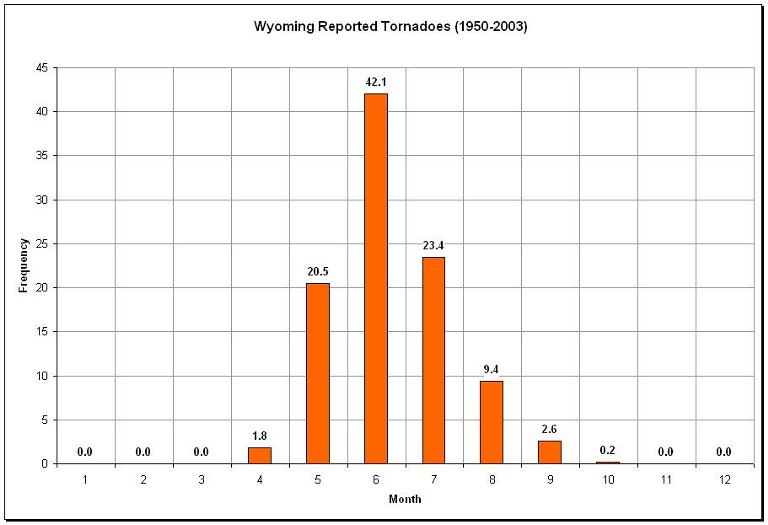
Figure 7.12. Wyoming monthly tornado statistics (1950-2003)
With the heating of the day, tornadoes peak in occurrence between 3PM and 4PM. Tornadoes occurring at night are rare, although more probably occur but go unseen (Figure 7.13).
Figure 7.13. Wyoming tornado frequency by hour (1950-2004)
Tornado intensity is measured by the Fujita (F-Scale). The weakest intensity (F0) winds (40-72 mph) occur more than half the time producing minimal damage. Significant tornadoes are considered to be F2 intensity winds, between 113 and 157 mph or stronger, or if a weaker tornado kills a person. Significant tornadoes occur in about four out of 100 tornadoes in Wyoming (Figure 7.14). The strongest tornado in Wyoming was an F4 with winds between 207-260 mph which occurred on 21 July 1987 in Teton County resulting in $2.5 million in damages:
"21 July 1987: Cut across the Teton Wilderness, 45 miles northeast of Jackson. About 15,000 acres of trees were downed. This was the highest (elevation) F4 tornado ever documented. The downed trees were mostly mature lodgepole pines, from 80 to 100 feet tall. The massive blowdown stretched over 24 miles, from Box Creek Trailhead, 10 miles east-northeast of Moran Junction and was about one to two miles wide. The F4 rating was applied after inspection by Dr. Fujita. F4 winds may be needed to do F3 damage in air at this altitude (up to 10,000 feet). Not all experts agree that this entire event should be called a tornado."70
The only recent killer tornadoes occurred on 12 August 2005 when an F2 tornado hit the small community of Wright resulting in 2 fatalities, 13 injuries, 40-50 mobile homes destroyed with a damage path up to 0.25 mile wide and in Cheyenne on 16 July 1979 (killed one person). The Cheyenne event also resulted in 40 injuries and caused $25 million in damage and is considered the state's worst:
"16 July 1979: Moving north in the northern part of Cheyenne housing and airport areas. Four C-130 aircraft and National Guard ground equipment sustained $12M damage. Municipal hangers and buildings suffered another $10M damage. Seventeen trailers and 140 houses were destroyed, and 325 homes were damaged. A baby was killed in a trailer."
Table 7.D. Killer and Significant F2 or greater tornadoes in Wyoming
|
Date |
Time |
Dead |
Injured |
Yards |
Miles |
F |
County |
|
May 18, 1907 |
1345 |
0 |
6 |
--- |
15 |
F2 |
CONVERSE, 25mi E of Douglas |
|
Jun 24, 1920 |
1600 |
0 |
0 |
100 |
2 |
F2 |
LARAMIE, 3mi S of Hillsdale |
|
May 31, 1923 |
|
0 |
2 |
150 |
--- |
F2 |
CONVERSE, 5mi W of Parkerton |
|
May 31, 1923 |
1545 |
1 |
2 |
300 |
2 |
F2 |
SHERIDAN, 5mi NE Lariat |
|
Jun 12, 1923 |
|
0 |
3 |
400 |
--- |
F2 |
PARK, Southfork near Cody |
|
Jun 15, 1926 |
1530 |
0 |
26 |
70 |
1 |
F3 |
GOSHEN, 2mi SW of Torrington |
|
Jun 27, 1927 |
1745 |
0 |
4 |
--- |
--- |
F2 |
CAMPBELL, 20mi NE of Gillette |
|
Jun 29, 1928 |
1345 |
0 |
0 |
70 |
--- |
F2 |
CAMPBELL Gillette |
|
Jun 8, 1930 |
1630 |
0 |
1 |
100 |
20 |
F3 |
NIOBRARA, Hat Creek to SE of Lusk |
|
Jun 25, 1942 |
1900 |
2 |
4 |
6 |
-- |
F2 |
PLATTE, 4mi W of Wheatland |
|
Jun 12, 1944 |
1500 |
0 |
2 |
100 |
-- |
F2 |
CAMPBELL |
|
May 28, 1953 |
1900 |
0 |
0 |
400 |
14 |
F2 |
WESTON NW Newcastle to N of Upton |
|
Jun 26, 1955 |
2000 |
0 |
0 |
30 |
2 |
F3 |
GOSHEN, 7mi SW of Torrington |
|
Jun 27, 1955 |
1210 |
0 |
3 |
70 |
2 |
F3 |
PLATTE, 14mi NW of Chugwater |
|
Jun 26, 1959 |
1500 |
1 |
0 |
100 |
10 |
F1 |
BIG HORN, 30mi E of Greybull |
|
Apr 23, 1960 |
1930 |
0 |
1 |
200 |
s23 |
F2 |
LARAMIE, 19mi W of Cheyenne |
|
May 18, 1961 |
1930 |
0 |
0 |
--- |
5 |
F2 |
CROOK |
|
Apr 12, 1967 |
1700 |
0 |
0 |
50 |
15 |
F2 |
GOSHEN, 4mi W of Torrington |
|
Jun 25, 1975 |
1715 |
0 |
0 |
400 |
9 |
F2 |
CROOK, 7mi ESE of Sundance |
|
Jul 2, 1976 |
1400 |
0 |
0 |
400 |
2.5 |
FT |
CARBON, 22mi E of Saratoga |
|
Jul 28, 1978 |
1830 |
0 |
0 |
200 |
1 |
*F2 |
GOSHEN, 20mi NNE of Torrington |
|
Jul 16, 1979 |
1525 |
1 |
40 |
80 |
8 |
*F4 |
LARAMIE Northern Cheyenne |
|
Jun 5, 1982 |
1825 |
0 |
1 |
35 |
7 |
F2 |
CONVERSE, 15mi SW of Douglas |
|
Jun 5, 1982 |
1920 |
0 |
3 |
15 |
1 |
F2 |
NIOBRARA, 2mi W of Hwys 85 and 270 |
|
Jun 13, 1984 |
1813 |
0 |
1 |
30 |
4 |
F2 |
NIOBRARA At Lance Creek |
|
Jun 18, 1987 |
1420 |
0 |
0 |
50 |
7 |
F2 |
NATRONA, 10mi N of Casper |
|
Jul 21, 1987 |
1350 |
0 |
0 |
2550 |
24 |
F4 |
TETON, 45mi NE of Jackson |
|
May 6, 1988 |
1336 |
0 |
2 |
50 |
1.5 |
F2 |
CAMPBELL, 8mi SE of Gillette |
|
May 24, 1990 |
1555 |
0 |
0 |
250 |
8 |
F2 |
LARAMIE Meriden |
|
Jul 10, 2001 |
1530 |
0 |
0 |
0.3 |
--- |
F2 |
HOT SPRINGS, 2.5mi NW of Kirby |
|
Aug 12, 2005 |
1651 |
2 |
13 |
0.25 |
--- |
F2 |
CAMPBELL, Wright |
* marginal F, s23=skipped for 23 miles, FT=tree damage, F1 included because of associated death
From 1950-2005, 97 people have been injured in tornadoes in Wyoming. The following is a list of Wyoming tornadoes causing a death or six injuries before 1953, and three or more injuries after 1952:
MAY 18, 1907 1:45 pm 0 dead 6 injured
Six men were injured as a small house was destroyed on a sheep ranch in Converse County.
MAY 31, 1923 3:45 pm 1 dead 2 injured
A small homestead shack was destroyed near Lariat in the southeast corner of Sheridan County.
JUN 15, 1926 3:30 pm 0 dead 26 injured
The erratic looping path of this tornado hit one farmhouse twice, west of Torrington, Goshen County.
JUN 25, 1942 7:00 pm 2 dead 4 injured
Two field workers were killed in their home near Wheatland, Platte County.
JUN 27, 1955 12:10 pm 0 dead 3 injured
A tornado destroyed all buildings on a farm south of Wheatland, Platte County.
JUN 26, 1959 3:00 pm 1 dead 0 injured
A man was killed when a tornado uprooted a tree, which crushed his pickup truck in Bighorn County.
JUL 16, 1979 3:25 pm 1 dead 40 injured
A tornado hit 500 homes in an eight-mile-long path across the northern part of the Cheyenne.
JUN 5, 1982 7:35 pm 0 dead 3 injured
In Niobrara County, at Lance Creek, a barn and mobile home were destroyed.
AUG 12, 2005 4:22 pm 2 dead 13 injured
At about 4:22 PM,, an F2 tornado ripped apart the Cottonwood Mobile Home Park at Wright, Campbell County, Wyoming. Two people were killed and 13 were hospitalized as forty mobile homes were destroyed. A few frame homes were unroofed. This is only the second time in history that a Wyoming tornado caused as many as two fatalities. That previous tornado was on June 25th, 1942. This tornado event ends the longest period during the tornado season that no killer tornadoes occurred in the United States (April, May, June and July). The last killer US tornado occurred on 22 March 2005.
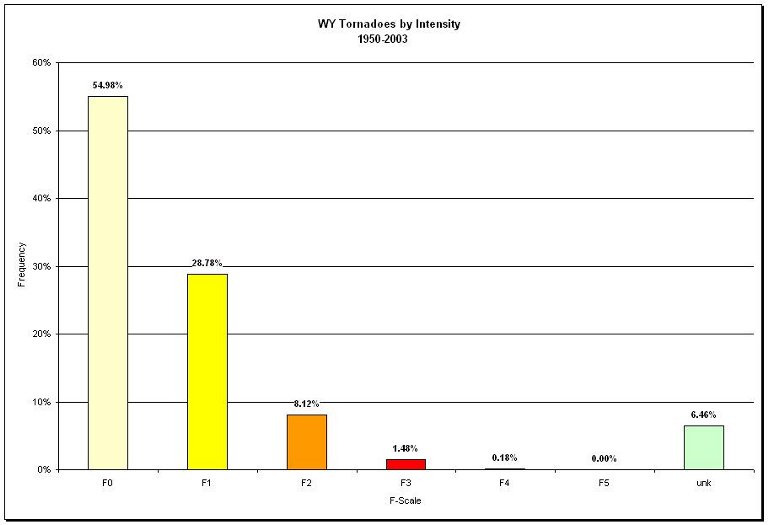
Figure 7.14. Frequency of tornadoes by intensity (1950-2003)

Figure 7.15. Wyoming tornadoes by county (1950-2003)
In Figure 7.15, tornado occurrence by county is shown from 1950-2003. The three highest counts occur in Laramie, Campbell, and Goshen counties.72 For average annual damage costs based on 1999 dollars from 1950-1999 see Figure 7.16.
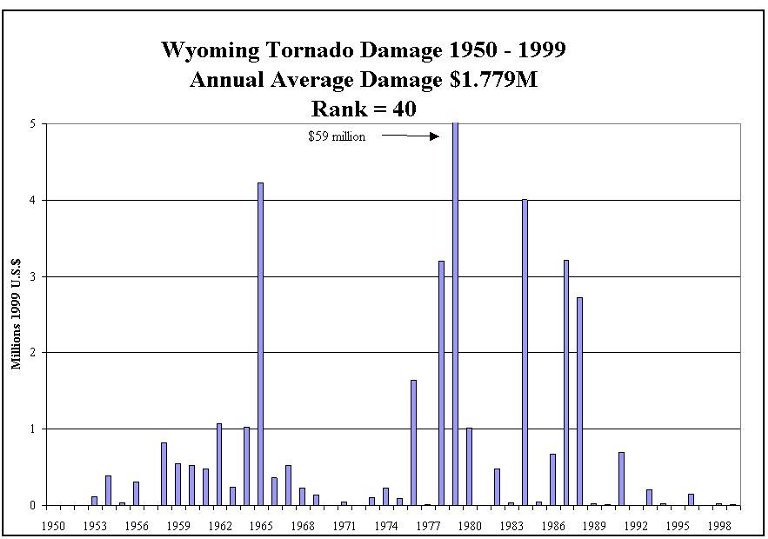
Figure 7.16. Wyoming tornado damage (1955-1999)
Most high wind events occur in the colder months and are caused by the tight pressure gradient between transiting low and high pressure systems. From 1993 through 2001, 268 events were recorded resulting in 1 death, 9 injuries, and $1.4M in property damage (26 events). These wind storms (> 50 mph) are quite common in Wyoming and often occur across several counties at the same time.
Heavy snow, blizzards, and avalanches constitute winter storms. From 1993 through 2001, 347 events were recorded resulting in 10 deaths, 119 injuries, and $8.5M in property damages (21 events). As with high wind events, winter storms often impact many counties across the state at the same time. Historic snow storms in Wyoming have been documented about 20 times between 1871-1999.73
The weather patterns that contribute to the greatest likelihood of a wintertime blizzards occur under two scenarios. As noted in Figure 7.16a, the January 2-3, 1949 blizzard (called by many as "The Storm of the Century") was caused by a low pressure center moving rapidly southeastward along the eastern slope of the Rockies followed by a major outbreak of Arctic air. The combined effects (one-two punch) also resulted in significant upsloping low level winds. The April 3-4, 1955 event (Figure 7.16a) resulted in nearly four feet of snowfall over Sheridan. This event was characterized by a slow moving deep low pressure center just east of Wyoming that adjective cold polar air from the north. The onset of many winter storms are not necessarily revealed on upper level weather charts as major troughing over or near Wyoming as is common over the eastern half of the US.
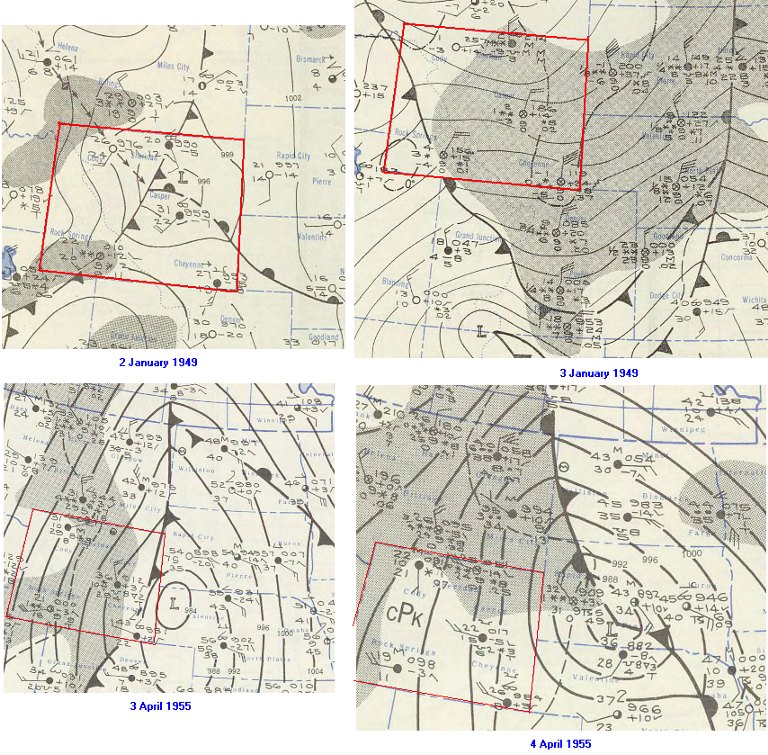
Figure 7.16a. Surface weather maps showing two major snowstorms that effected Wyoming
The conditions that produce ice storms are actually quite rare in Wyoming. Rain falling into pockets of below freezing surface air will create conditions that can rival the most severe blizzard. Transportation grinds to a halt, even four-wheel drive vehicles cannot achieve enough traction to go anywhere while the accumulating weight of ice on trees and powerlines will eventually cause them to come crashing to the ground. In Table 7.E., a summary of the number of hours by month of reported freezing rain is shown for cities with a long continuous period of observations.
Table 7.E. Hourly reports of freezing rain (period over 50 years)
|
Station |
Period |
Jan |
Feb |
Mar |
Apr |
May |
Oct |
Nov |
Dec |
|
CASPER |
1950 - 2001 |
1 |
3 |
0 |
2 |
2 |
1 |
5 |
0 |
|
CHEYENNE |
1948 - 2001 |
1 |
0 |
0 |
15 |
13 |
13 |
7 |
0 |
|
LANDER |
1947 - 2001 |
2 |
0 |
0 |
1 |
0 |
2 |
3 |
1 |
|
ROCK SPRINGS |
1948 - 2001 |
2 |
0 |
0 |
1 |
0 |
2 |
0 |
0 |
|
SHERIDAN |
1939 - 2001 |
2 |
3 |
9 |
5 |
0 |
3 |
5 |
12 |
The return periods for extreme icing due to freezing rain78a is contained in Figure 7.16b and Figure 7.16c. No more than 0.25 inch of ice accumulation is expected to occur over much of Wyoming within a 100 year period. Beyond 100-years, little in the way of increased icing thicknesses are modeled over Wyoming. However, localized excepts for damaging icing due to structure exposure is always possible.
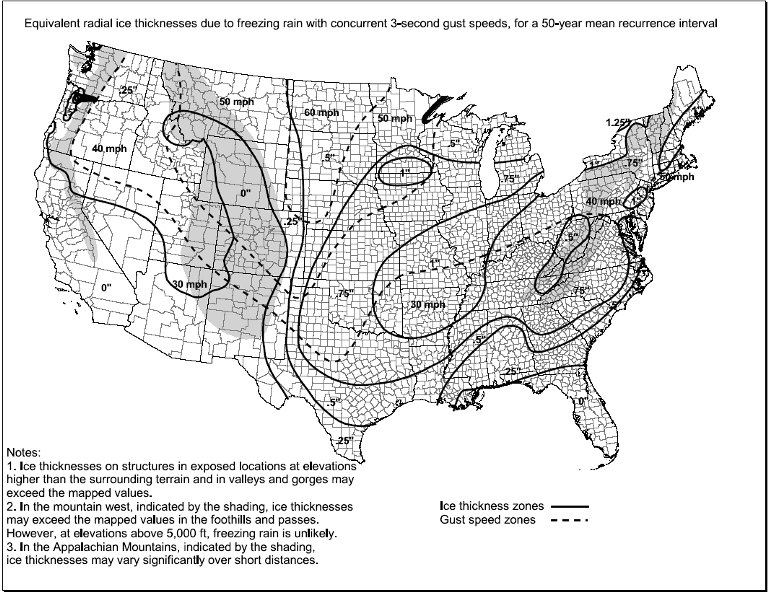
Figure 7.16b. Equivalent radial ice thickness (50-year mean recurrence interval)
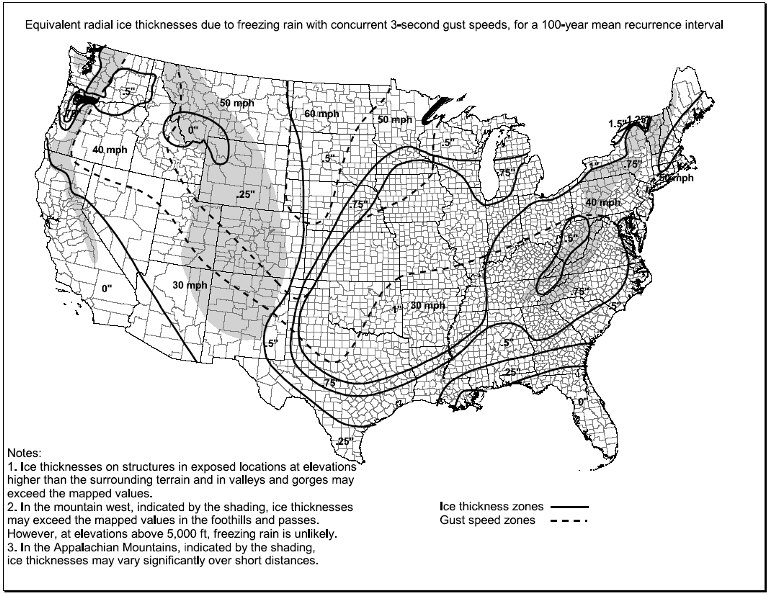
Figure 7.16c. Equivalent radial ice thickness (100-year mean recurrence interval)
Wyoming ranks 5th in the overall number of people killed (30) 74 in avalanches from 1985 to 2003 in the US. With the increasing popularity of winter recreation in the backcountry, a basic knowledge for determining the avalanche threat potential is essential. Simple snow stability tests75, as described by Bruce Tremper, are an excellent tutorial for the novice. Also, recognizing the pattern of wind-loaded76 snowdrifts that are staged for avalanche can be a vital tool for survival. One clue is to measure the shape of the newest snow deposition on a lee slope.
If the newest snow deposition has the asymmetric wedge-shape, with its maximum 0 to 65 feet down the lee slope, and gradually decreases to the average new snow depth at 200-330 feet down the lee slope, then avalanche potential due to wind-slab on lee slopes certainly may exist. A warning goes with the test: as you are measuring for the presence of the unstable wedge-shaped wind-slab, perform the measurement on a small, indicative test slope. Getting caught and killed in the avalanche whose possible existence you were trying to determine is not a successful test.
Flash floods and urban small stream floods are the most common types of floods. From 1993 through 2002, 97 events were recorded resulting in two deaths, no injuries, and $2.027M in property damages (24 events) (see Figure 7.17).
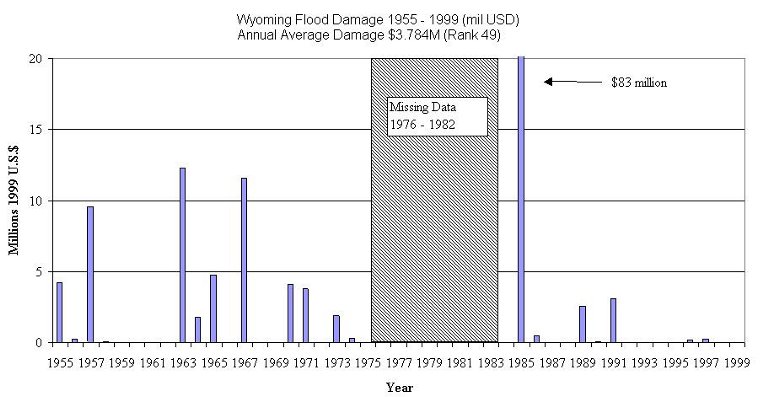
Figure 7.17. Wyoming flood damage (1955-1999)
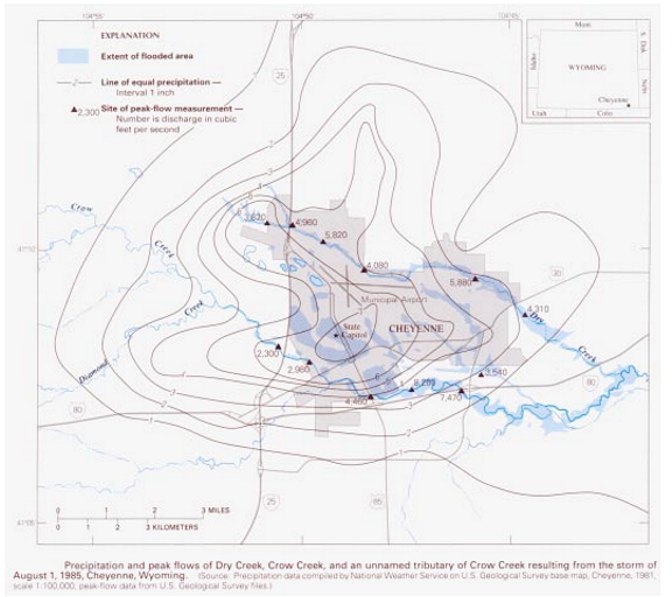
Figure 7.18. Perhaps the most famous Wyoming flood (1 August 1985, evening, 12 killed, 70 injured, $65 million in property damage)78
A nearly stationary severe thunderstorm (or storms) produced the most damaging flash flood on record for Cheyenne and the state of Wyoming. Twelve people lost their lives, 70 more were injured, and the damage to homes, cars, and businesses was estimated at $65M.
At the NWS Forecast Office near the airport, 6.06 inches of rain fell in just over 3 hours (half a year's worth) between 7PM and 10PM. Elsewhere in and around Cheyenne rainfall from the storm totaled between 2 to 6 inches (Figure 7.18).
Around 7PM cars and trucks were reported floating down Dry Creek in northwest Cheyenne. By 7:30PM, in addition to blinding rain, hail up to two inches in diameter and winds up to 70 mph were occurring in the Cheyenne area.
Flood waters in the city were at their apex from 7PM to 10PM, Dry Creek became a raging torrent throughout northern Cheyenne. 10 to 12 deaths occurred along Dry Creek when people were swept away in their cars as they tried to cross flooded streets.
A sheriff's deputy and the child he was trying to rescue from a stranded vehicle were swept away.
Many streets turned into two to four foot deep rivers with large amounts of hail floating on top. Basements of homes and businesses quickly filled up with water and hail as flood waters crashed through doors and windows. One man suffered a heart attack and died while bailing out water from his basement. An elderly woman who had taken shelter in her basement during earlier tornado warnings became trapped in her basement when the flood waters came crashing through basement windows. The woman drowned in her basement which filled to the ceiling.
Some basements equipped with drains were still filled with two to five feet of hail after the water drained away. In some low-lying areas of Cheyenne, the hail had been piled into four to eight foot drifts by flood waters .
64. http://www.itsdocs.fhwa.dot.gov//JPODOCS/REPTS_TE//13828.html
65. see CD: severe_weather, text, thunder, folders, Thunderstorm_Report (pdf)
66. http://www.nssl.noaa.gov/papers/techmemos/NWS-SR-193/techmemo-sr193-3.html
67. http://www.cefa.dri.edu/Cefa_Products/Lightning/alds_home.php
68. http://www.cefa.dri.edu/Publications/LightningReport.pdf
69. Changnon Climatologist, 801 Buckthorn, Mahomet, IL 61853 (NOAA Grant NA76GPO439)
70. http://www.spc.noaa.gov/archive/
71. Significant Tornadoes 1680-1991 by Thomas P. Gazulis, July, 1993 Environmental Films, St. Johnsbury, Vermont ISBN 1-879362-03-1
72. For a complete list of tornadoes by county from 1950-2003 see CD: severe_weather, misc, tornado folder
73. See CD: severe_weather, misc, folders for blizzards (pdf) (historial WY events from 1871)
74. http://www.avalanche.org/~moonstone/TAR/tar.htm
75. http://geosurvey.state.co.us/avalanche/Default.aspx?tabid=46
76. Bruce Tremper, The Avalanche Review, VOL. 13, NO. 2, DECEMBER 1994
77. Rand Decker, The Avalanche Review, Vol. 1, No. 3, December 1982
78. http://www4.ncdc.noaa.gov/cgi-win/wwcgi.dll?wwEvent~storms
78a. Kathleen Jones, "Extreme ice thickness from freezing rain (Report for Federal Emergency Management Agency and National Institute of Building Sciences", 28 May 2004.
79. http://www.nwd-mr.usace.army.mil/rcc/historic/precipmaps.html
State Climate Office | Water Resources Data System
Last Modified: Fri, 23 May 2025