 CloudsClouds
For most of the state, sunshine ranges from 60 percent of the possible amount during the winter to about 75 percent during the summer (ranks 9th in the US with an annual average of 64 percent). Mountain areas receive less and, in the wintertime, the estimated amount over the northwestern mountains is about 45 percent. In the summertime when sunshine is greatest - not only in time, but also intensity - it is characteristic for the mornings to be mostly clear. Cumulus clouds develop nearly every day and frequently blot out the sun for a portion of the afternoons. Because the altitude provides less atmosphere for the sun's rays to penetrate and because of the very small amount of fog, haze, and smoke, the intensity of sunshine is unusually high.
In Figure 8.1, Figure 8.2, Figure 8.3, and Figure 8.4, the mean hourly total sky cover by month for Casper, Cheyenne, Lander, and Sheridan from 1961-90 is shown and reveals a recurring theme. Minimum cloudiness usually occurs in late summer during early morning hours and maximum cloudiness occurs in mid-afternoon during late winter.
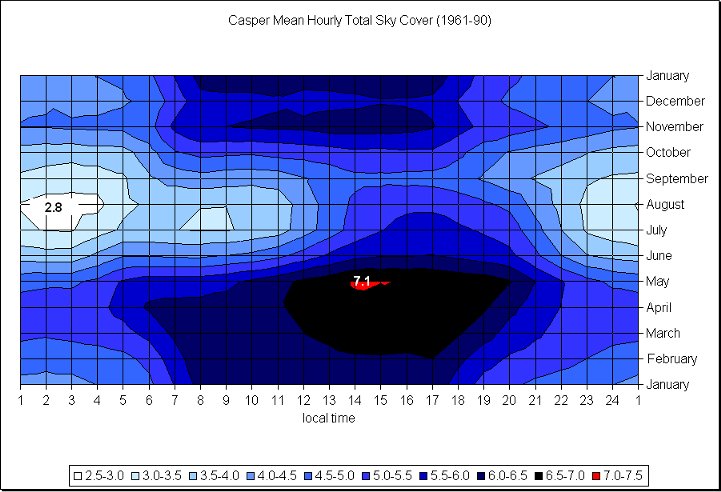
Figure 8.1. Casper mean hourly total sky cover (in tenths) based on observations from 1961-1990. Annual minimum and maximum values are depicted.
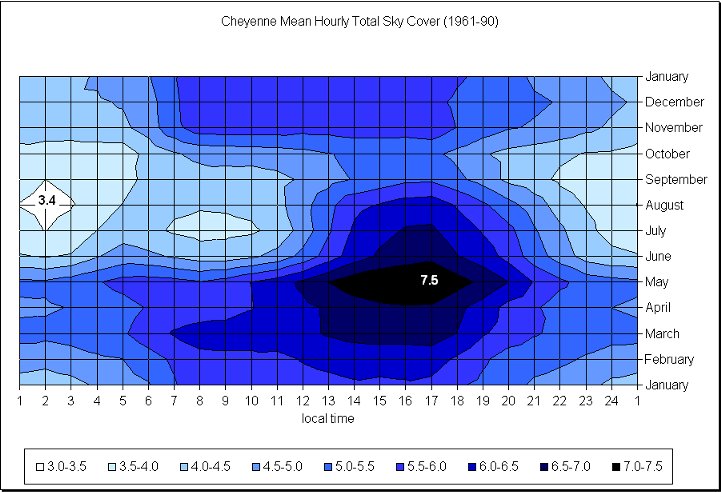
Figure 8.2. Same as Figure 8.1 except for Cheyenne
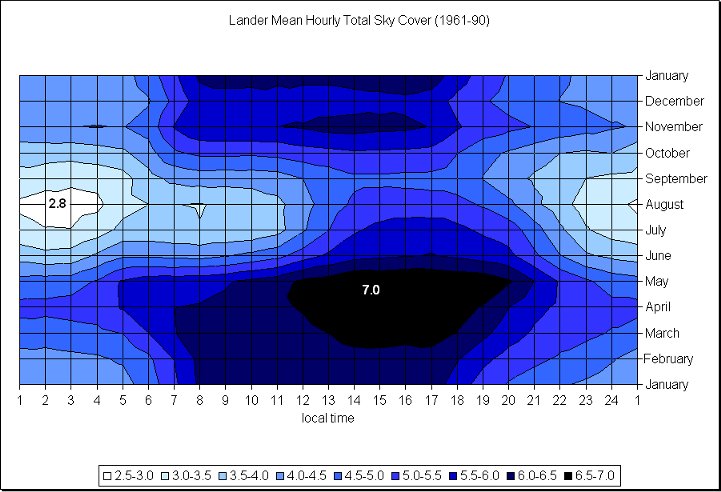
Figure 8.3. Same as Figure 8.1 except for Lander
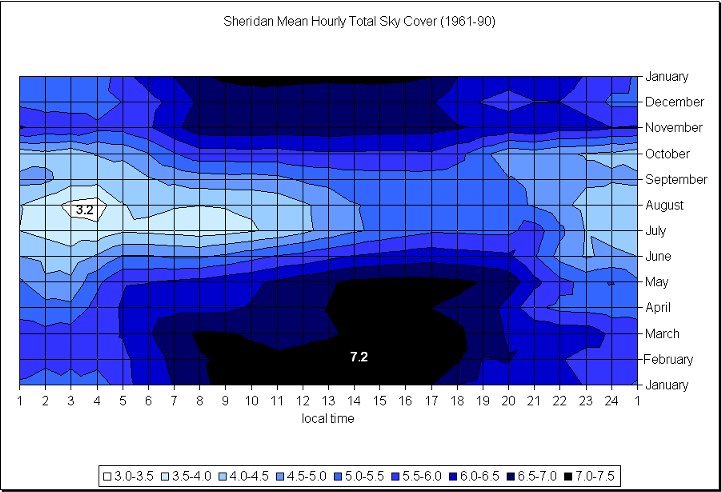
Figure 8.4. Same as Figure 8.1 except for Sheridan
In Figure 8.5, Figure 8.6, Figure 8.7, and Figure 8.8 total sky cover frequency by month for Casper, Cheyenne, Lander, and Sheridan from 1950-1996 also show striking similarities. Minimum cloudiness usually occurs in early fall and maximum cloudiness occurs in the middle of spring, generally about 20 percent of the time for each extreme.
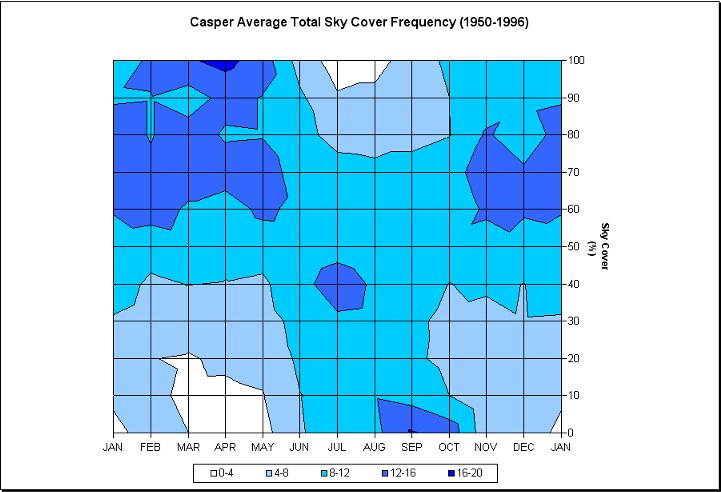
Figure 8.5. Casper total sky cover frequency (%) by month based on daily average observations taken from 1950 to 1996
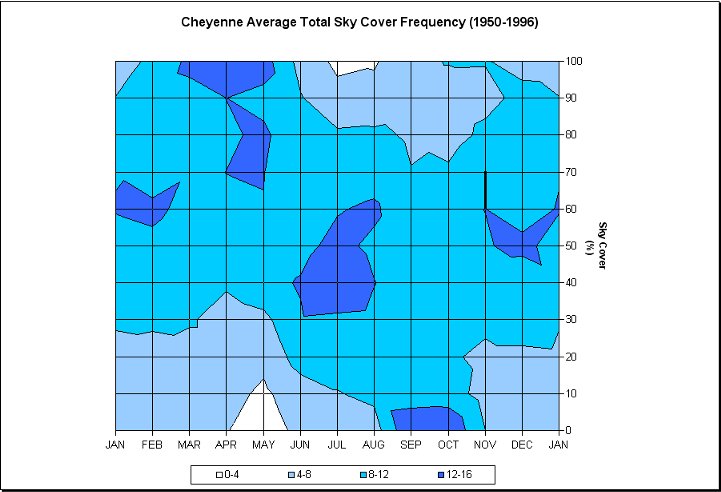
Figure 8.6. Same as Figure 8.5 except for Cheyenne
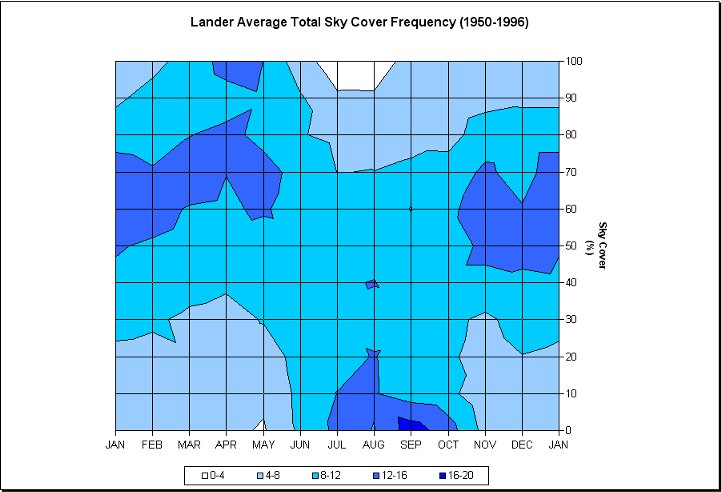
Figure 8.7. Same as Figure 8.5 except for Lander
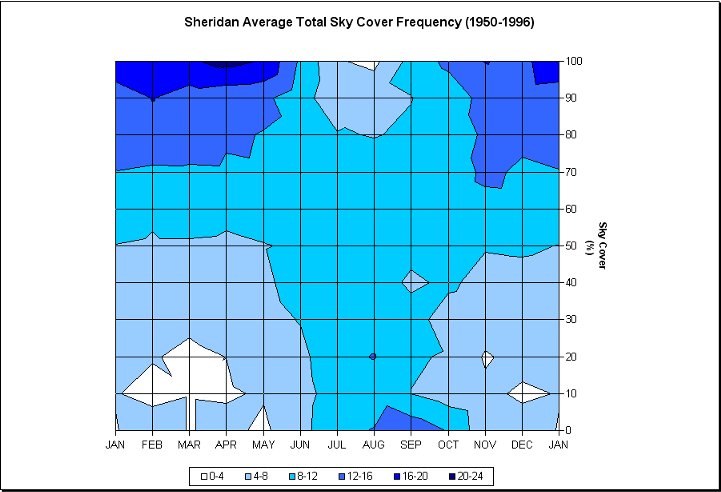
Figure 8.8. Same as Figure 8.5 except for Sheridan
In Figure 8.9, Figure 8.10, Figure 8.11, and Figure 8.12 ceiling height frequency by month for Casper, Cheyenne, Lander, and Sheridan from 1961-1990 show that low clouds at around 500 m dominate the most in late winter. Sheridan is the only station in this group that has a higher frequency of low clouds and lesser frequency of no ceiling conditions. A cloud ceiling is defined when fifty percent or greater sky cover is reached at a specific height above ground level. Instrument Flight Rates (IFR) conditions exist when ceilings are less than 3,000 feet (915 meters).
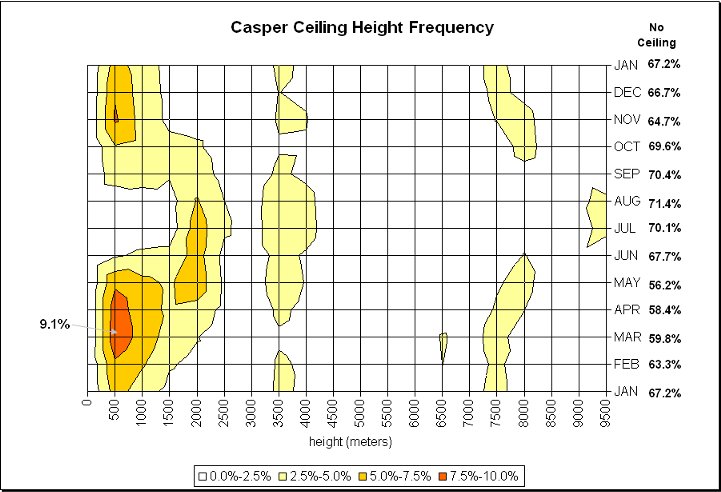
Figure 8.9. Casper monthly ceiling height frequency based on hourly observations from 1961 to 1990. Maximum annual frequency is depicted. Heights measured in meters.
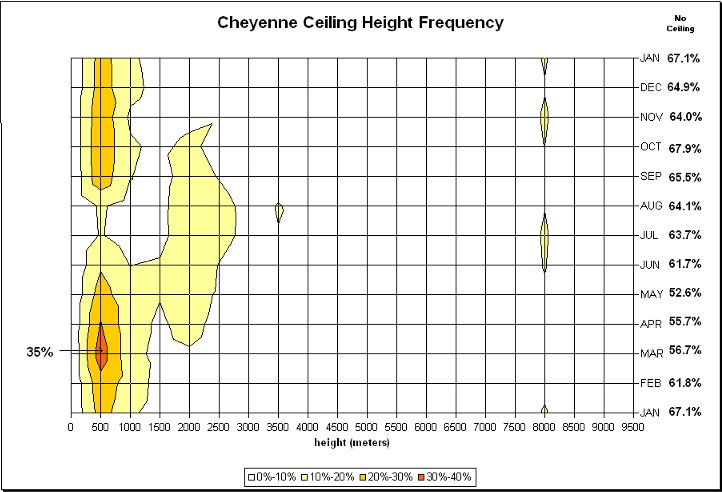
Figure 8.10. Same as Figure 8.9 except for Cheyenne
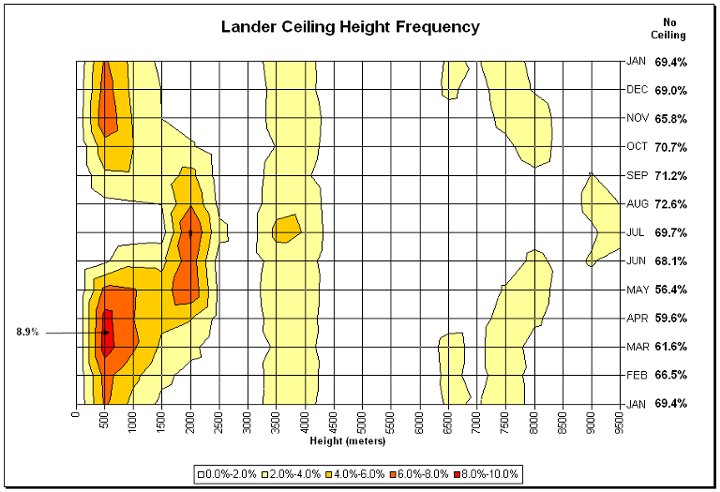
Figure 8.11. Same as Figure 8.9 except for Lander
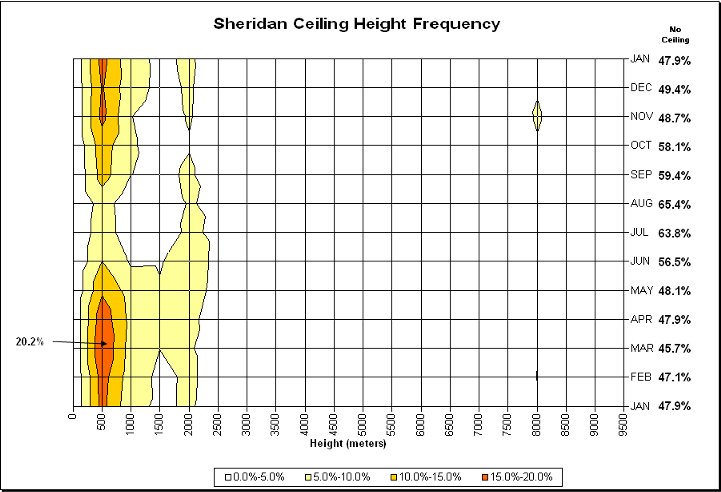
Figure 8.12. Same as Figure 8.9 except for Sheridan
Clouds dominate the sky most of the time. For example, in Table 8.A., the frequency of clouds over F.E. Warren AFB in Cheyenne is dependent on the cloud cover category and time of day.
|
Table 8.A. F.E. Warren AFB, Cheyenne, WY Sky Cover Frequency (%) (1982-1991) |
|
Hours (LST) |
Clear |
Scattered |
Broken |
Overcast |
Totally Obscured |
Partially Obscured |
Number of Observations |
|
00-02 |
37.4 |
21.3 |
15.9 |
22.1 |
3.3 |
0.5 |
46012 |
|
03-05 |
35.0 |
22.6 |
16.8 |
22.1 |
3.5 |
0.5 |
45953 |
|
06-08 |
28.1 |
22.4 |
22.2 |
24.3 |
3.0 |
0.6 |
45901 |
|
09-11 |
24.6 |
24.7 |
24.0 |
24.9 |
1.8 |
0.5 |
45920 |
|
12-14 |
16.4 |
25.9 |
29.9 |
26.5 |
1.3 |
0.5 |
45931 |
|
15-17 |
14.7 |
23.3 |
30.4 |
30.2 |
1.4 |
0.5 |
45927 |
|
18-20 |
20.9 |
23.6 |
25.9 |
27.4 |
2.1 |
0.4 |
45993 |
|
21-23 |
30.6 |
23.2 |
19.4 |
24.1 |
2.7 |
0.4 |
45955 |
|
average |
26.0 |
23.4 |
23.1 |
25.2 |
2.4 |
0.5 |
367592 |
By aviation standards, clear skies occur when there is less than a tenth cloud cover, scattered (1 to 4 tenths), broken (5 to 9 tenths), or overcast (10 tenths) cloud cover. Total obscuration occurs if clouds cannot be seen because of fog, haze, smoke, etc., excluding precipitation. Partial obscuration denotes that 1/8th or more of the sky, but not all of the sky, is hidden by any surface-based phenomena in the atmosphere, excluding precipitation. These cloud definitions differ from the ones used in section 8.3 below.
In Figure 8.13, Figure 8.14, Figure 8.15, and Figure 8.16, cloud height frequencies, independent of ceiling criteria, are shown for Casper, Cheyenne, Lander, and Sheridan from 1950-1996. Maximum frequencies generally occur in early spring and mid-summer although the summer cloud heights are two to three times higher. This phenomenon is observed because, during the warmer part of the year, the atmosphere expands, raising the height of expected condensation (saturation) of the air.
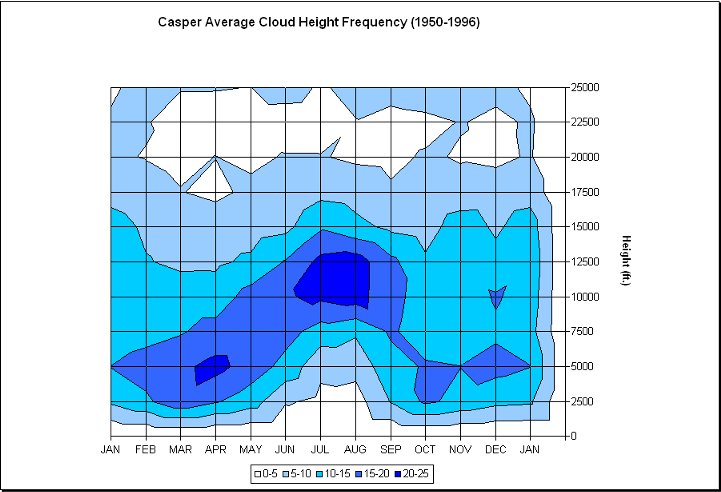
Figure 8.13. Casper cloud height frequency (%) (1950-1996). Heights measured in feet.
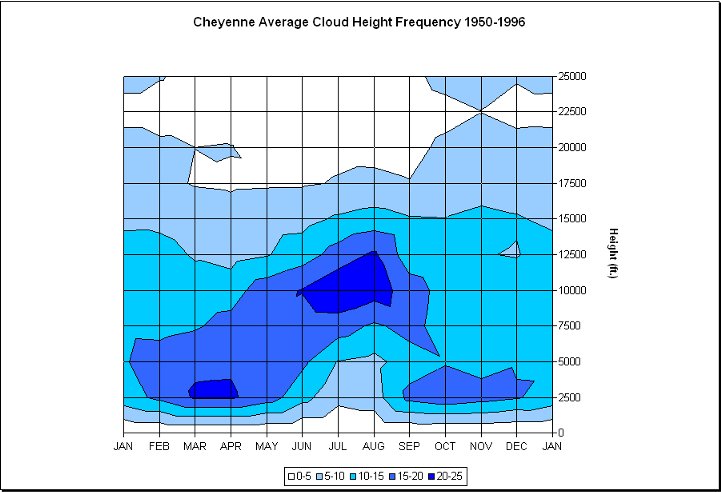
Figure 8.14. Same as Figure 8.13 except for Cheyenne
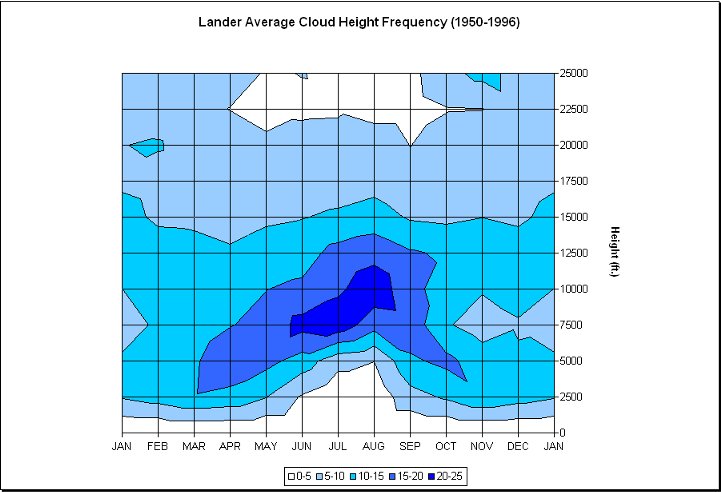
Figure 8.15. Same as Figure 8.13 except for Lander
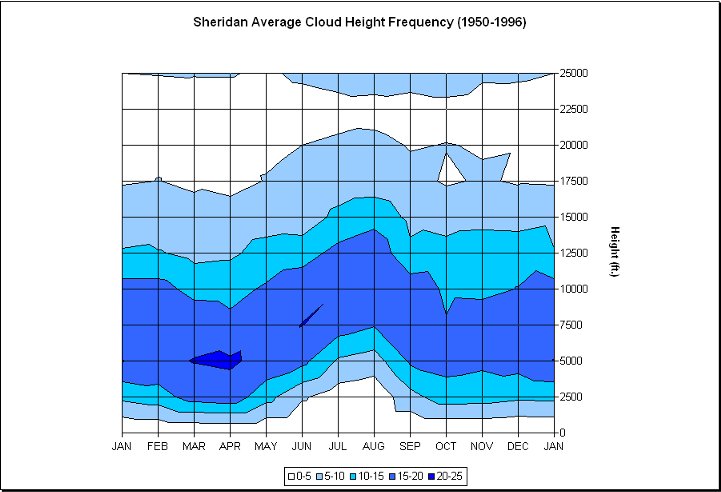
Figure 8.16. Same as Figure 8.13 except for Sheridan
In Figure 8.17, Figure 8.18, Figure 8.19, and Figure 8.20, mean hourly opaque sky cover by month for Casper, Cheyenne, Lander, and Sheridan from 1961-1990 is similar to total sky cover (Figure 8.1 through Figure 8.4). The opaque amounts are generally about seven hundredths less than total sky cover for minimum cloud cover and about double this difference during a period of maximum cloud cover, since higher thin clouds are harder to observe when lower clouds are blocking them from view.
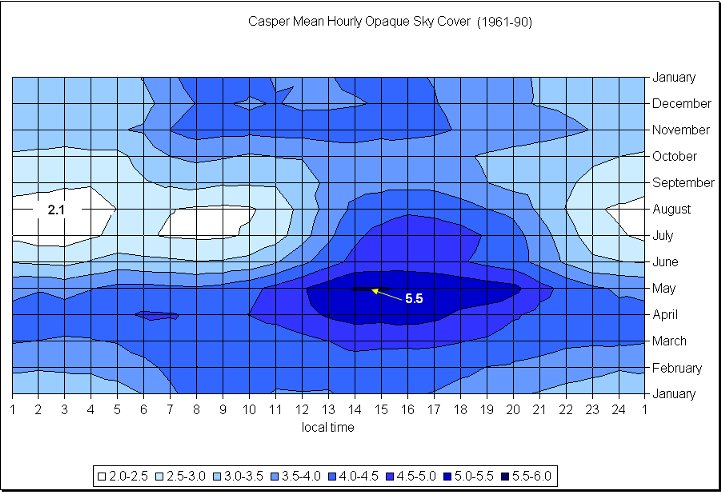
Figure 8.17. Casper hourly opaque sky cover amounts (in tenths) by month based on observations taken from 1961-1990. Minimum and maximum annual cloudiness are depicted.
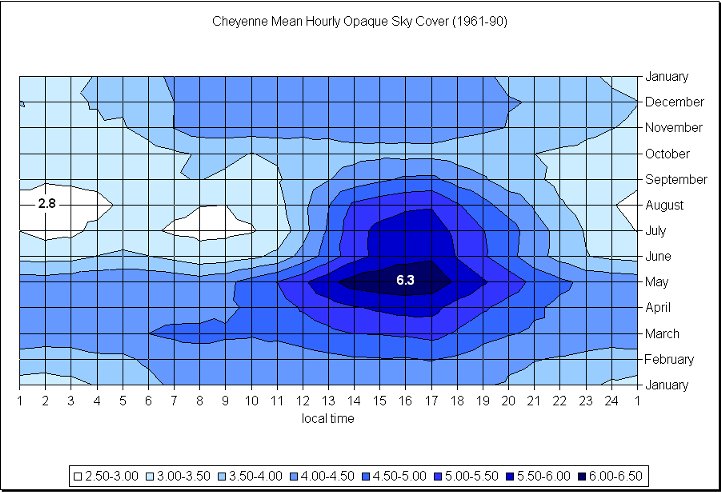
Figure 8.18. Same as Figure 8.17 except for Cheyenne
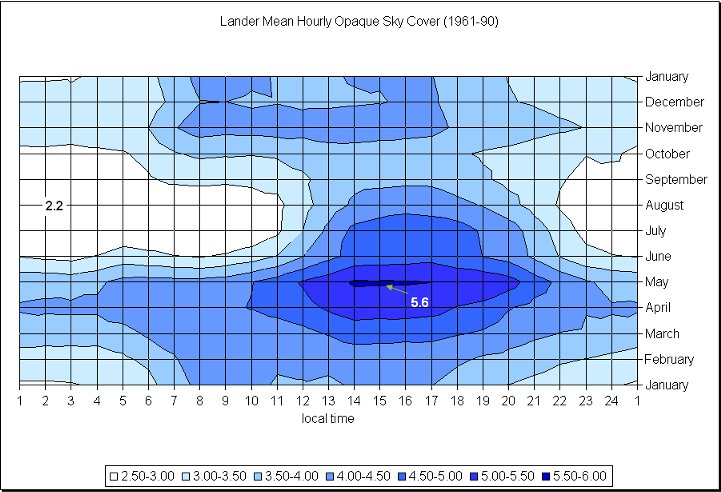
Figure 8.19. Same as Figure 8.17 except for Lander
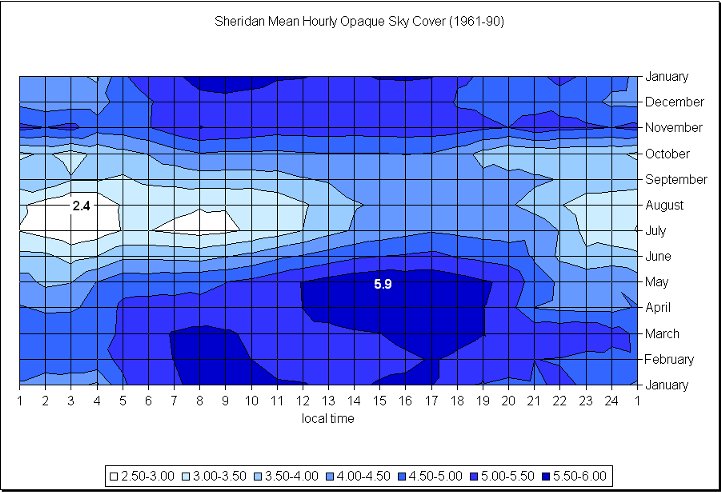
Figure 8.20. Same as Figure 8.17 except for Sheridan
Data79 in Table 8.B. and Table 8.C. are based on daylight hours only. Common cloud cover usage include: a clear day denotes zero to three-tenths average sky cover, partly cloudy is four- to seven-tenths, cloudy is eight- to 10-tenths. For partly cloudy days add the number of clear days to cloudy days and subtract from total days in the month to get the number of partly cloudy days. Annual totals may differ from the 12-month totals because of rounding. The news media generally use these cloud cover categories (not to be confused with aviation cloud cover classifications as discussed previously in Section 8.2.4).
|
Table 8.B. Mean monthly and annual number of clear days |
|
|
JAN |
FEB |
MAR |
APR |
MAY |
JUN |
JUL |
AUG |
SEP |
OCT |
NOV |
DEC |
ANN |
|
CASPER |
7 |
6 |
6 |
5 |
6 |
10 |
14 |
13 |
13 |
11 |
7 |
8 |
107 |
|
CHEYENNE |
9 |
7 |
7 |
6 |
5 |
9 |
10 |
10 |
13 |
13 |
10 |
9 |
106 |
|
LANDER |
8 |
7 |
7 |
6 |
6 |
10 |
14 |
13 |
14 |
12 |
8 |
10 |
114 |
|
SHERIDAN |
6 |
5 |
5 |
5 |
6 |
8 |
13 |
14 |
12 |
10 |
6 |
7 |
95 |
|
Table 8.C. Mean monthly and annual number of cloudy days |
|
|
JAN |
FEB |
MAR |
APR |
MAY |
JUN |
JUL |
AUG |
SEP |
OCT |
NOV |
DEC |
ANN |
|
CASPER |
16 |
14 |
16 |
16 |
15 |
9 |
6 |
7 |
8 |
12 |
14 |
15 |
147 |
|
CHEYENNE |
13 |
12 |
14 |
14 |
14 |
9 |
7 |
8 |
9 |
9 |
11 |
13 |
133 |
|
LANDER |
13 |
12 |
14 |
14 |
14 |
9 |
6 |
6 |
8 |
10 |
12 |
12 |
129 |
|
SHERIDAN |
17 |
15 |
17 |
16 |
15 |
11 |
6 |
6 |
9 |
12 |
16 |
17 |
157 |
IFR conditions occur when either the cloud ceiling goes below 3,000 feet and / or horizontal visibilities fall below three miles. In Table 8.D., Table 8.E., and Table 8.F., the frequency of hours that these conditions are met are shown for Casper, Lander, and Sheridan, respectively. Casper and Sheridan have similar IFR frequencies and are higher than Lander by a few percentage points. Generally, IFR conditions are more common during night hours except in summer when IFR conditions are quite uncommon.
|
Table 8.D. Casper (1950-1990) frequency (%) of hours with IFR
conditions |
|
STN |
LST |
JAN |
FEB |
MAR |
APR |
MAY |
JUN |
JUL |
AUG |
SEP |
OCT |
NOV |
DEC |
ANNUAL |
|
CAS |
02 |
13 |
18 |
22 |
22 |
17 |
9 |
4 |
3 |
11 |
13 |
15 |
13 |
13 |
|
|
05 |
14 |
17 |
23 |
22 |
18 |
12 |
5 |
4 |
10 |
15 |
15 |
13 |
14 |
|
|
08 |
11 |
16 |
22 |
23 |
18 |
10 |
4 |
4 |
11 |
14 |
13 |
12 |
13 |
|
|
11 |
10 |
14 |
20 |
20 |
15 |
6 |
2 |
2 |
9 |
13 |
13 |
10 |
11 |
|
|
14 |
10 |
12 |
15 |
15 |
11 |
4 |
1 |
1 |
7 |
10 |
11 |
10 |
9 |
|
|
17 |
9 |
13 |
14 |
13 |
10 |
3 |
1 |
1 |
6 |
9 |
12 |
10 |
8 |
|
|
20 |
13 |
15 |
16 |
15 |
11 |
4 |
1 |
1 |
7 |
10 |
14 |
12 |
10 |
|
|
23 |
14 |
17 |
19 |
18 |
15 |
7 |
2 |
2 |
9 |
13 |
14 |
13 |
12 |
|
|
ALL |
12 |
15 |
19 |
19 |
14 |
7 |
3 |
2 |
9 |
12 |
13 |
12 |
11 |
|
Table 8.E. Same as Table 8.D. except for Lander (1948-1990) |
|
STN |
LST |
JAN |
FEB |
MAR |
APR |
MAY |
JUN |
JUL |
AUG |
SEP |
OCT |
NOV |
DEC |
ANNUAL |
|
LAN |
02 |
9 |
11 |
16 |
17 |
14 |
5 |
2 |
1 |
7 |
9 |
11 |
9 |
9 |
|
|
05 |
9 |
12 |
15 |
17 |
13 |
5 |
1 |
1 |
8 |
9 |
13 |
9 |
9 |
|
|
08 |
10 |
12 |
14 |
16 |
12 |
6 |
1 |
1 |
8 |
10 |
12 |
10 |
9 |
|
|
11 |
9 |
11 |
13 |
15 |
13 |
6 |
1 |
1 |
8 |
9 |
10 |
9 |
9 |
|
|
14 |
9 |
8 |
11 |
12 |
9 |
4 |
1 |
1 |
7 |
8 |
10 |
9 |
7 |
|
|
17 |
7 |
8 |
11 |
10 |
9 |
3 |
1 |
1 |
5 |
6 |
9 |
8 |
7 |
|
|
20 |
9 |
11 |
13 |
13 |
10 |
3 |
1 |
1 |
6 |
8 |
12 |
10 |
8 |
|
|
23 |
9 |
12 |
15 |
15 |
12 |
5 |
1 |
1 |
7 |
8 |
12 |
9 |
9 |
|
|
ALL |
9 |
11 |
14 |
14 |
12 |
5 |
1 |
1 |
7 |
8 |
11 |
9 |
8 |
|
Table 8.F. Same as Table 8.D. except for Sheridan (1948-1990) |
|
STN |
LST |
JAN |
FEB |
MAR |
APR |
MAY |
JUN |
JUL |
AUG |
SEP |
OCT |
NOV |
DEC |
ANNUAL |
|
SHE |
02 |
16 |
19 |
20 |
17 |
13 |
7 |
3 |
2 |
8 |
11 |
15 |
14 |
12 |
|
|
05 |
17 |
20 |
23 |
21 |
16 |
9 |
3 |
3 |
9 |
13 |
15 |
16 |
14 |
|
|
08 |
17 |
20 |
23 |
22 |
18 |
11 |
4 |
3 |
10 |
13 |
15 |
15 |
14 |
|
|
11 |
14 |
16 |
19 |
22 |
16 |
11 |
3 |
3 |
11 |
13 |
13 |
14 |
13 |
|
|
14 |
12 |
14 |
18 |
20 |
14 |
8 |
2 |
2 |
9 |
11 |
13 |
12 |
11 |
|
|
17 |
13 |
15 |
17 |
17 |
13 |
6 |
2 |
1 |
8 |
11 |
14 |
13 |
11 |
|
|
20 |
16 |
17 |
19 |
16 |
13 |
5 |
2 |
1 |
7 |
10 |
15 |
16 |
11 |
|
|
23 |
17 |
16 |
19 |
15 |
12 |
5 |
2 |
1 |
7 |
11 |
14 |
15 |
11 |
|
|
ALL |
15 |
17 |
20 |
19 |
15 |
8 |
3 |
2 |
9 |
12 |
14 |
14 |
12 |
A further breakdown of frequency of IFR conditions is provided in Table 8.G. for Cheyenne. IFR conditions exist (100%-87.4%) or 12.6% of the time in Cheyenne. Ceilings lower than 1000 feet with visibilities below three miles occur about 8.8% of the time.
|
Table 8.G. F.E. Warren AFB, Cheyenne percent frequency of annual hours exceeding IFR conditions (Jan 1982 - Dec 1991) |
| Ceiling | Visibility | |||
|
3 miles |
2 miles |
1 mile |
0 mile |
|
|
3000 |
87.4 |
89.7 |
89.8 |
89.9 |
|
2500 |
88.3 |
90.2 |
90.2 |
90.3 |
|
2000 |
89.5 |
90.7 |
91.0 |
91.0 |
|
1500 |
89.8 |
91.6 |
91.9 |
92.0 |
|
1200 |
90.4 |
92.4 |
92.9 |
93.1 |
|
1000 |
91.2 |
92.8 |
93.3 |
93.5 |
|
900 |
92.0 |
93.3 |
93.8 |
94.1 |
|
800 |
92.3 |
93.7 |
94.3 |
94.6 |
|
700 |
93.1 |
94.2 |
95.0 |
95.3 |
|
600 |
94.2 |
94.9 |
95.8 |
96.3 |
|
500 |
94.8 |
95.6 |
96.6 |
97.2 |
|
400 |
95.2 |
96.2 |
97.4 |
98.2 |
|
300 |
95.5 |
96.5 |
98.0 |
99.1 |
|
200 |
95.5 |
96.6 |
98.1 |
99.7 |
|
100 |
95.5 |
96.6 |
98.1 |
100.0 |
Wyoming's skies provide a wide assortment of clouds throughout the year. In (Figure 8.21) and (Figure 8.22), two of the more recognizable cloud types are shown.
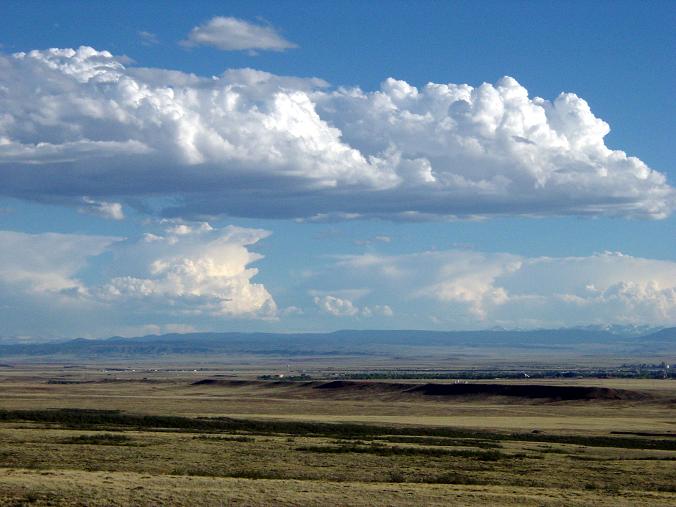
Figure 8.21. Cumulo-nimbus clouds located 60 mi southwest of Laramie are typical in summer
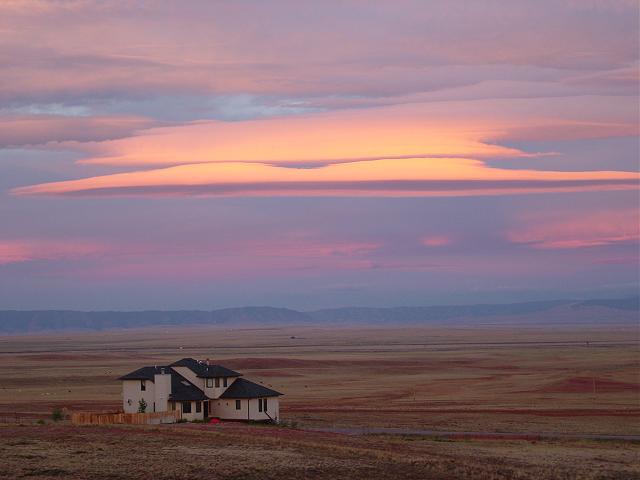
Figure 8.22. Alto-cumulus lenticular (mountain wave) clouds located over the Laramie Valley indicate high winds are presently aloft
80#. International Station Meteorological Climate Summary, Ver 3.0, March 1995 (NCDC).
| ← Previous Chapter | | Table of Contents | | Next Chapter → |
State Climate Office | Water Resources Data System
Last Modified: Fri, 17 Oct 2008