Water Resources Data System & State Climate Office
Water Resources Data System & State Climate Office
Water Resources Data System & State Climate Office


Wyoming Climate Atlas
 Wind
Wind
Wyoming is windy and during the winter there are frequent periods when the wind reaches 30 to 40 mph with gusts of 50 or 60 mph (ranks 1st in the US with an annual average wind speed of 12.9 mph). This status has created a humorous notoriety for the state (Figure 11.1). Prevailing wind direction varies from west-southwest through west to northwest and is somewhat determined by local terrain. In many localities, winds are so strong and constant from those directions that trees show a definite lean towards the east. Many wind farms have been established over southern Wyoming in places such as Arlington89, Medicine Bow, Rock River, near Evanston, and just south of Cheyenne in order to take advantage of this important renewable energy resource.
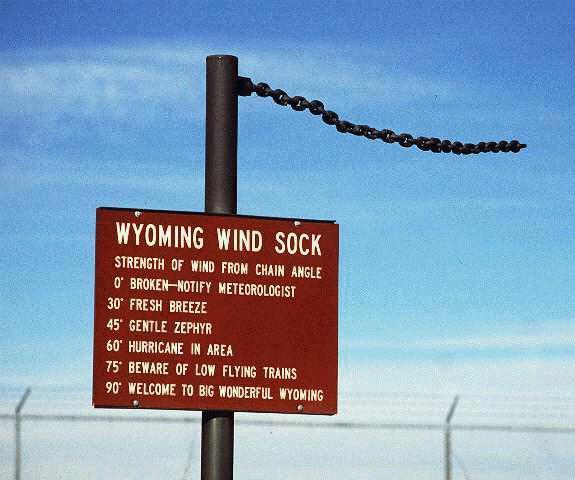
Figure 11.1. Wyoming Wind Sock 90
The significance of high winds can be seen if one considers the following equation:
P = 0.00256 * V2 * Cd where, 0.00256 is the mass density of air at 0°C and normal air pressure.
P is the wind pressure in pounds per square foot (lbs ft -2).
V is the wind speed in miles per hour (mph).
Cd is the shape coefficient number. Most standing structures including cars have a Cd of ∼2.0.
For example, Plywood, has a Cd =1.2 and a 4x8 foot sheet would experience 9.8 pounds of wind pressure (with winds blowing directly on it at sea-level) at 10 mph, 61 pounds at 25 mph, 245 pounds at 50 mph, 980 pounds at 100 mph, and 3,920 pounds at 200 mph! Even at Wyoming's higher elevations where air is not as dense as at sea-level, pressure on any structure increases remarkably quickly with increasing winds.
At roughly 10,000 feet for the same example, the results are as following: at 10 mph 7 pounds, at 25 mph 43 pounds, at 50 mph 172 pounds, at 100 mph 688 pounds, and at 200 mph 2752 pounds.
AD is roughly equal to [0.348444 * P - h * (0.00252 * t - 0.020582)] / (273.15 + t), where
AD = Air Density in kg/m3
P = Air pressure in (mb)
h = Relative Humidity (%)
t = Air Temperature ( ° C)
For t = 20° C, P = 1013.25 mb, and h = 50%, AD = 1.2 kg m-3
However, wind pressure also varies on structures that are not solid, such as snow fences. Appendix F contains three tables that help one calculate the wind pressure on snow fences with a porosity ratio of 0.5 (Cd = 1.05) and at various fence heights. Correction factors based on elevation, temperature, and other porosity values are also shown.
As technology improves renewable energy will become the dominate alternative energy resource. While Wyoming ranks 1st in the US in coal mining, its high ranking in available winds makes the "mining" of wind increasingly cost effective. The state's wind resource is ranked 7th among the contiguous states. Approximately 42,875 mi2 of available windy land has a potential wind energy yield of 747 billion kWh per year with a wind energy potential (average power) of 85,200 MW. This is equivalent to the potential of supplying approximately 66 million homes with energy annually.
In Figure 11.2, the average annual wind speed at a 50 meter height is shown at 400 m resolution. The average adjusted bias over all stations is 1-2% of the projected/measured speed, while the standard deviation of the bias is 2-4%. These discrepancies are within the measurement error of the meteorological equipment. It is recommended that a +/-7 percent accuracy generally be assumed for the Wind Map results at most sites.91 The equivalent wind power is shown in Figure 11.3. Accuracy over complex terrain is within +/-15 percent of depicted values. Note the highest wind power is located over the Laramie, Snowy, Wind, and Absaroka Mountain ranges.
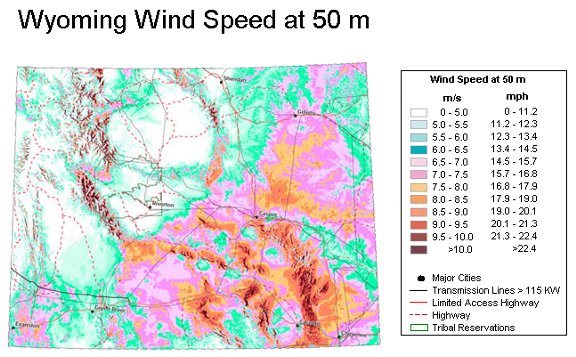
Figure 11.2. Modeled wind speed over Wyoming at 50 m height and 400 m resolution (Copyright 2002 TrueWind Solutions, LLC.)
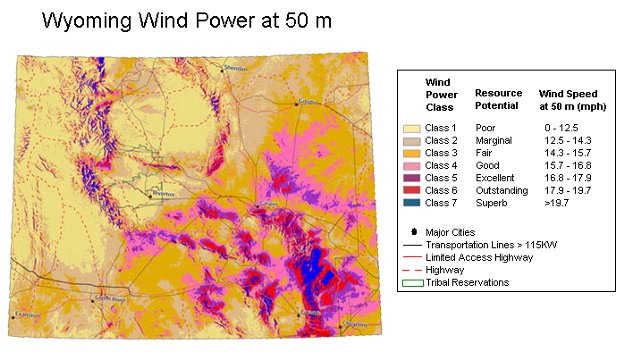
Figure 11.3. Modeled wind power over Wyoming at 50 m height, measured in units of power density (Copyright 2002 TrueWind Solutions, LLC.)
These high resolution modeled maps are the product of the Wind Power Maps Organization. 92 Various caveats pertaining to Figure 11.2 and any actual measured or estimated winds within the boundary layer93 of the atmosphere are provided below.
It must always be kept in mind that the wind conditions at a particular location may differ substantially from the predicted values because of variations in elevation, exposure, surface roughness, or other factors. The following guidelines should be followed when interpreting Figure 11.2 and any wind data in general:
High reporting frequency of winds in Wyoming is limited to the first order weather stations (officially recognized by the National Climate Data Center) and from WYDOT's reporting road side network. In this section an overview of these data are provided.
The hourly winds measured at airports are normally two or three minute averages of three or five second samples at the top of every hour. These are not gusts. Newer equipment, particularly the Automated Surface Observation System (ASOS) used at most locations since 1996, automatically records these values from cup anemometer values.
Older observations (generally prior to 1996) represent data recorded by personnel working at weather stations who manually observed wind speed and direction at the top of every hour, and made an estimation of hourly winds over some time period, typically two to five minutes in length.
In Figure 11.4, Figure 11.5, Figure 11.6, and Figure 11.7, mean hourly wind speed by month for Casper, Cheyenne, Lander, and Sheridan from 1961-1990 reveals that the weakest winds occur in the mornings and the strongest winds occur in early to mid-afternoon, although the time of year for these extremes to occur is different. Casper shows the largest range in wind speeds while Lander shows the smallest range followed closely by Sheridan.
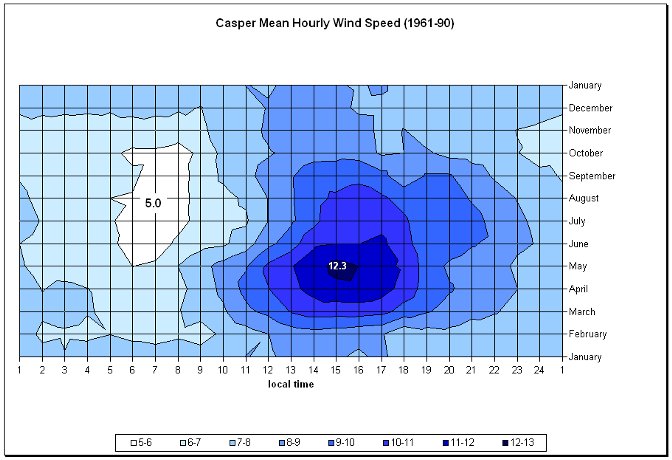
Figure 11.4. Casper mean hourly wind speed (mph) based upon observations taken between 1961-90. Extreme annual values are depicted.
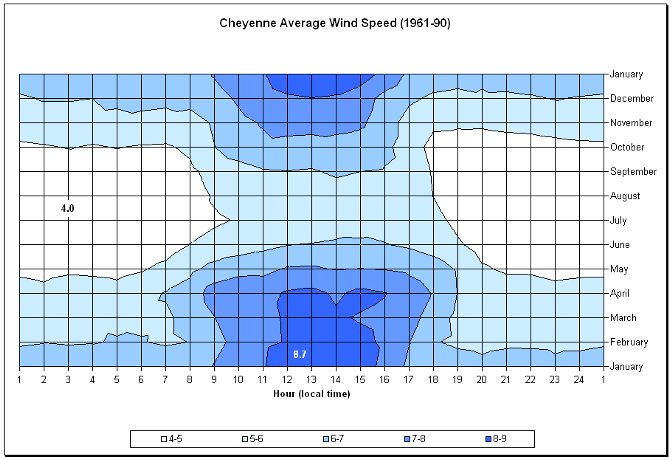
Figure 11.5. Same as Figure 11.4 except for Cheyenne
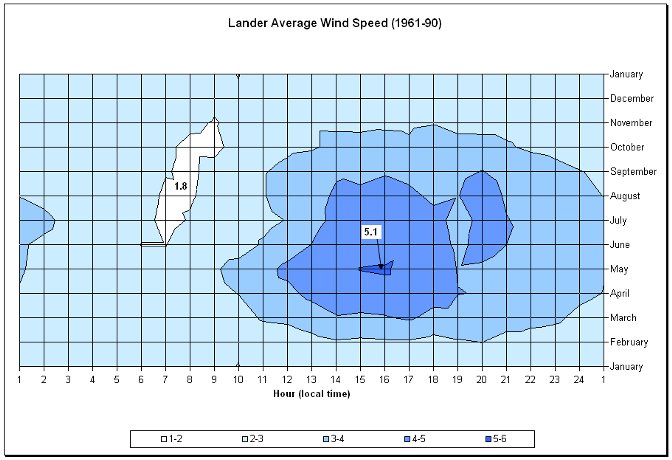
Figure 11.6. Same as Figure 11.4 except for Lander
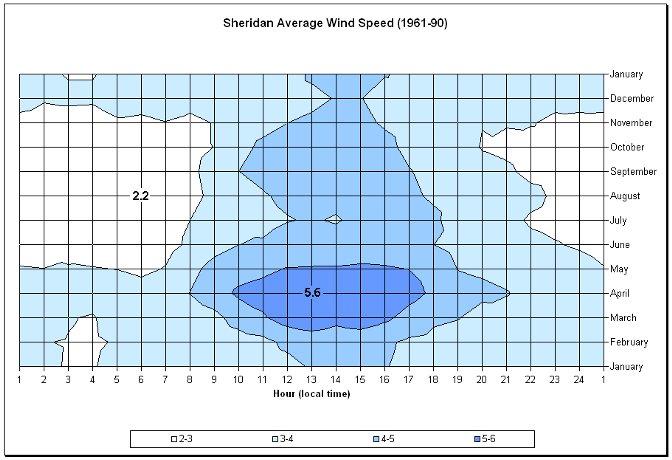
Figure 11.7. Same as Figure 11.4 except for Sheridan
In Figure 11.8, Figure 11.9, Figure 11.10, and Figure 11.11, the January wind roses for Casper, Cheyenne, Lander, and Sheridan from 1961-1990 are depicted. Casper shows prevailing (strongest) winds from the southwest, Cheyenne from the west and northwest, Lander from the southwest and southeast, and Sheridan from the northwest. Frequency rings are at different scales for each city. January is generally the windiest month for these locations. For other months and locations, see the companion CD.96

Figure 11.8. Casper January wind rose based upon observations taken between 1961-90. Speeds are measured in m s-1. Double the values to approximate mph.
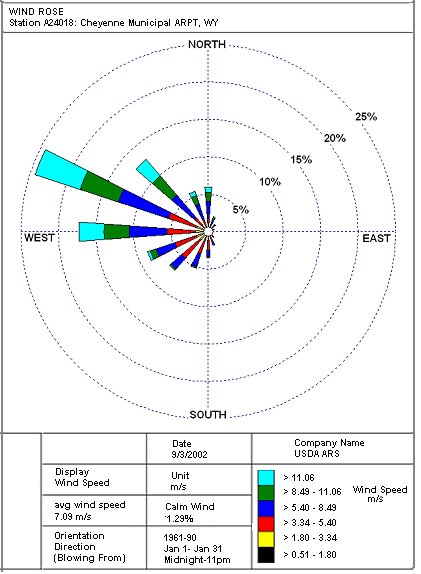
Figure 11.9. Same as Figure 11.8 except for Cheyenne
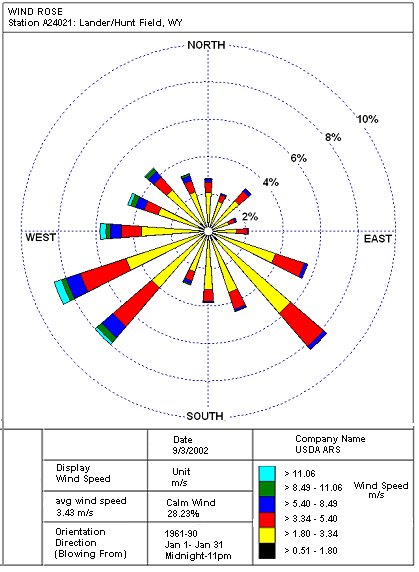
Figure 11.10. Same as Figure 11.8 except for Lander
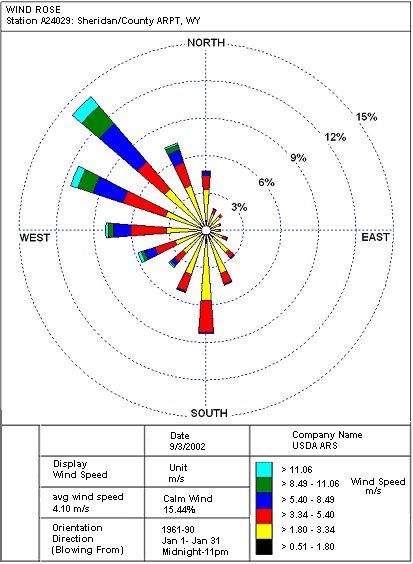
Figure 11.11. Same as Figure 11.8 except for Sheridan
In Figure 11.12, Figure 11.13, Figure 11.14, and Figure 11.15, the wind directions by hour and month for Casper (1950-1990), FE Warren AFB (Cheyenne) (1982-1991), Lander and Sheridan (1948-1990) are shown. Although different sample averaging and periods are used, the effects of topography (mountain-valley) winds are suggested. For Casper, during the spring and summer, early evening winds are generally out of the south-southeast while, during the day, the winds are out of the south-southwest. This pattern is more pronounced in Cheyenne but is reversed in Lander. Sheridan shows more diurnal wind-direction variability in late summer and early fall.
Caution should be exercised when determining winds from a 0-degree direction. Stations are required to report calm winds from 0 degrees and northerly winds from 360 degrees. However, this reporting procedure has been inconsistent. Additionally, taking average wind directions requires that a weighting factor be applied. For example, let's say that in three hours, winds are reported at 350, 360, and 010 degrees. The average could be interpreted as (350+360+010)/3 = 240, but, of course, the average direction is 360. A simple method for determining an approximate average wind direction is to simply calculate the average frequency percentage for each quandrant, multiply the result by the mean value of that quadrant, and then add all the quadrant contributions. For example, the 1- to 90-degree quadrant (ignore 0 degrees as explained above) contributes 10 percent of the total direction, the 91- to 180-degree quadrant contributes 20 percent, the 181- to 270-degree quadrant contributes 30 percent, and the 271- to 360-degree quadrant contributes 40 percent. Therefore the wind direction is roughly equal to (1+90)/2 * 0.10 + (91+180)/2 * 0.20 + (181+270)/2 * 0.30 + (271+360) * 0.40 = 221.45 degrees. This approximation usually works to within a few degrees of the actual average wind direction if the sample is very large (i.e., >5000 data points).
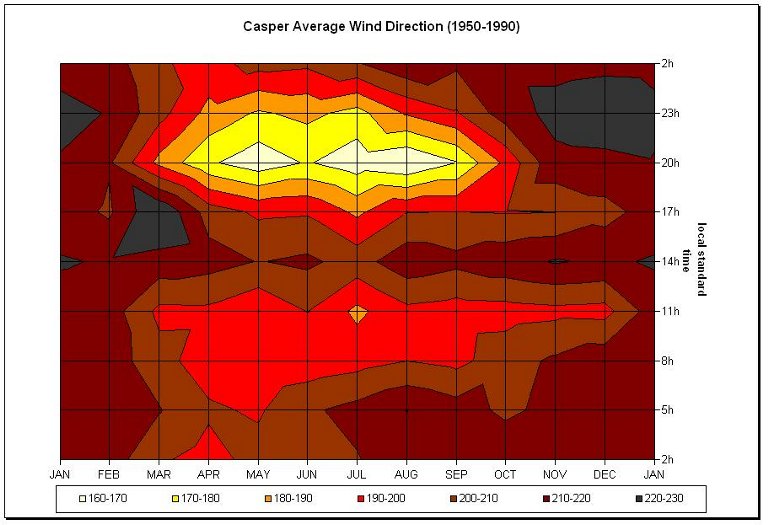
Figure 11.12. 3-hour average wind direction by month for Casper (1950-1990)
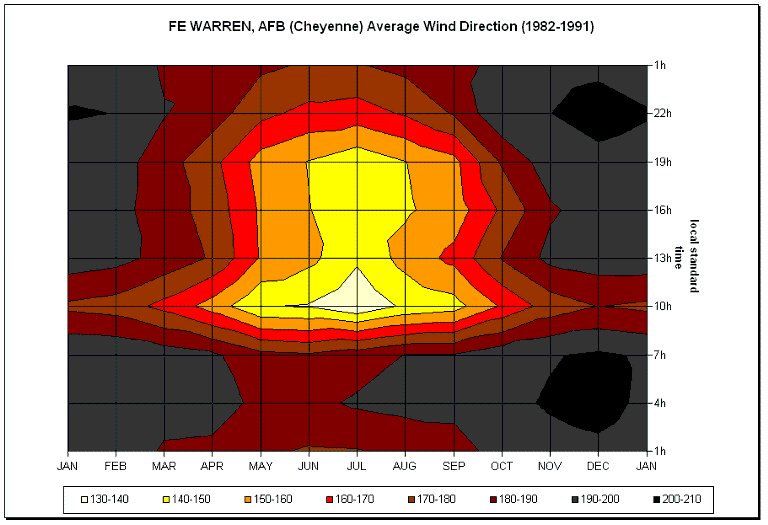
Figure 11.13. Same as Figure 11.12 except for FE Warren AFB (Cheyenne) (1982-1991)
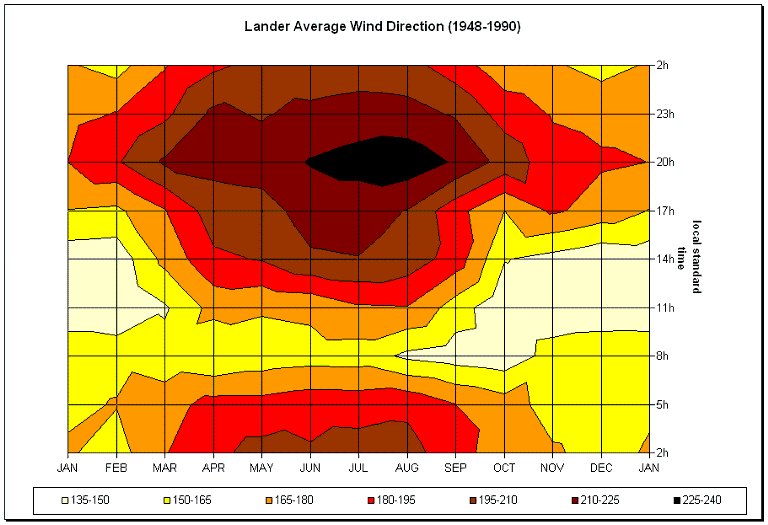
Figure 11.14. Same as Figure 11.12 except for Lander (1948-1990). Note scaling differences.
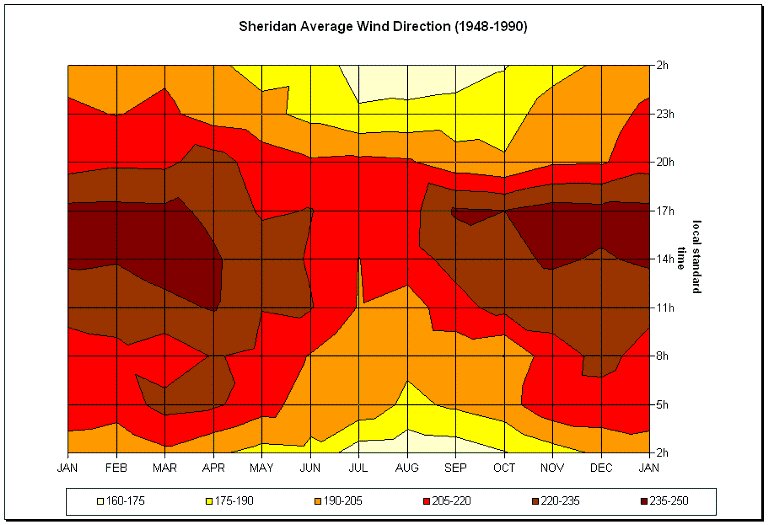
Figure 11.15. Same as Figure 11.12 except for Sheridan (1948-90). Note scaling differences.
In Figure 11.16, Figure 11.17, Figure 11.18, and Figure 11.19, the wind direction frequency by month for Casper, Cheyenne, Lander, and Sheridan from 1961-1990 shows that the maximum frequency varies by location. Casper (230 degs) and Cheyenne (290 degs) have their maximum frequencies in December and January, respectively. Lander has its maximum frequency in July (240 degs) and Sheridan in March (320 degs).

Figure 11.16. Casper wind direction frequency based upon hourly observations taken between 1961-90. The maximum annual frequency is depicted.
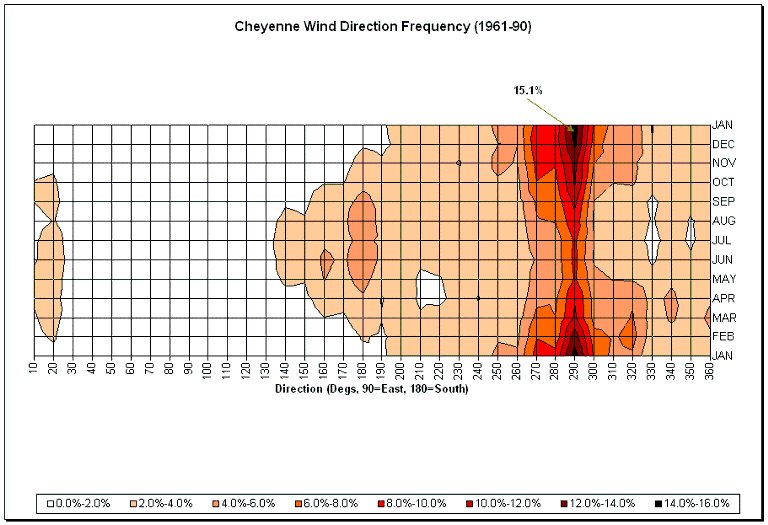
Figure 11.17. Same as Figure 11.16 except for Cheyenne

Figure 11.18. Same as Figure 11.16 except for Lander
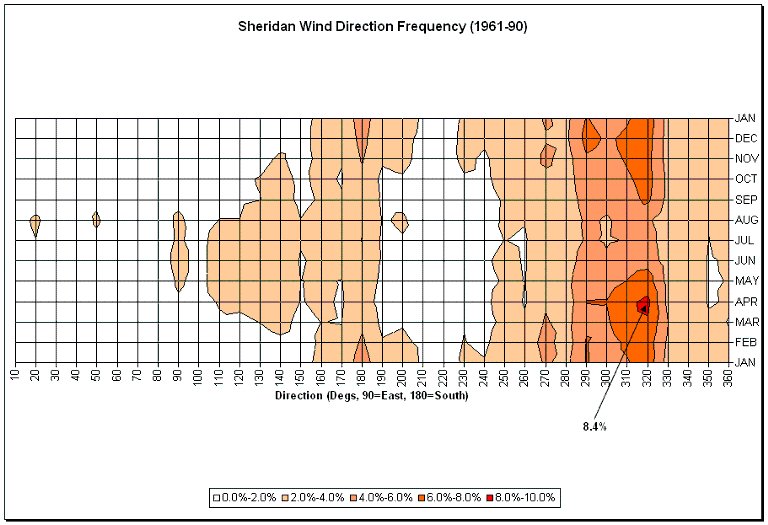
Figure 11.19. Same as Figure 11.16 except for Sheridan
Although long-term climate averages are useful when there is a need for a quick summary of weather information, continuously changing weather results in climate conditions that are seldom average. For example, when examining the yearly average wind speeds for Casper, Cheyenne, Lander, Rock Springs, and Sheridan (1961-1990) based on hourly observations, subtle variations are noted. In figure 11.20, the annual average wind speed frequencies for various wind ranges shows fairly persistent speeds year after year. However, upon further investigation, wind speed frequencies at the lowest and highest ranges often show more than half or double the annual long-term average (figure 11.21). Note strong winds in 1964 for Cheyenne, Lander, and Sheridan. For wind speed and temperature correlation, Casper, Lander, and Rock Springs were statistical significance at the 95% level or better while for wind speed and precipitation, only Cheyenne and Rock Springs were statistically significant. Sheridan showed no significance in our data sample while those stations that did, all had negative correlations. Thus, increased wind speed generally resulted in cooler annual temperatures and less annual precipitation.
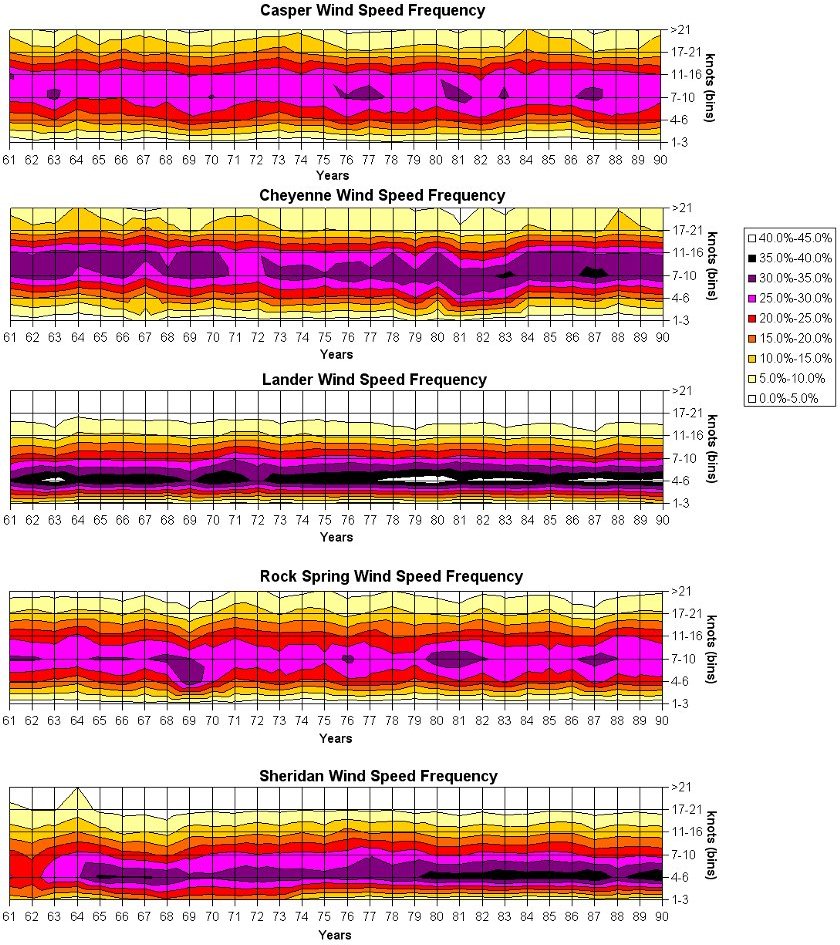
Figure 11.20. Annual average wind speed for Casper, Cheyenne, Lander, Rock Springs, and Sheridan (1961-1990) based on hourly observations for various wind speed intervals (in knots)
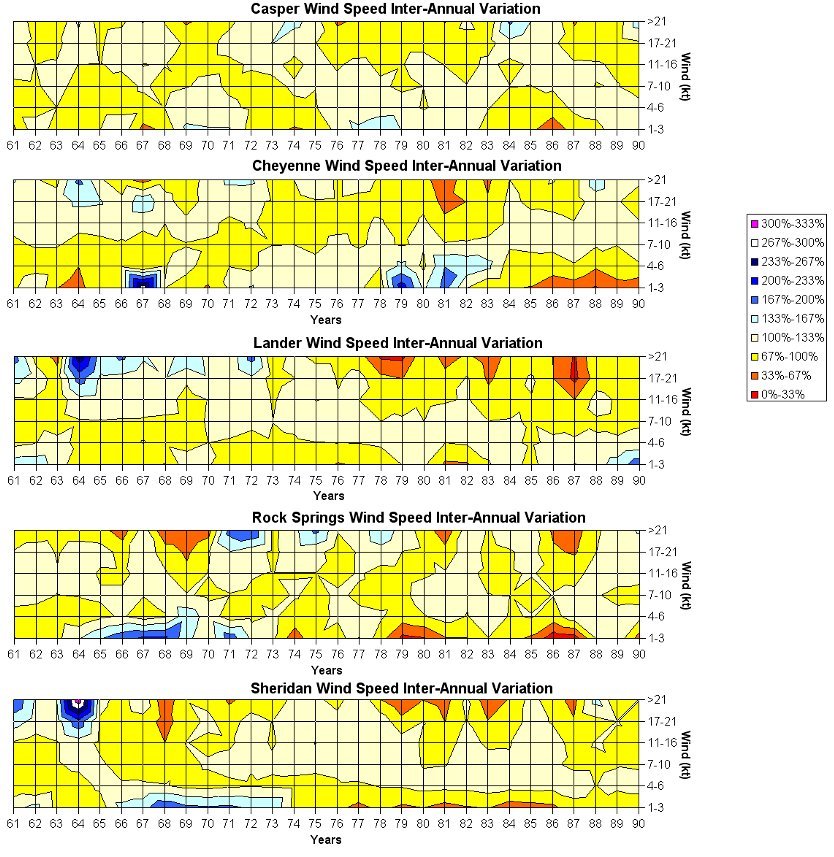
Figure 11.21. Annual wind speed departures from average for Casper, Cheyenne, Lander, Rock Springs, and Sheridan (1961-1990) for various wind speed intervals (in knots)
In Figure 11.22, the annual average wind speed for the five sampled stations, along with their linear trend lines, averages, and percent of inter annual variability are shown (highest to lowest extremes). With global warming, one would expect to see a decreasing average wind speed trend as the thermal gradient between the poles and the equator lessen. However, although all stations showed this negative trend, only Lander's trend was determined to be statistically significant. Cheyenne and Sheridan had the greatest inter annual variability (>140%) while Casper had the least with only 119%.
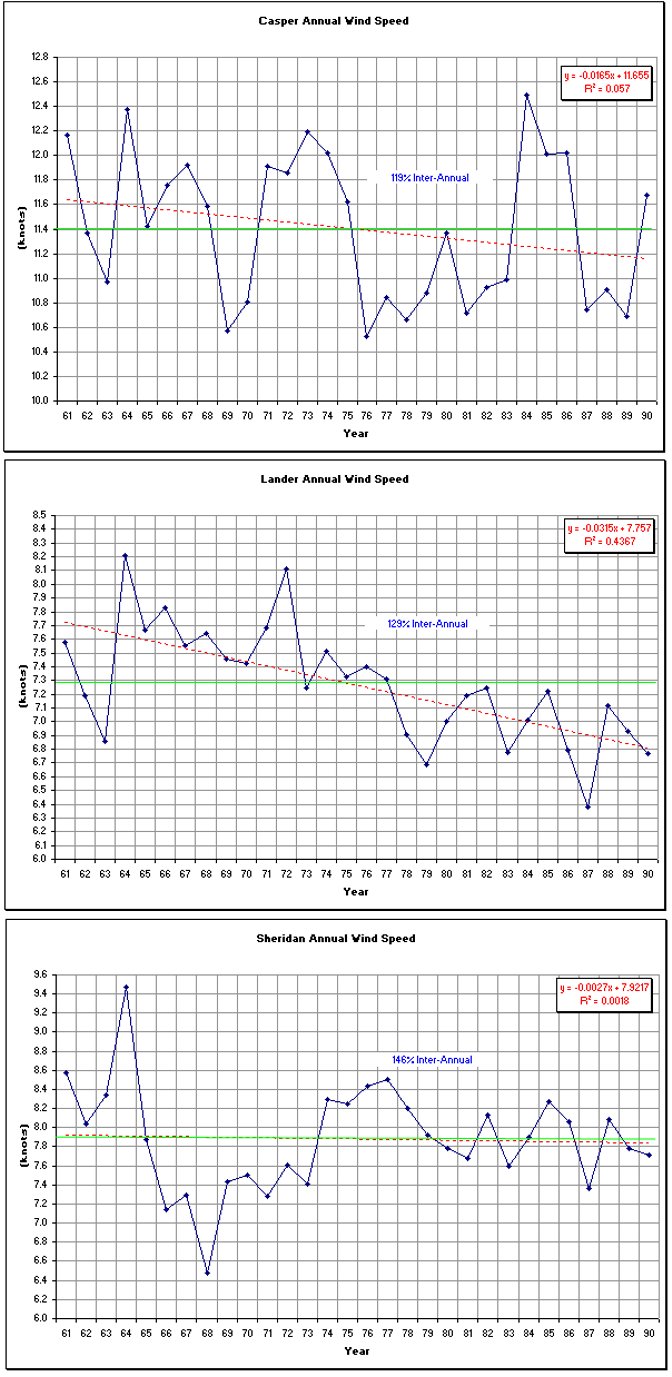
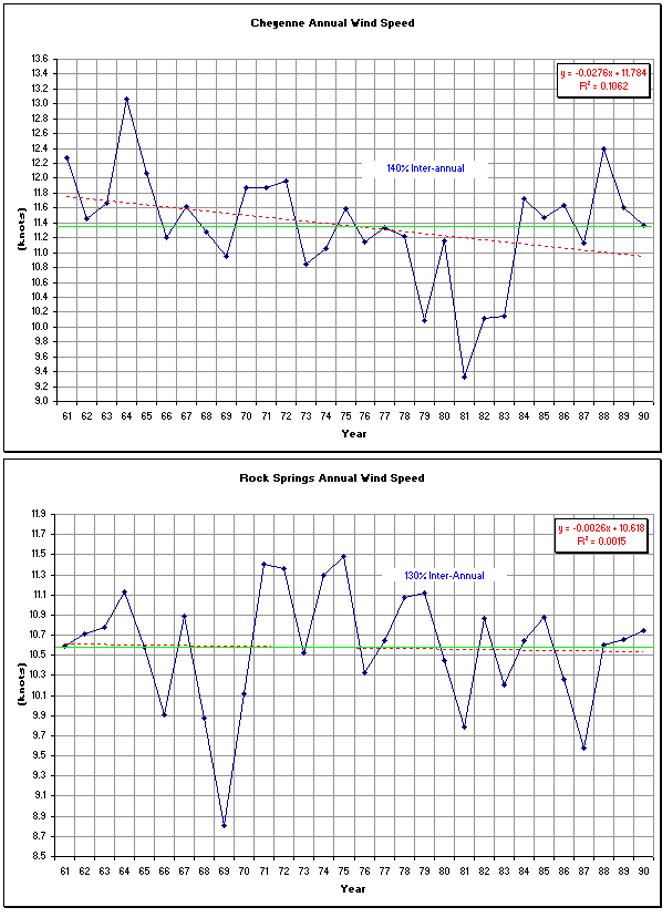
Figure 11.22. Annual wind speed for Casper, Cheyenne, Lander, Rock Springs, and Sheridan (1961-1990) with trends, averages, and inter annual variability (%)
When comparing annual wind direction frequencies (figure 11.23), Casper clearly reveals the most persistent winds from the southwest with a curious exception in 1972-3. Generally, the winds from the most prominent prevailing direction will vary by five percent of the time and lesser percentage for other wind directions. Wind direction is generally correlated to annual precipitation for most wind directions except for Sheridan's southerly wind component where no significance exists. However, wind direction is not correlated to annual average temperature for any of the stations in this study.
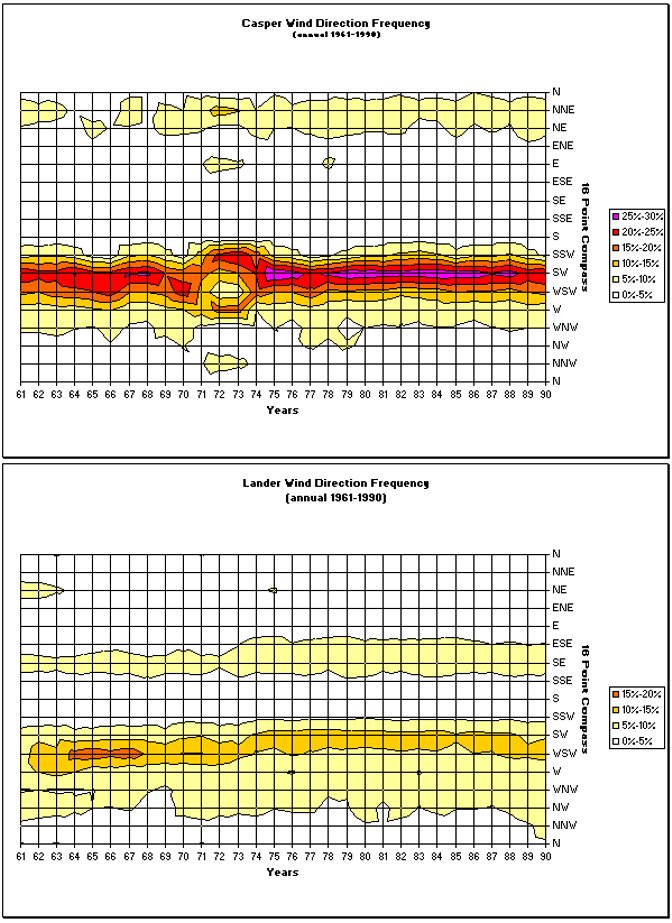
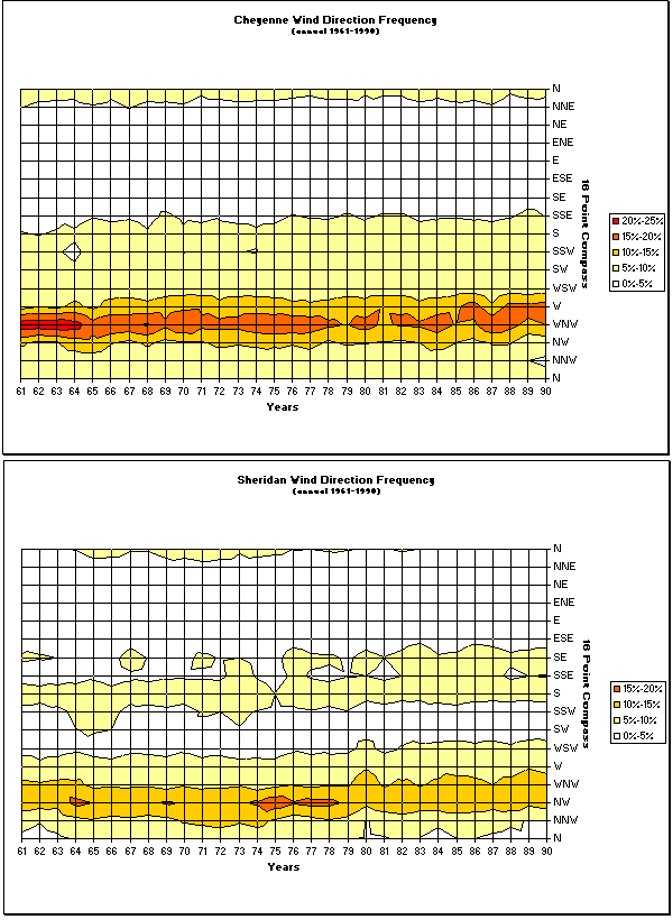
Figure 11.23. Annual wind direction frequencies for Casper, Cheyenne, Lander, and Sheridan (1961-1990)
As noted in Figure 11.23a, during times of blowing snow, wind direction can vary from the southwest through the northwest depending on local topography. Optimal positioning of snow fences (maximum snow catch) is achieved when winds are perpendicular to these structures.
Figure 11.23a. Prevailing snow transport in Wyoming based on modeled data
Since wind chill cannot be measured by thermometer and there are no climate records or statistics of just how cold "it feels", the discussion of this topic seems more relevant to wind. In Figure 11.24, the National Weather Service's new wind chill index chart is provided. This newer index calculates wind speed at an average height of five feet (typical height of an adult human face) based on readings from the national standard height of 33 feet (typical height of an anemometer). Frostbite on exposed skin occurs in 15 minutes or less at wind chill values of -18° F or lower.
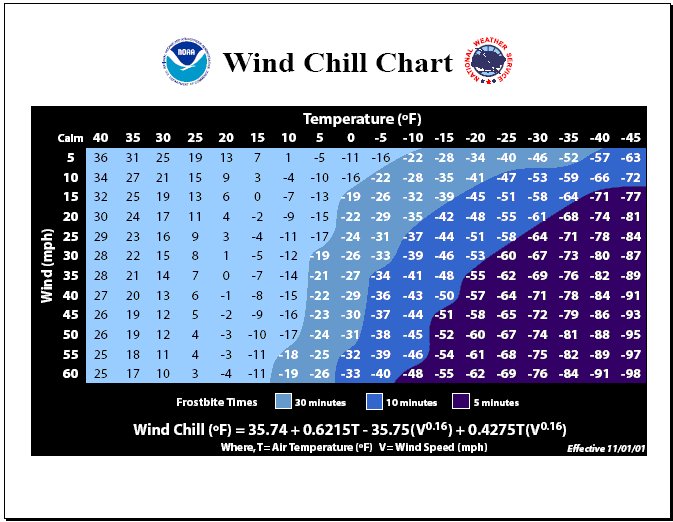
Figure 11.24. Official NWS wind chill index chart (effective 2001)
Higher resolution reports at 10 to 15 minute intervals from 1994-2001 are available on the Atlas CD.98 Figure 11.25 and Figure 11.26 are examples of average and maximum wind frequencies for Arlington, WY. Note that there is only a small difference between average and maximum winds. Based upon an average January temperature of 15° F and average winds of 35 mph, the average wind chill temperature is -7° F.
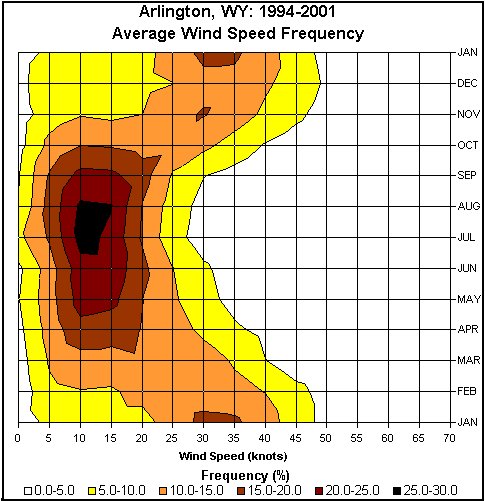
Figure 11.25. Arlington, WY average monthly wind speed (1994-2001) based on 10 to 15 minute reports
Figure 11.26. Same as Figure 11.25 except for monthly maximum wind speed.
90#. Windsock photo courtesy of Tom Dietrich
91#. For a higher resolution maps, see CD: Wind, graphs, WindPower folders
92#. http://www.windpowermaps.org/windmaps/states.asp
93#. http://lidar.ssec.wisc.edu/papers/akp_thes/node6.htm
94#. http://www.windpower.org/en/tour/wres/shelter/index.htm
95#. ftp://ftp.wcc.nrcs.usda.gov/downloads/climate/windrose/wyoming
96#. CD: Wind, Graphs, WindRose folders
97#. http://www.nws.noaa.gov/om/windchill/index.shtml
98#. CD: Appendix_data, text, WYDOT folders
State Climate Office | Water Resources Data System
Last Modified: Fri, 23 May 2025