Water Resources Data System & State Climate Office
Water Resources Data System & State Climate Office
Water Resources Data System & State Climate Office


Wyoming Climate Atlas
 Solar Radiation
For most of Wyoming, sunshine ranges from 60 percent of the possible amount during winter to about 75 percent during the summer (ranks 9th in the US with an annual average of 64 percent). Mountain areas receive less, and in the winter, the estimated amount over the northwestern mountains is about 45 percent. In the summer when sunshine is greatest - not only in time but also intensity - it is characteristic for the mornings to be mostly clear. Cumulus clouds develop nearly every day and frequently blot out the sun for a portion of the afternoons. Because the altitude provides less atmosphere for the sun's rays to penetrate and because of the very small amount of fog, haze, and smoke, the intensity of sunshine is unusually high. On a cloudless summer day ultraviolet radiation is about 25 percent higher at 14,000 feet than it is at 5,500 feet. However, the amount of solar radiation reaching the ground is also a function of cloud height and cloud thickness. As noted in Figure 12.0, lower cloud bases will reduce the effectiveness of solar radiation heating the ground more than higher thinner clouds. Except for strong winds occurring with air temperatures below 20 °F or so, daytime solar radiation is usually sufficient to warm the pavement surface above freezing.98c This has implications with respect to the formation of ice from blowing snow. Because of Wyoming's abundance of sunshine, this important renewable resource (Figure 12.1) has its own dedicated chapter in this atlas. By understanding the nature of solar energy, architects can better design homes and office buildings for maximum energy efficiency, agricultural stakeholders can better calculate evapotranspiration, and users of solar batteries can better outfit remote areas with backup or alternate power supplies.
Figure 12.0. Solar radiation reaching the ground surface as a ratio of that on a clear day, in relation to cloud cover and height of cloud base above ground98a 98b
Solar energy is measured at Wyoming's only primary station at Lander and is modeled at its secondary stations in Casper, Cheyenne, Rock Springs, and Sheridan. Total solar radiation has also been measured at Afton since 1988 and various components of solar radiation have been measured at Green River since 1994.
For the period from 1961-1990 hourly, daily, monthly, and annual climatology for the primary (direct measurements)99 and secondary (modeled based on cloudiness) 100 stations across Wyoming are available. To better understand the nature and uses of these data the following definitions are provided:
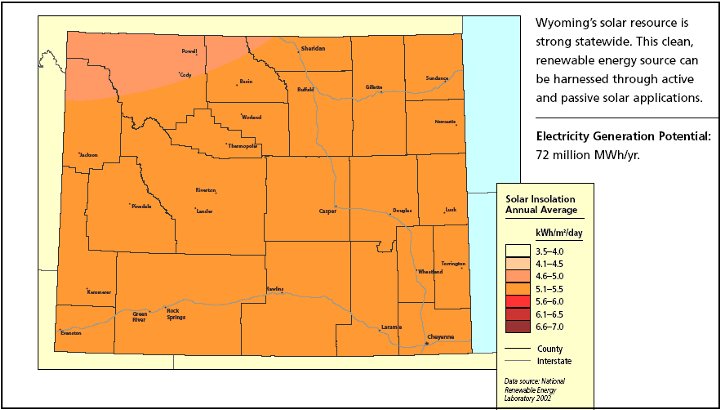
Figure 12.1. Wyoming's annual daily average solar insolation (KWh/m2/day)101
Incident solar radiation is given in terms of global radiation, clear-day global radiation, and diffuse radiation (Figure 12.2).
Diffuse radiation is the sum of sky radiation and the radiation reflected from the ground in front of the surface. The ground-reflected radiation is usually calculated using a ground reflectivity or albedo of 0.2, a nominal value for green vegetation and some soil types (Figure 12.3).
Global radiation is the total radiation received by the window and is the sum of the direct beam radiation component, sky radiation, and radiation reflected from the ground in front of the surface. Clear-day global radiation represents the global radiation obtainable under clear skies (Figure 12.4).
Transmitted solar radiation into a living space is less than the radiation that strikes the outside of a window because of losses associated with radiation reflected off of and absorbed by the glass. Of course, the type of glass (e.g., low E) will result in different values for effective solar gains or losses within a space. For south-facing windows, the geometry balances the need for maximum heat gain during the heating season without creating unreasonable heat gain during the cooling season. The shading geometries provide guidance for the appropriate dimensions of roof overhangs. However, situations may require a different geometry depending on the balance between heating and cooling loads for the particular building and factors such as required window sizes and building practices. For east- and west-facing windows, overhangs are not particularly effective in preventing unwanted heat gain. Additional shading strategies such as vertical louvers may be needed. The tables and charts that follow provide solar radiation data in units of Btu / ft2 / day for five surfaces: a horizontal (Figure 12.5) window and a vertical window facing north, east, south, and west. Standard deviations and minimum and maximum monthly and yearly values of global horizontal radiation are provided to show the variability of the solar resource at a station. These quantities pertain to monthly and yearly values, rather than to single days.
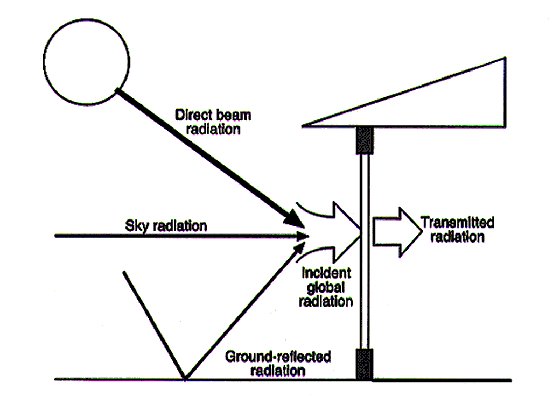
Figure 12.2. Types of solar radiation
Figure 12.3. Lander average monthly and annual diffuse radiation (1961-1990)
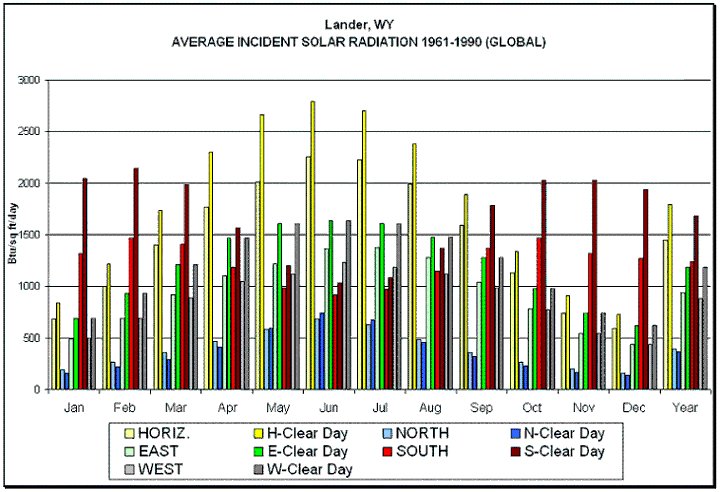
Figure 12.4. Lander average monthly and annual global radiation (1961-1990)
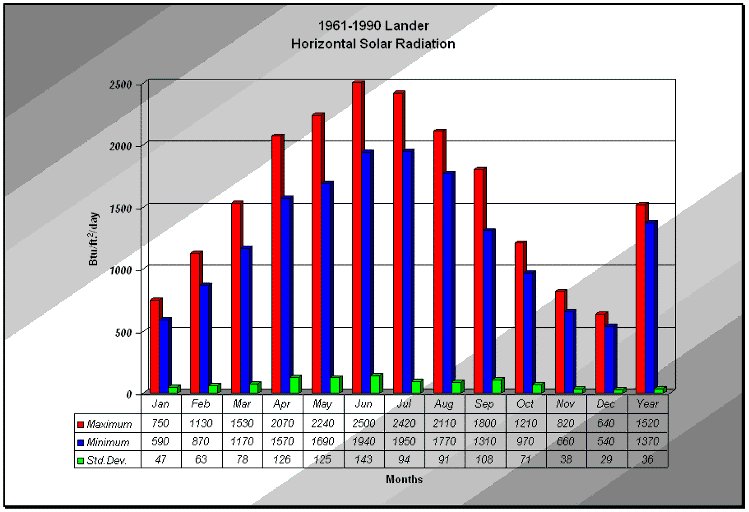
Figure 12.5. Lander monthly and annual extreme horizontal radiation (1961-1990)
In Figure 12.5a, Afton's solar radiation frequency is depicted by month from 1988 to 2003. As would be expected, the highest daily readings occur in June and July but the highest frequency occurs in winter at low radiation values.

Figure 12.5a. Afton Solar Radiation Frequency (1988-2003)
As a consequence of Wyoming's size, it takes approximately 30 to 45 minutes for the sun to rise or set across the state, depending on time of year. As depicted in Figure 12.6 through Figure 12.11., the equinox sun lines (times of equal events) are roughly north-south while, during the solstice, the sun lines have the greatest angle with respect to the latitude bands.
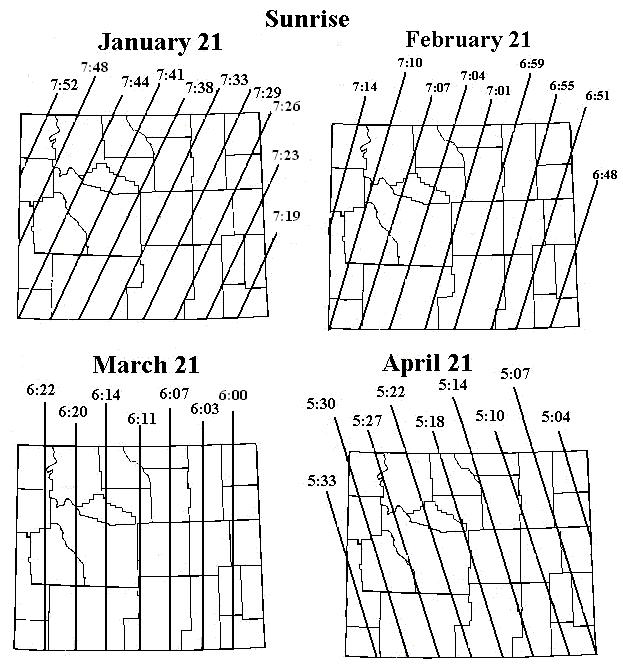
Figure 12.6. Wyoming sunrise times on the 21st of the month for January through April. All times are in mountain standard time(MST).
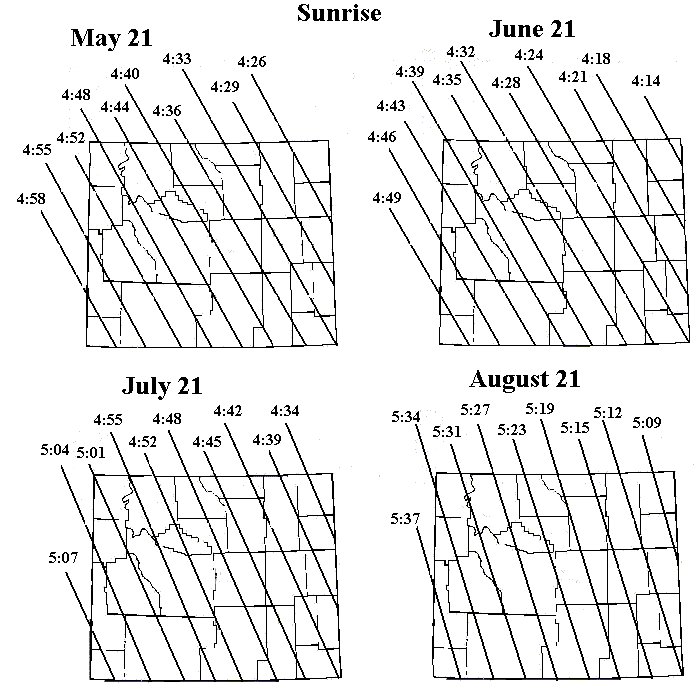
Figure 12.7. Same as Figure 12.6 except for May through August (M.S.T.)
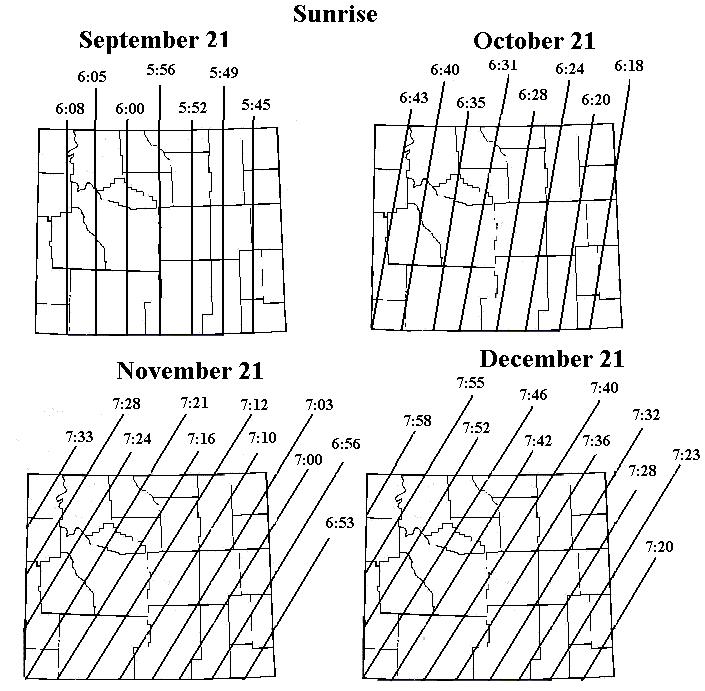
Figure 12.8. Same as Figure 12.6 except for September through December (M.S.T.)
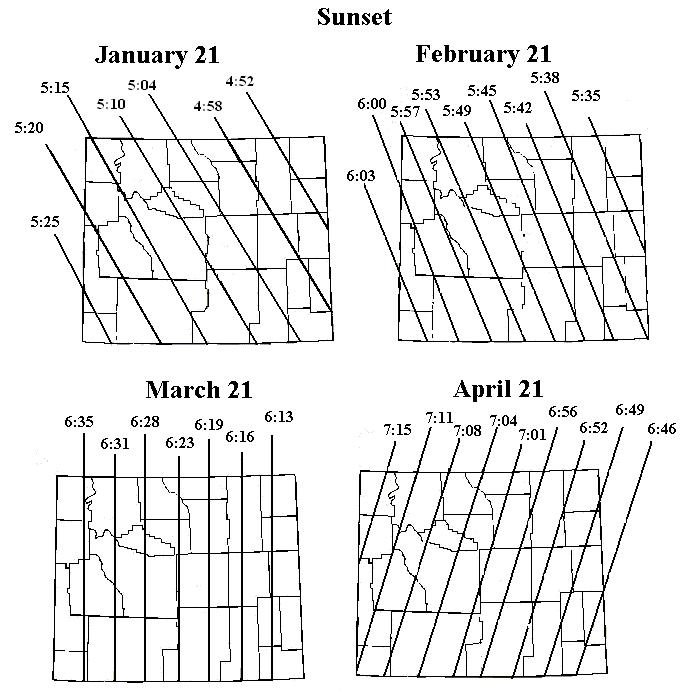
Figure 12.9. Same as Figure 12.6 except for sunsets (M.S.T.)
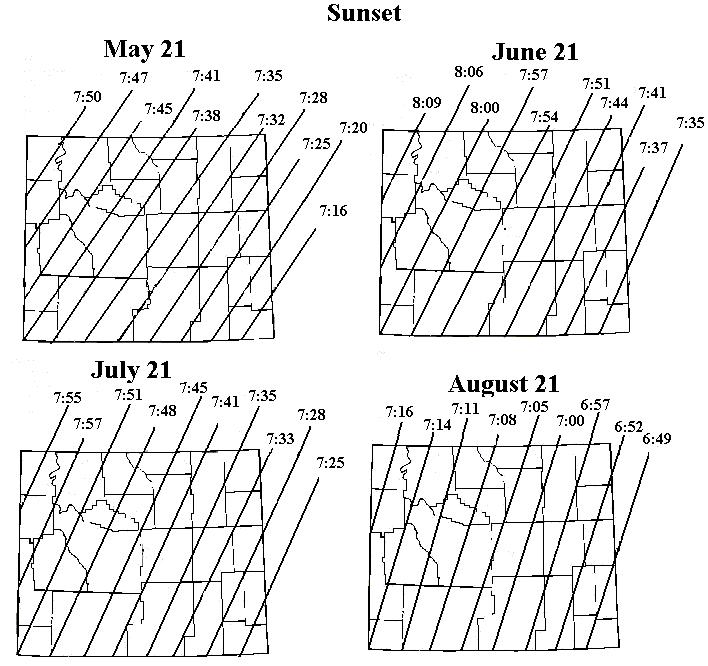
Figure 12.10. Same as Figure 12.6 except for sunsets (May through August) (M.S.T.)
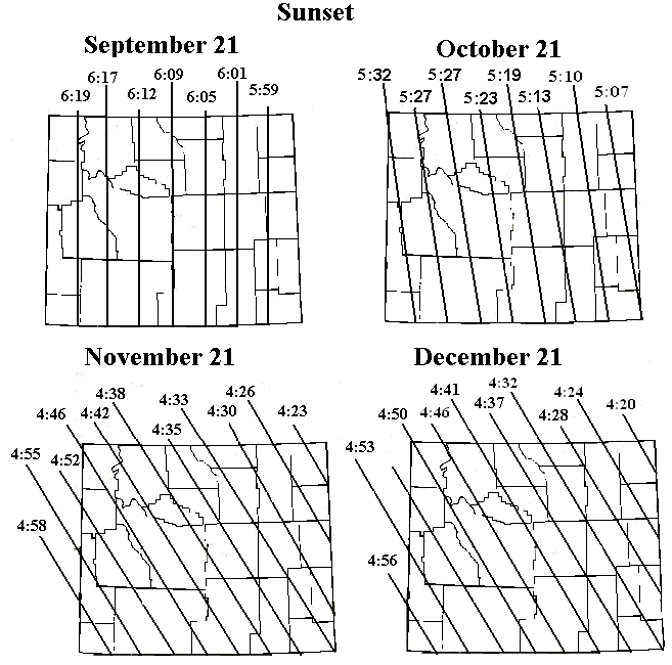
Figure 12.11. Same as Figure 12.8 except for sunsets (September through December) (M.S.T.)
If one wants to take advantage of solar gain when building a passive solar designed home, it is imperative to know where the sun is at all hours thoughout the year. In Table 12.A., the sun's position on December 21 and June 21 are shown for Laramie. Azimuth directions are; 90=east, 180=south, 270=west, and 0 or 360=north. For other locations, see the US Naval Observatory website. 103
Table 12.A. Solar elevation and azimuth for Laramie on the solstice (in degrees)
|
Standard Time |
December 21 | June 21 | ||
|
Elevation |
Azimuth |
Elevation |
Azimuth |
|
|
04:00 (4AM) |
|
|
-5.3 |
52.2 |
|
05:00 |
|
|
4.3 |
62.2 |
|
06:00 |
|
|
14.6 |
71.4 |
|
07:00 |
-4.9 |
117.2 |
25.5 |
80.3 |
|
08:00 |
4.8 |
127.1 |
36.7 |
89.6 |
|
09:00 |
13.0 |
138.2 |
47.9 |
100.5 |
|
10:00 |
19.5 |
150.8 |
58.6 |
115.0 |
|
11:00 |
23.8 |
164.9 |
67.7 |
138.2 |
|
12:00 |
25.3 |
179.9 |
72.1 |
177.0 |
|
13:00 (1PM) |
23.8 |
194.9 |
68.6 |
217.5 |
|
14:00 |
19.6 |
209.0 |
59.9 |
242.5 |
|
15:00 |
13.1 |
221.7 |
49.3 |
257.9 |
|
16:00 |
4.9 |
232.8 |
38.2 |
269.0 |
|
17:00 |
-4.8 |
242.7 |
27.0 |
278.5 |
|
18:00 |
|
|
16.0 |
287.4 |
|
19:00 |
|
|
5.7 |
296.6 |
|
20:00 |
|
|
-4.1 |
306.4 |
The distribution of erythemal (skin-reddening) ultrabiolet radiation109a at the Earth's surface is derived from satellite-based observations of atmosphereic ozone and cloud reflectivity. The climatology (figure 12.12) may be helpful in assessing the role of long-term environmental exposure to UV (e.g., in epidemiological studies of skin cancer). Comparisons with ground-based measurements show agreement at the 10-20% level at mid-latitudes.
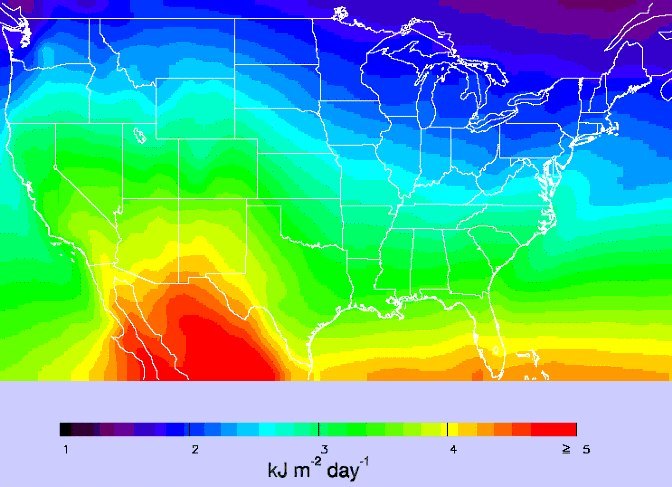
Figure 12.12. Daily Erythemal UV doses averaged over 1979-1992
The ozone layer shields the Earth from harmful UV radiation. Ozone depletion, as well as seasonal and weather variations, cause different amounts of UV radiation to reach the Earth at any given time. Developed by the National Weather Service (NWS) and EPA, the UV Index109b predicts the next day's ultraviolet radiation levels on a 0-10+ scale, helping people determine appropriate sun-protective behaviors. Figure 12.13 shows the new UV Index.
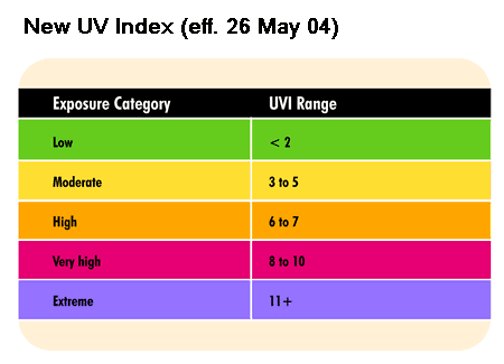
Figure 12.13. New UV Index
98b. Calex Electronics Limited. Temperature Handbook, 12th Edition. Bedfordshire, England. Undated.
98c. http://www.tablerassociates.com/images/Snow04-A030.pdf
99. http://rredc.nrel.gov/solar/old_data/nsrdb/bluebook/
100. http://rredc.nrel.gov/solar/pubs/bluebook/appendix.html#calcincrad
101. http://www.energyatlas.org/PDFs/LowRes/atlas_state_WY.pdf
102. http://aa.usno.navy.mil/data/docs/RS_OneDay.html
103. http://aa.usno.navy.mil/data/docs/AltAz_noJS.html
109a. http://www.bmayer.de/papers/doe99.pdf
109b. http://www.epa.gov/sunwise/uvilaunch.html
State Climate Office | Water Resources Data System
Last Modified: Fri, 23 May 2025