Water Resources Data System & State Climate Office
Water Resources Data System & State Climate Office
Water Resources Data System & State Climate Office


Station Map | WACNet Home
Week at a Glance
| Date | TMax (F) | TMin (F) | TAvg (F) | SoilTemp (F) | Avg Vapor Pressure (kPa) | Avg Sat Vapor Pressure (kPa) | Avg RH (%) | Solar Rad (w/m^2) | Avg Wind Spd (mph) | Precipitation (") |
| 2026-03-16 | 35.03 | 12.97 | 23.88 | 32.00 | 0.15 | 0.45 | 37 | 224.10 | 13.95 | 0.00 |
| 2026-03-17 | 51.17 | 22.80 | 39.26 | 32.00 | 0.43 | 0.84 | 51 | 185.00 | 13.86 | 0.00 |
| 2026-03-18 | 62.44 | 32.41 | 49.26 | 32.00 | 0.34 | 1.24 | 31 | 229.30 | 16.00 | 0.00 |
| 2026-03-19 | 70.99 | 29.32 | 53.56 | 32.00 | 0.34 | 1.52 | 27 | 251.10 | 10.60 | 0.00 |
| 2026-03-20 | 74.34 | 29.02 | 54.50 | 32.00 | 0.32 | 1.61 | 25 | 252.10 | 10.94 | 0.00 |
| 2026-03-21 | 74.46 | 35.66 | 55.58 | 32.00 | 0.32 | 1.65 | 23 | 252.40 | 9.64 | 0.00 |
| 2026-03-22 | 74.98 | 32.31 | 54.14 | 32.00 | 0.36 | 1.62 | 30 | 246.90 | 9.51 | 0.00 |
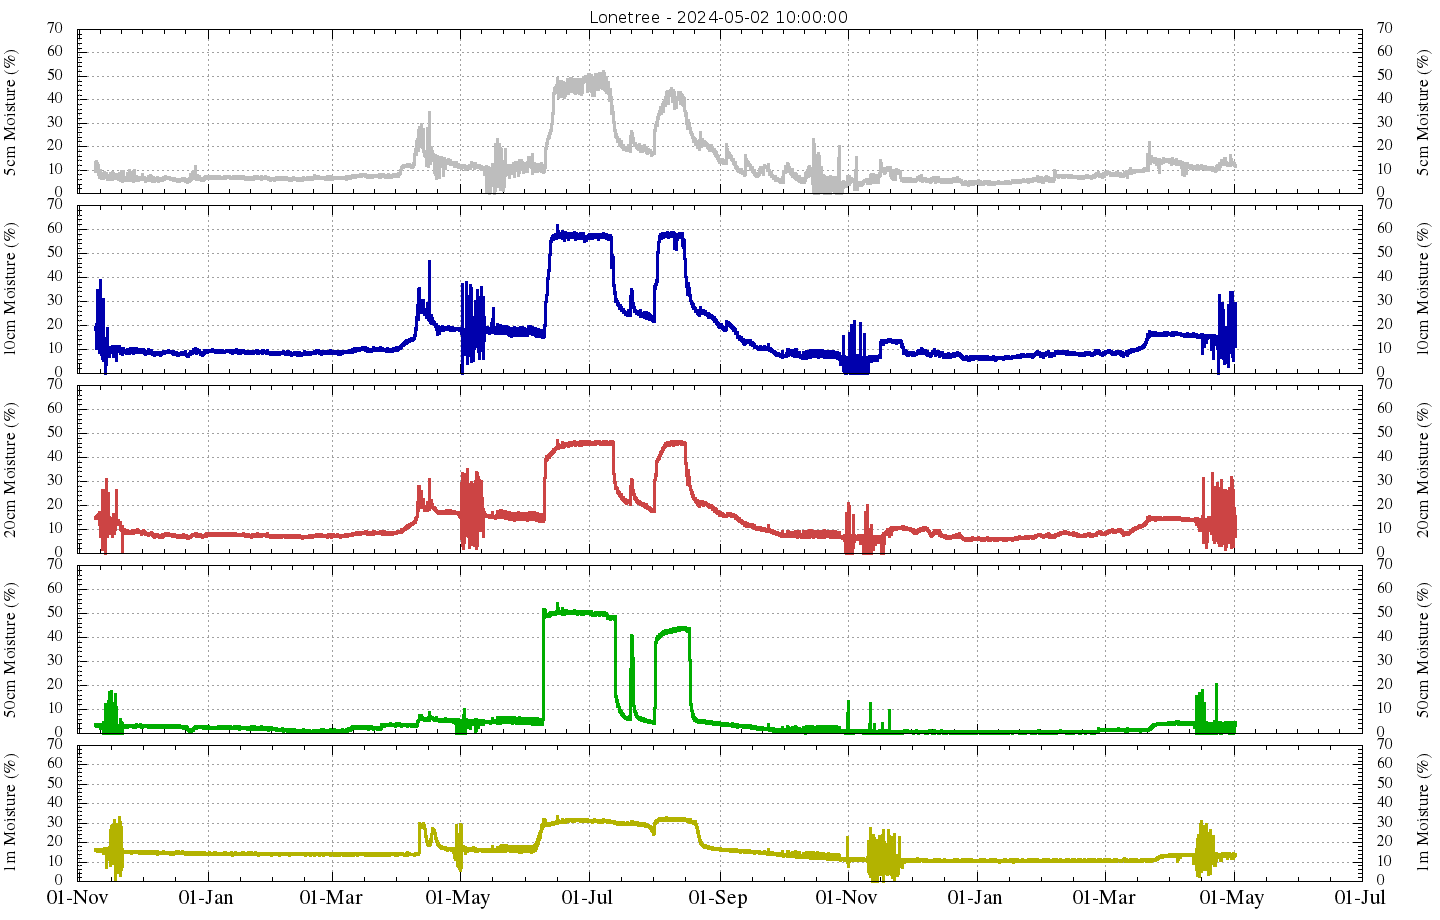
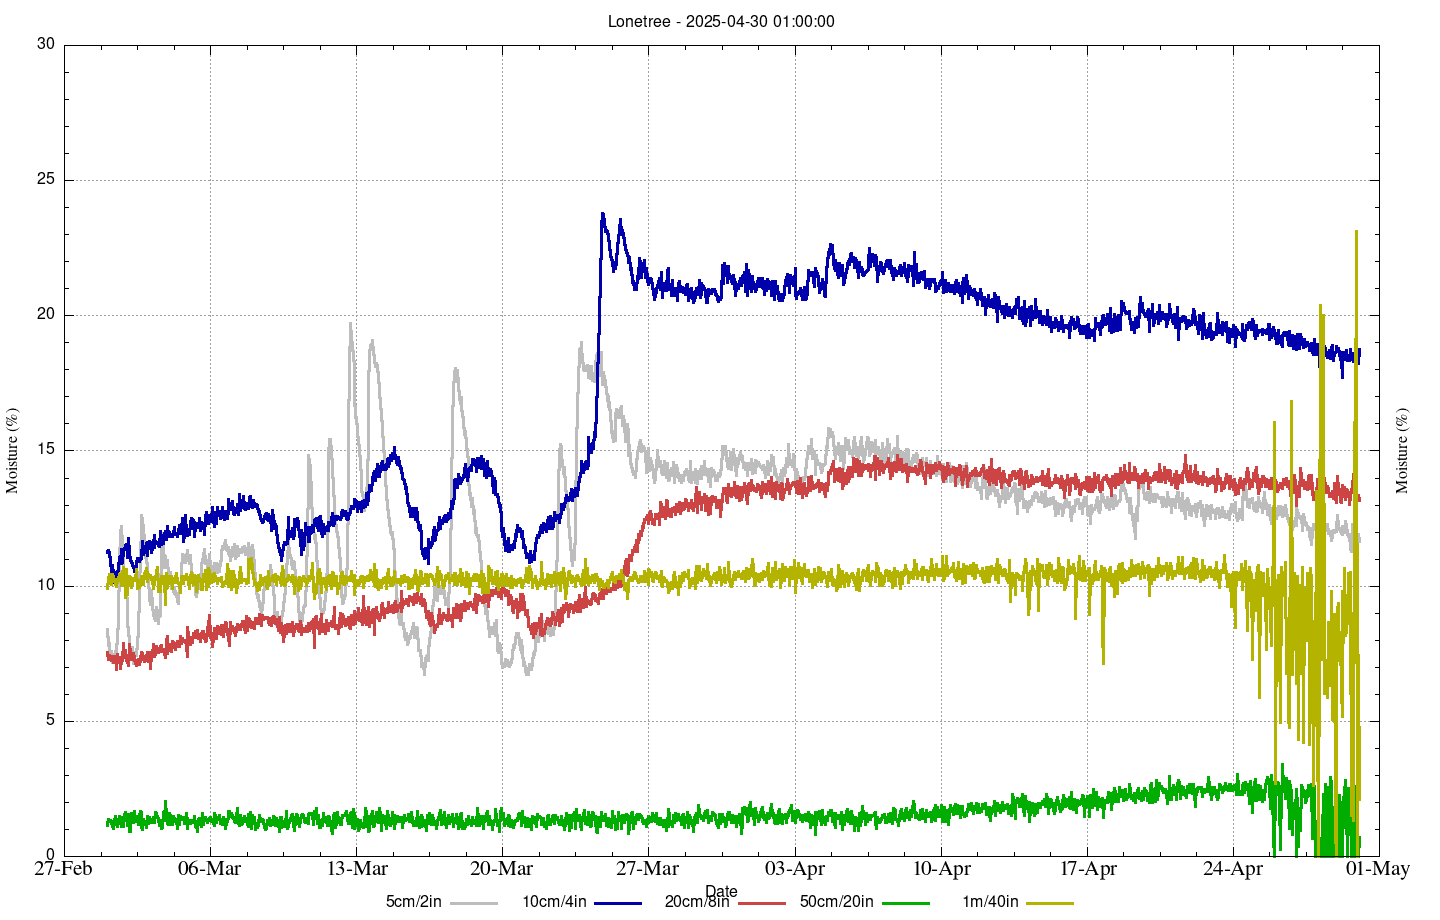
Soil Moisture
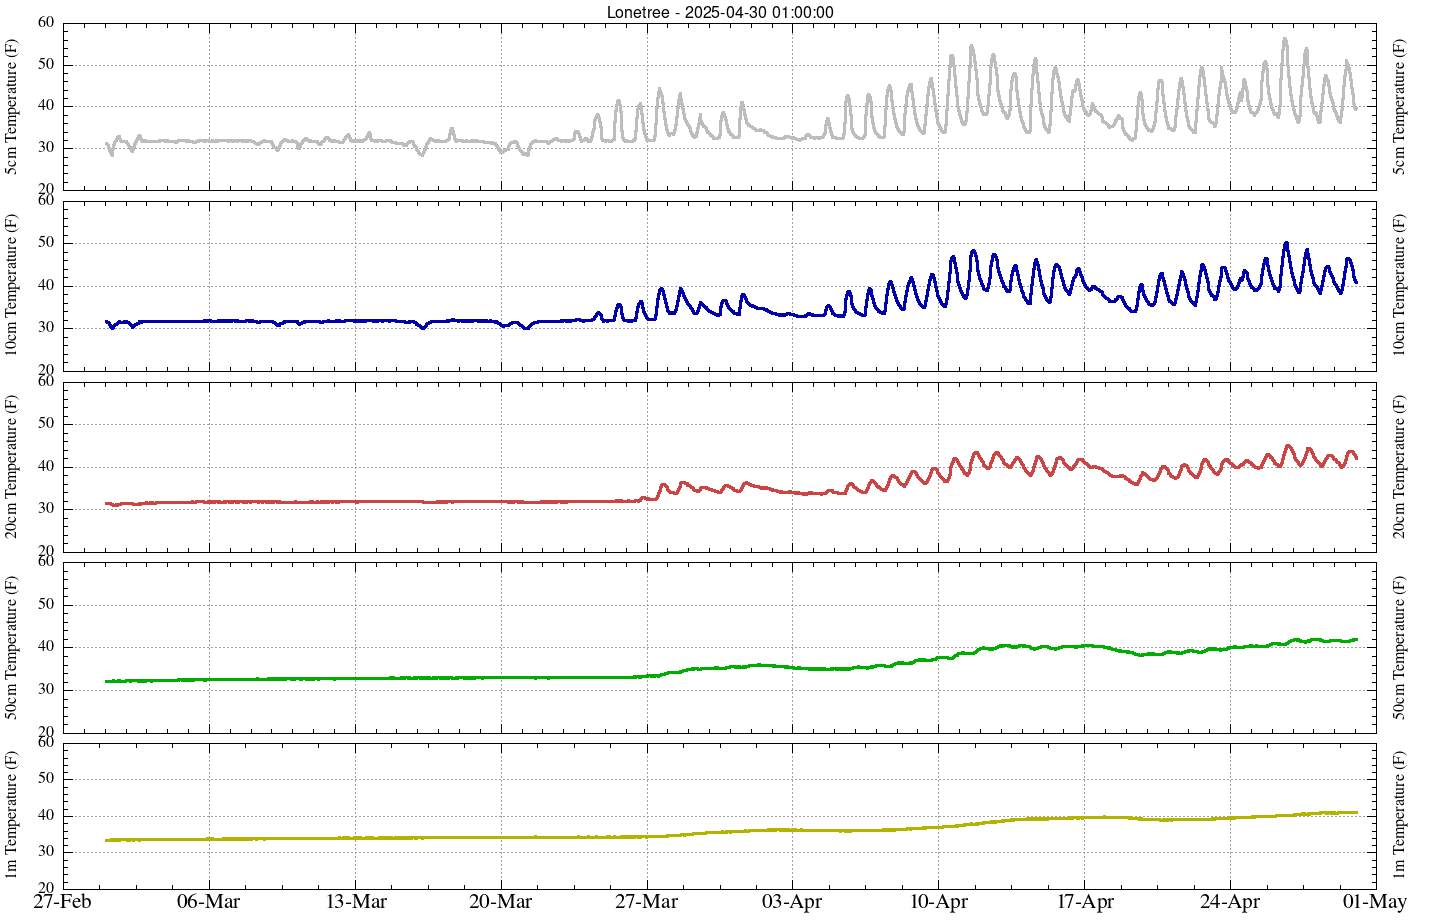
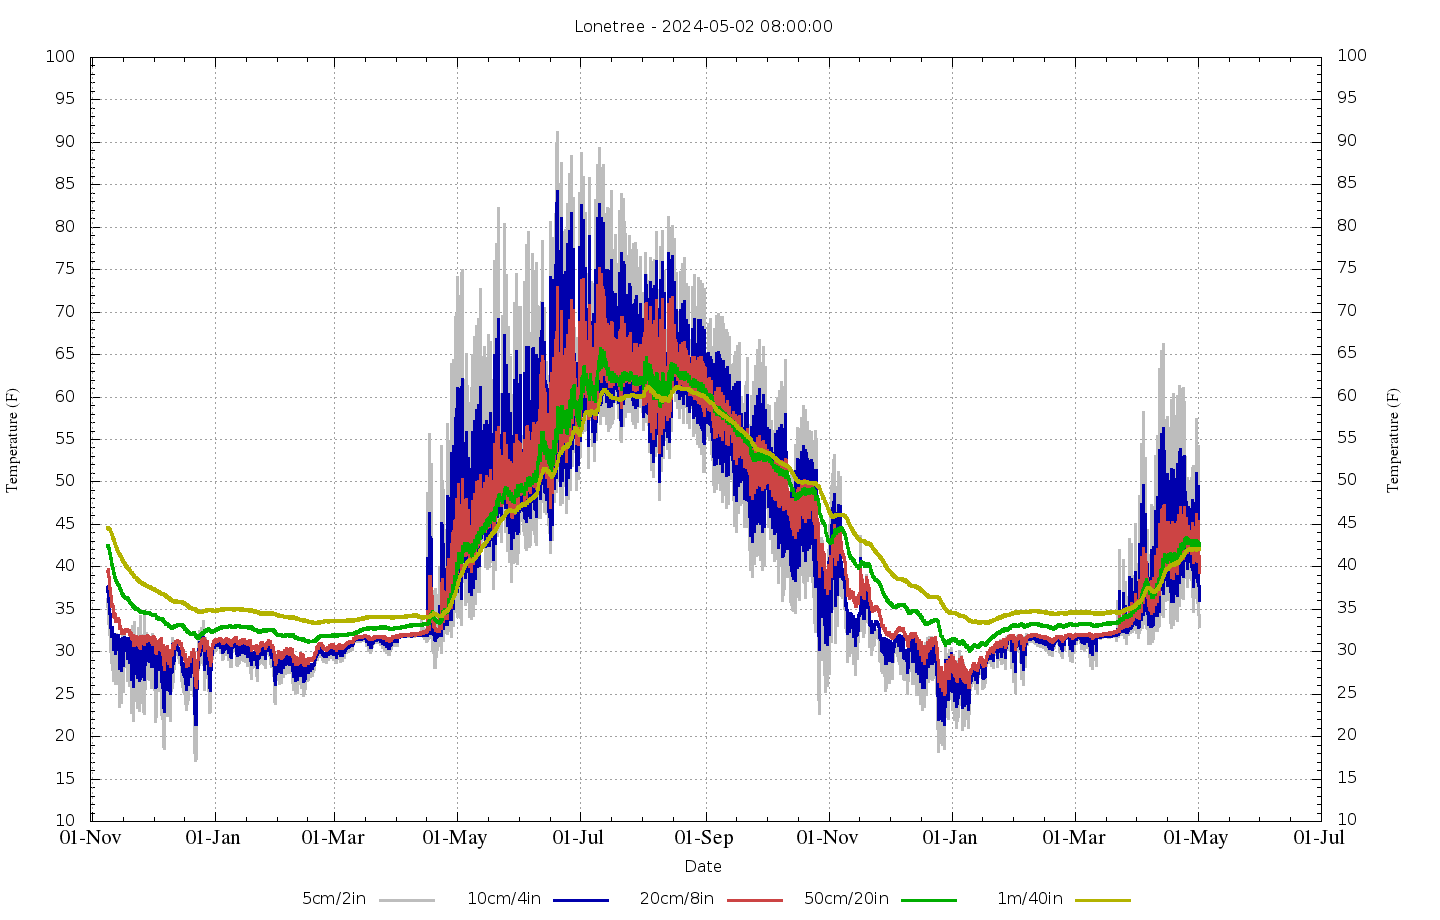
Soil Temperature
Hourly Charts for Last 30 Days | Daily Charts for Last 1000 days