Water Resources Data System & State Climate Office
Water Resources Data System & State Climate Office
Water Resources Data System & State Climate Office


Station Map | WACNet Home
Week at a Glance
| Date | TMax (F) | TMin (F) | TAvg (F) | SoilTemp (F) | Avg Vapor Pressure (kPa) | Avg Sat Vapor Pressure (kPa) | Avg RH (%) | Solar Rad (w/m^2) | Avg Wind Spd (mph) | Precipitation (") |
| 2026-04-01 | 51.30 | 36.53 | 44.01 | 57.92 | 0.53 | 0.99 | 55 | 99.20 | 8.91 | 0.00 |
| 2026-04-02 | 49.77 | 35.98 | 42.54 | 53.64 | 0.71 | 0.93 | 76 | 76.62 | 5.79 | 0.05 |
| 2026-04-03 | 69.26 | 27.22 | 47.41 | 52.07 | 0.71 | 1.22 | 70 | 161.10 | 4.64 | 0.01 |
| 2026-04-04 | 46.15 | 30.04 | 37.67 | 51.21 | 0.46 | 0.78 | 62 | 175.10 | 11.64 | 0.00 |
| 2026-04-05 | 59.34 | 26.74 | 43.09 | 50.14 | 0.50 | 1.01 | 59 | 238.10 | 6.32 | 0.00 |
| 2026-04-06 | 68.94 | 23.86 | 47.77 | 52.30 | 0.42 | 1.29 | 46 | 259.20 | 3.16 | 0.00 |
| 2026-04-07 | 57.81 | 28.95 | 44.09 | 54.41 | 0.48 | 1.02 | 51 | 238.80 | 6.21 | 0.00 |
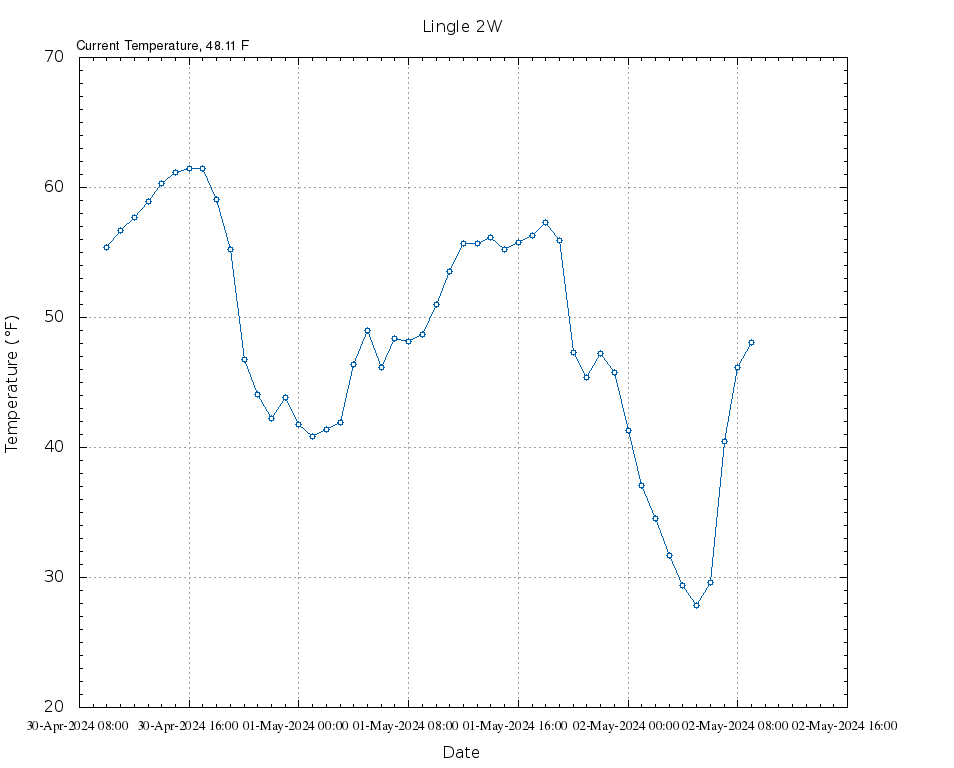
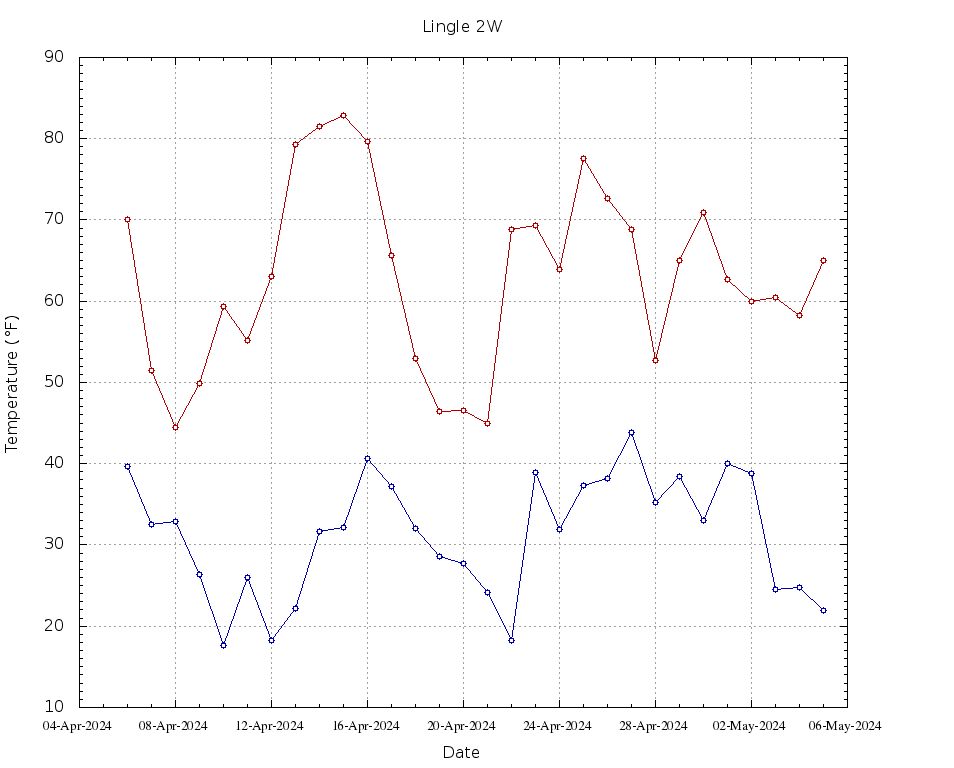
Hourly Charts for Last 30 Days | Daily Charts for Last 1000 days