Water Resources Data System & State Climate Office
Water Resources Data System & State Climate Office
Water Resources Data System & State Climate Office


Station Map | WACNet Home
Week at a Glance
| Date | TMax (F) | TMin (F) | TAvg (F) | SoilTemp (F) | Avg Vapor Pressure (kPa) | Avg Sat Vapor Pressure (kPa) | Avg RH (%) | Solar Rad (w/m^2) | Avg Wind Spd (mph) | Precipitation (") |
| 2026-03-20 | 75.79 | 3678.80 | 3678.80 | 3678.80 | 0.00 | 0.95 | 327 | 5.92 | 49.90 | 0.00 |
| 2026-03-21 | 76.59 | 3678.80 | 3678.80 | 3678.80 | 0.00 | 0.91 | 334 | 5.25 | 50.32 | 0.00 |
| 2026-03-22 | 75.40 | 3678.80 | 3678.80 | 3678.80 | 0.00 | 1.05 | 325 | 7.25 | 45.70 | 0.00 |
| 2026-03-23 | 74.79 | 3678.80 | 3678.80 | 3678.80 | 0.00 | 0.97 | 304 | 5.24 | 48.10 | 0.00 |
| 2026-03-24 | 74.48 | 3678.80 | 3678.80 | 3678.80 | 0.00 | 1.06 | 299 | 7.78 | 31.62 | 0.00 |
| 2026-03-25 | 77.29 | 3678.80 | 3678.80 | 3678.80 | 0.00 | 1.30 | 336 | 10.79 | 43.91 | 0.00 |
| 2026-03-26 | 78.03 | 3678.80 | 3678.80 | 3678.80 | 0.00 | 1.20 | 354 | 9.22 | 51.49 | 0.00 |
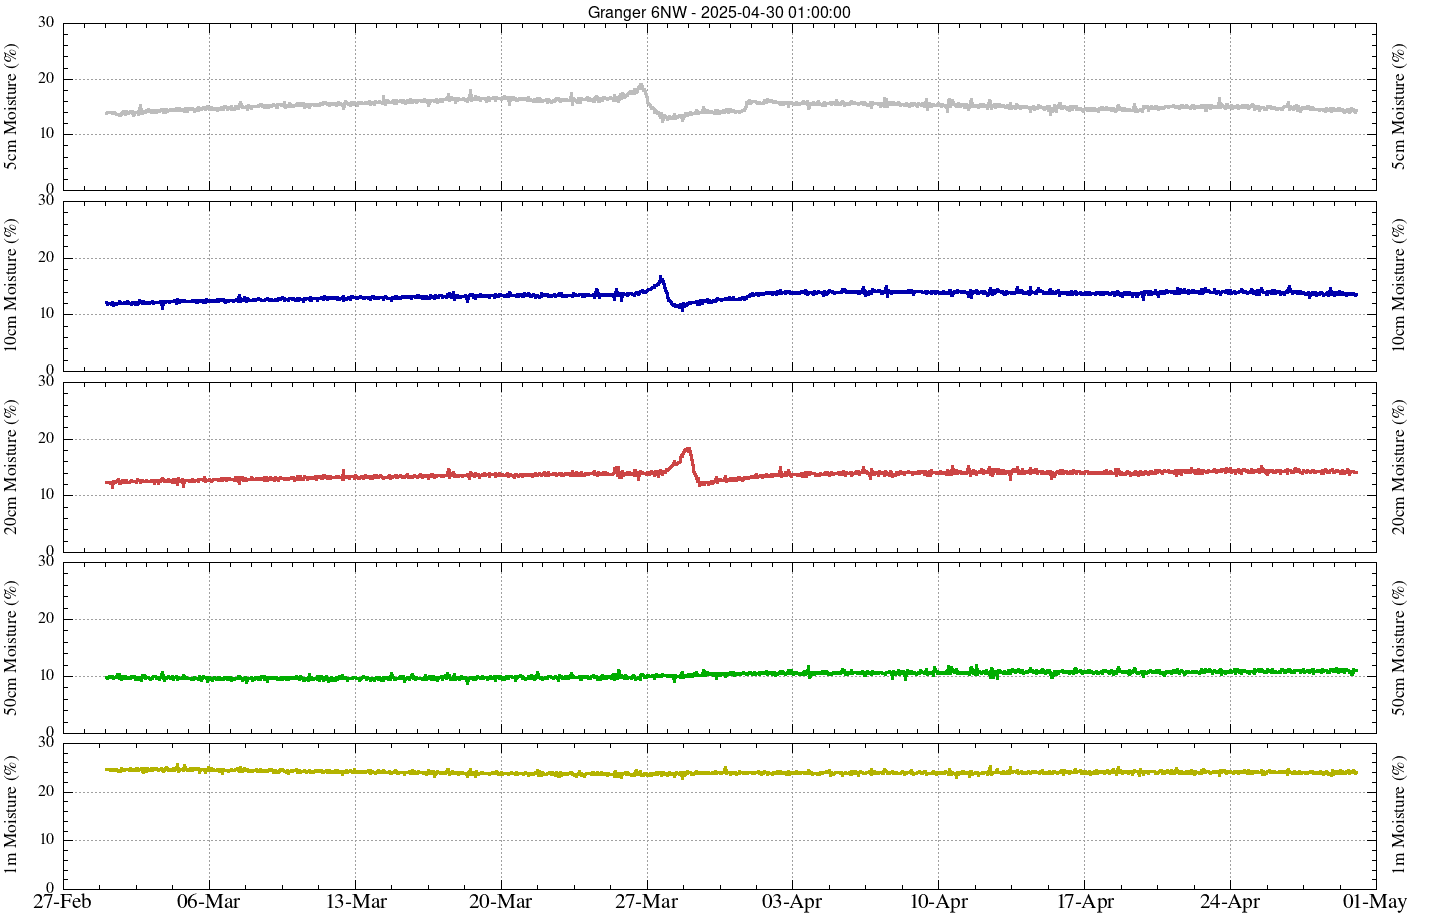
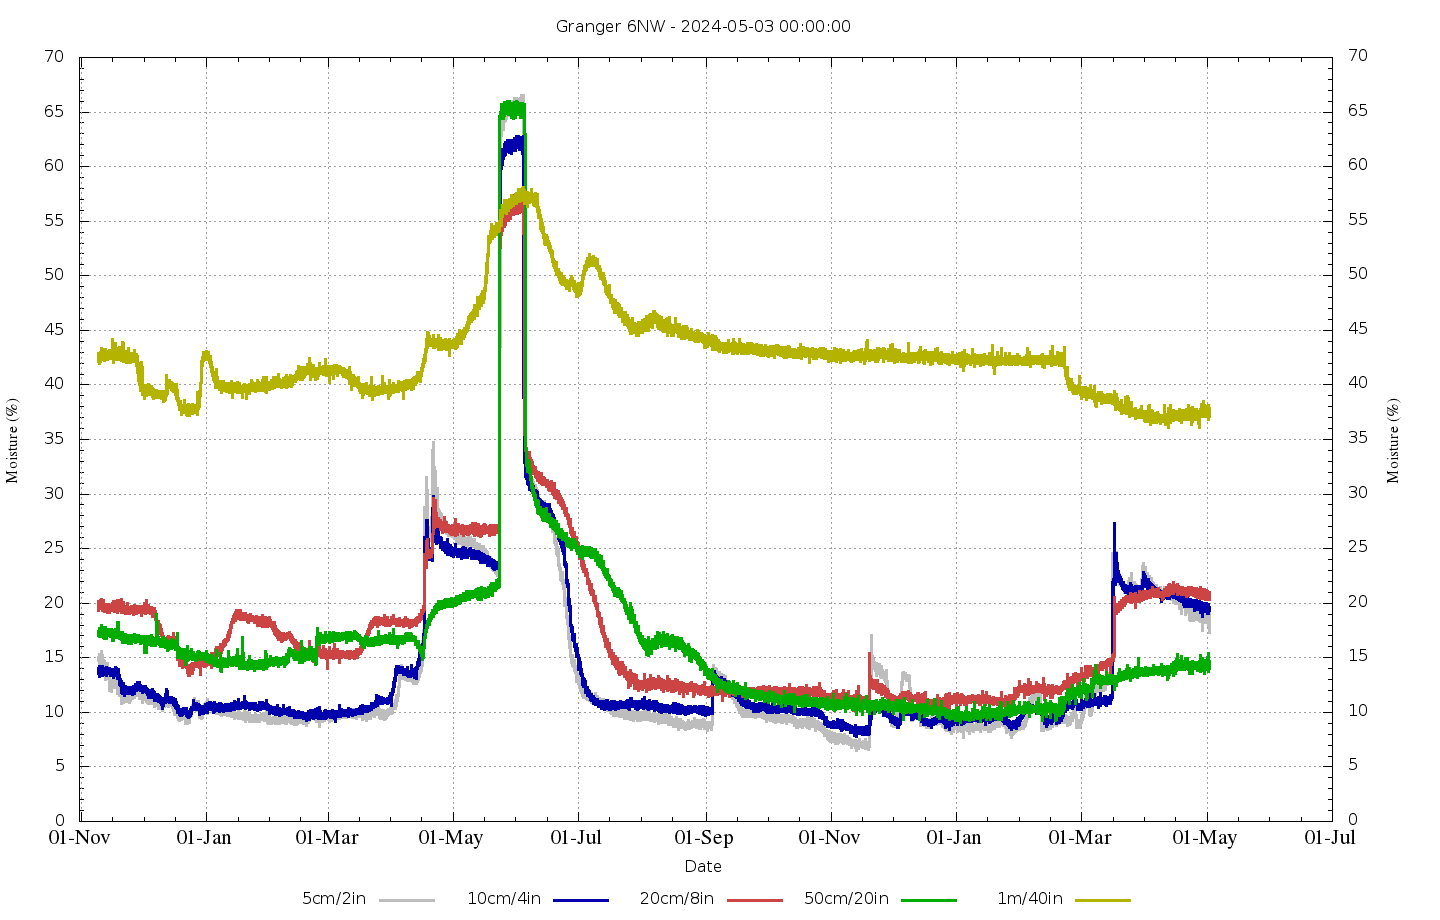
Soil Moisture
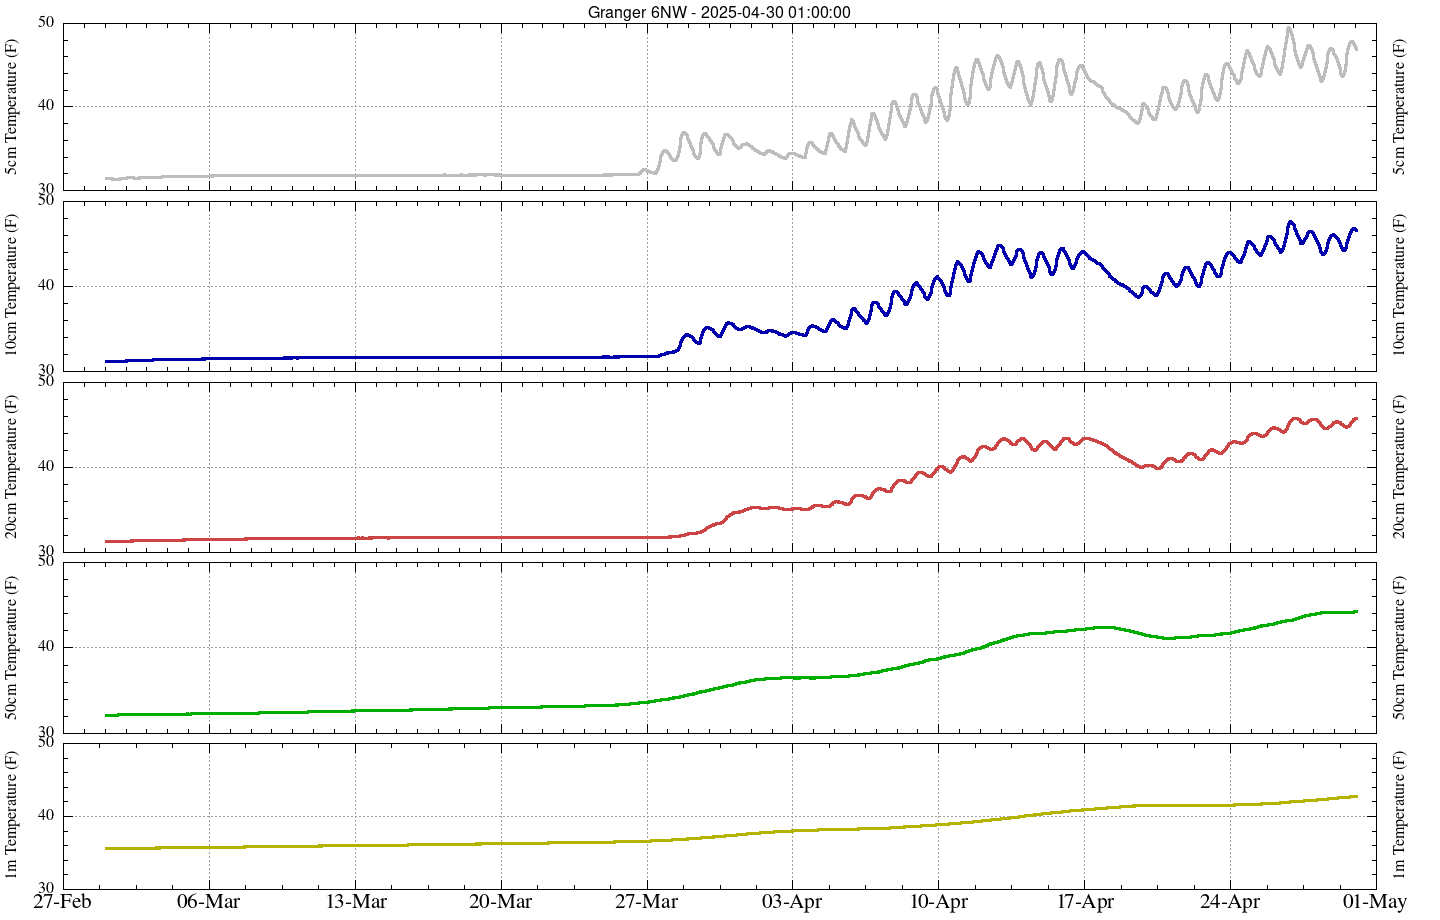
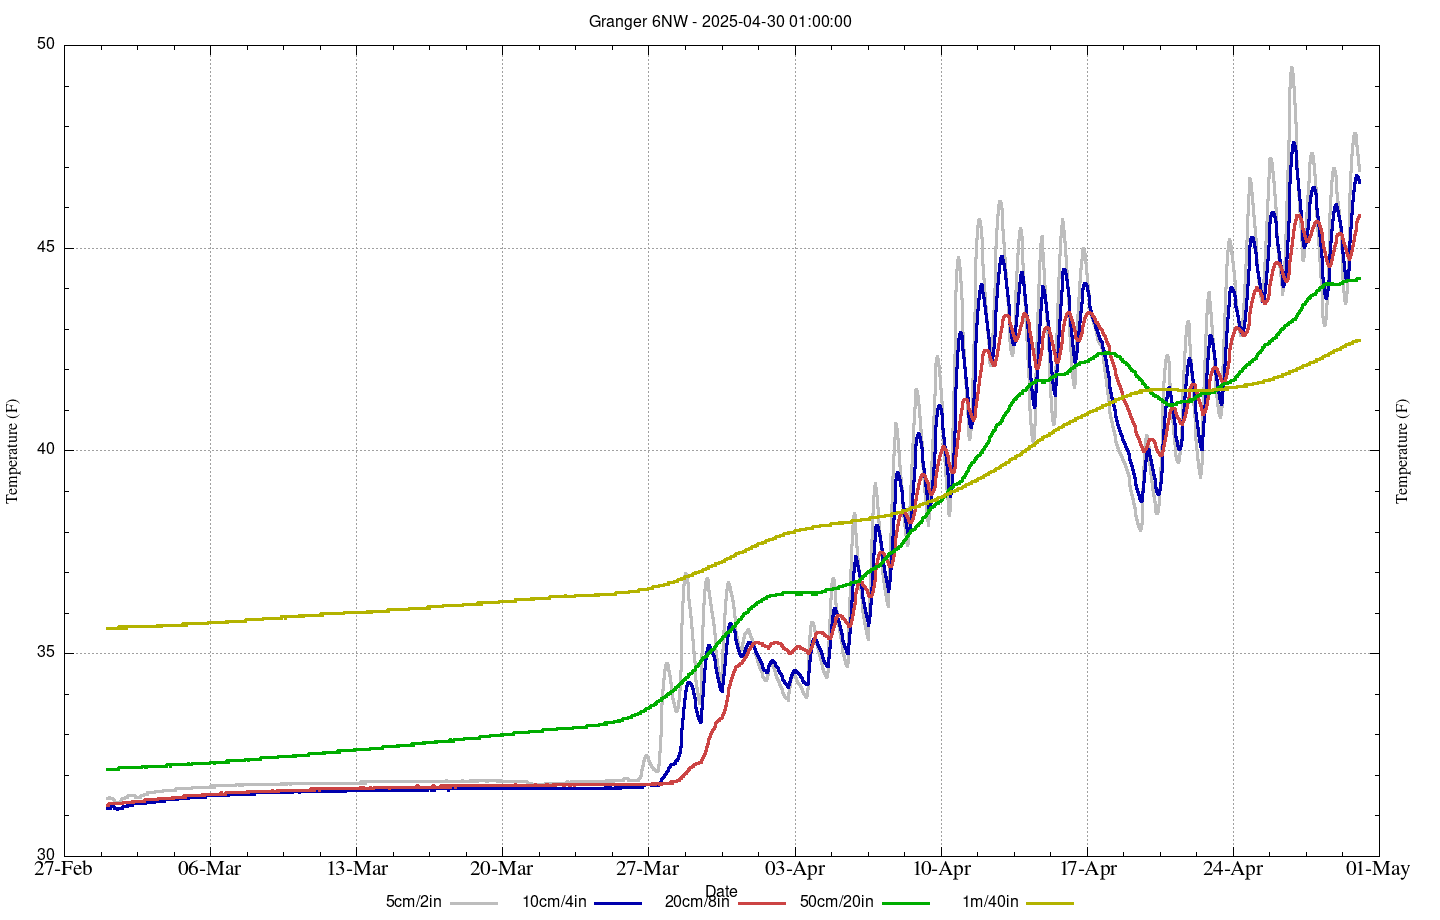
Soil Temperature
Hourly Charts for Last 30 Days | Daily Charts for Last 1000 days