Water Resources Data System & State Climate Office
Water Resources Data System & State Climate Office
Water Resources Data System & State Climate Office


Station Map | WACNet Home
Week at a Glance
| Date | TMax (F) | TMin (F) | TAvg (F) | SoilTemp (F) | Avg Vapor Pressure (kPa) | Avg Sat Vapor Pressure (kPa) | Avg RH (%) | Solar Rad (w/m^2) | Avg Wind Spd (mph) | Precipitation (") |
| 2026-03-26 | 76.93 | 30.27 | 58.24 | 48.94 | 0.48 | 1.81 | 32 | 255.20 | 8.21 | 0.00 |
| 2026-03-27 | 70.09 | 29.90 | 51.28 | 50.25 | 0.49 | 1.41 | 45 | 215.60 | 8.59 | 0.00 |
| 2026-03-28 | 63.07 | 19.34 | 40.36 | 49.28 | 0.34 | 0.96 | 48 | 246.90 | 3.57 | 0.00 |
| 2026-03-29 | 69.06 | 29.72 | 53.80 | 49.41 | 0.37 | 1.53 | 28 | 228.60 | 9.39 | 0.00 |
| 2026-03-30 | 68.56 | 32.29 | 52.36 | 50.58 | 0.41 | 1.44 | 35 | 247.30 | 7.44 | 0.00 |
| 2026-03-31 | 69.40 | 30.27 | 50.52 | 50.79 | 0.40 | 1.37 | 35 | 248.60 | 7.39 | 0.00 |
| 2026-04-01 | 59.40 | 27.33 | 46.06 | 50.16 | 0.47 | 1.11 | 45 | 138.00 | 4.14 | 0.00 |
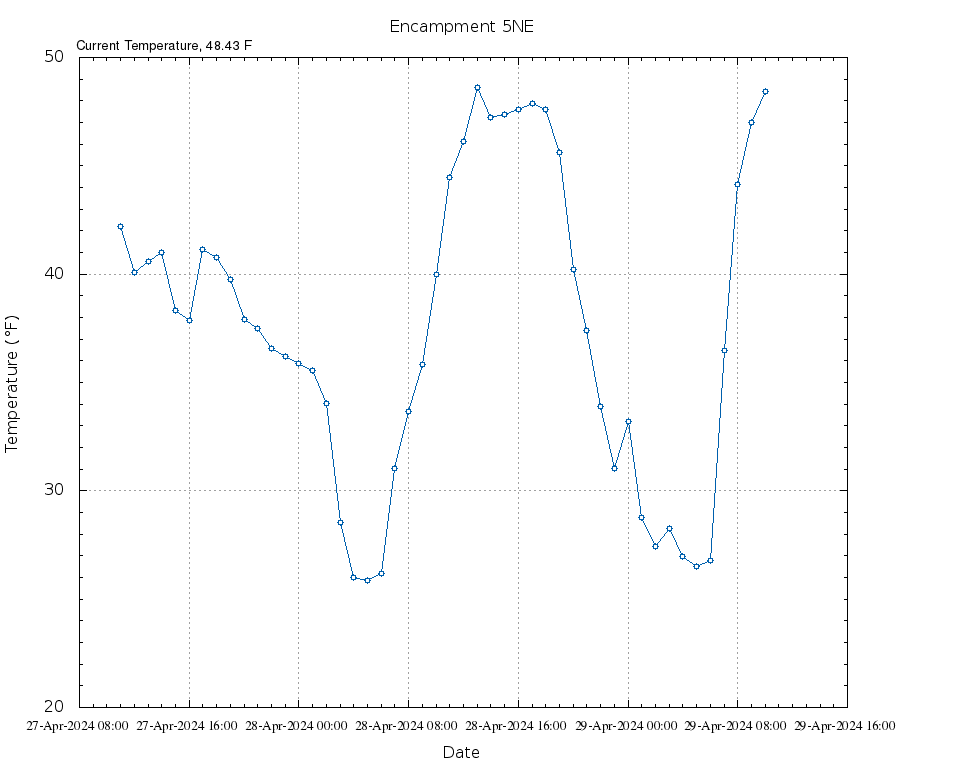
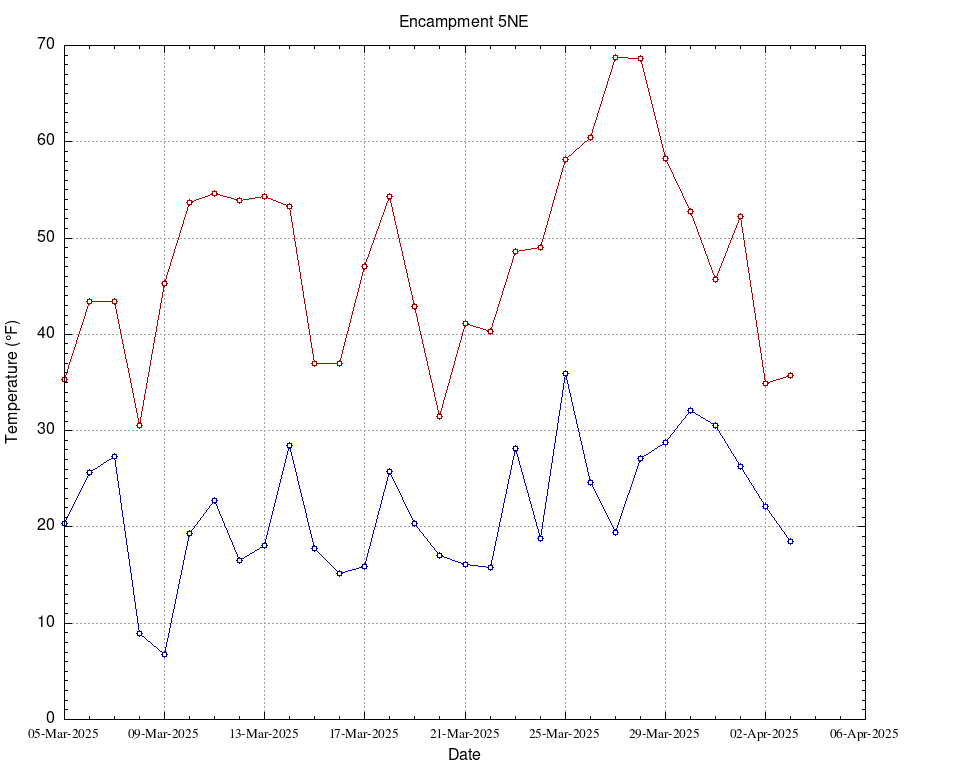
Hourly Charts for Last 30 Days | Daily Charts for Last 1000 days