Water Resources Data System & State Climate Office
Water Resources Data System & State Climate Office
Water Resources Data System & State Climate Office


Station Map | WACNet Home
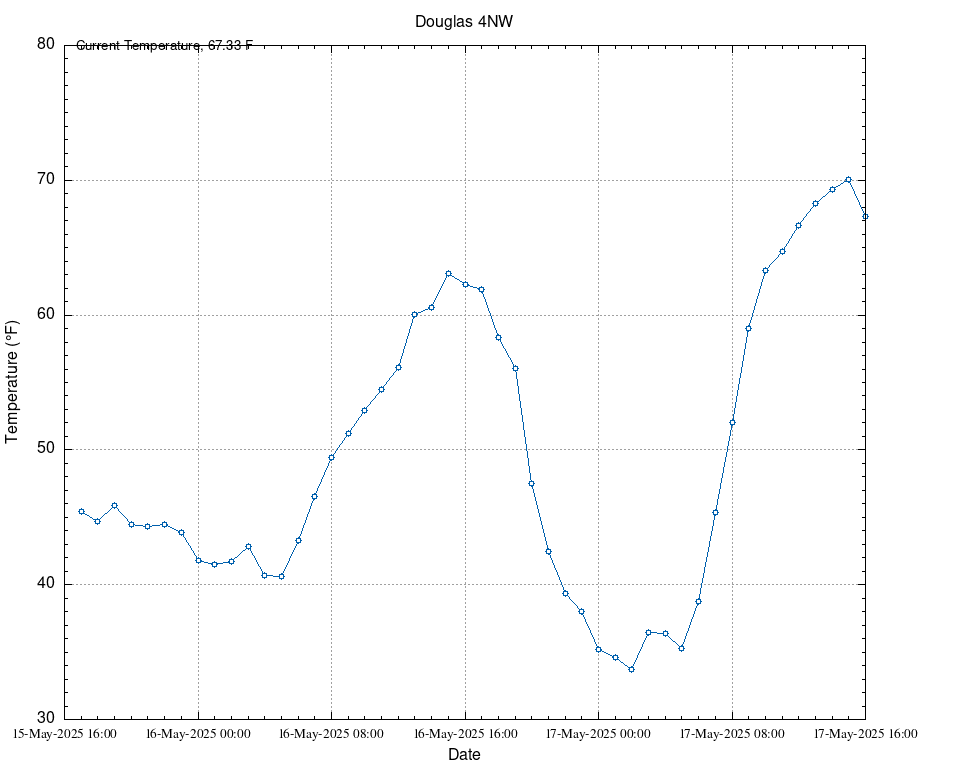
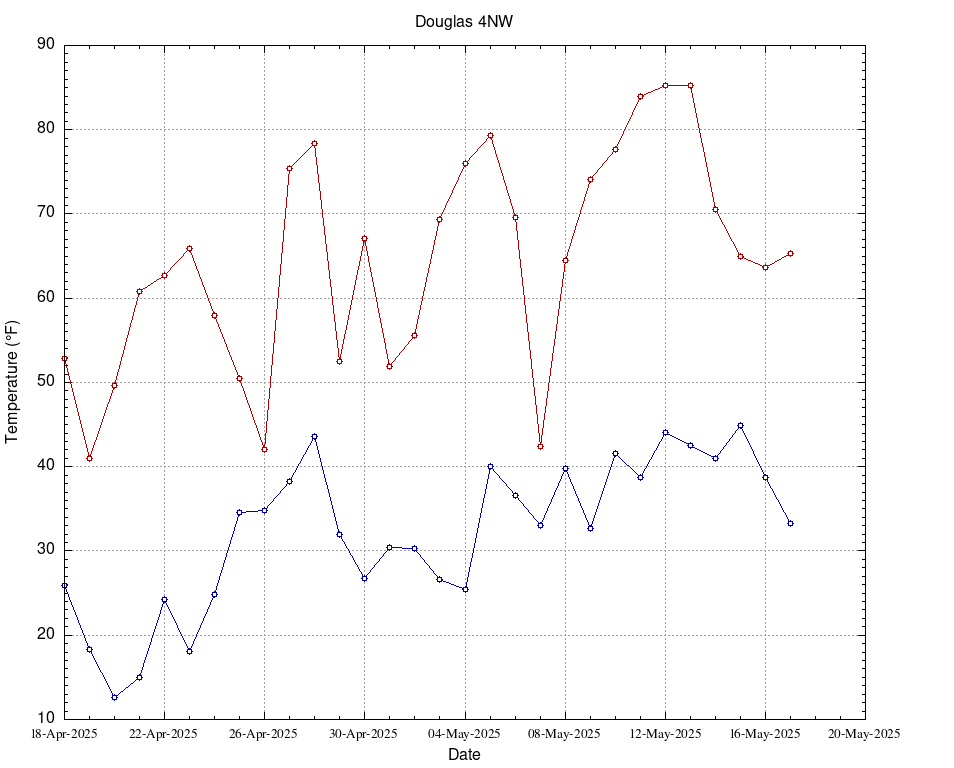
Week at a Glance
| Date | TMax (F) | TMin (F) | TAvg (F) | SoilTemp (F) | Avg Vapor Pressure (kPa) | Avg Sat Vapor Pressure (kPa) | Avg RH (%) | Solar Rad (w/m^2) | Avg Wind Spd (mph) | Precipitation (") |
| 2026-03-20 | 83.25 | 26.65 | 56.01 | 44.57 | 0.37 | 1.85 | 31 | 242.70 | 8.06 | 0.00 |
| 2026-03-21 | 82.51 | 26.41 | 55.00 | 45.53 | 0.37 | 1.81 | 33 | 235.70 | 7.92 | 0.00 |
| 2026-03-22 | 85.44 | 25.73 | 57.54 | 47.01 | 0.46 | 1.99 | 36 | 235.30 | 8.60 | 0.00 |
| 2026-03-23 | 65.08 | 37.60 | 47.32 | 48.99 | 0.60 | 1.15 | 56 | 233.30 | 3.84 | 0.00 |
| 2026-03-24 | 69.19 | 34.60 | 49.95 | 49.01 | 0.57 | 1.31 | 50 | 215.70 | 3.19 | 0.00 |
| 2026-03-25 | 78.48 | 31.53 | 55.20 | 49.32 | 0.56 | 1.70 | 42 | 202.10 | 7.41 | 0.00 |
| 2026-03-26 | 85.69 | 36.56 | 64.15 | 50.70 | 0.51 | 2.31 | 32 | 250.00 | 10.20 | 0.00 |
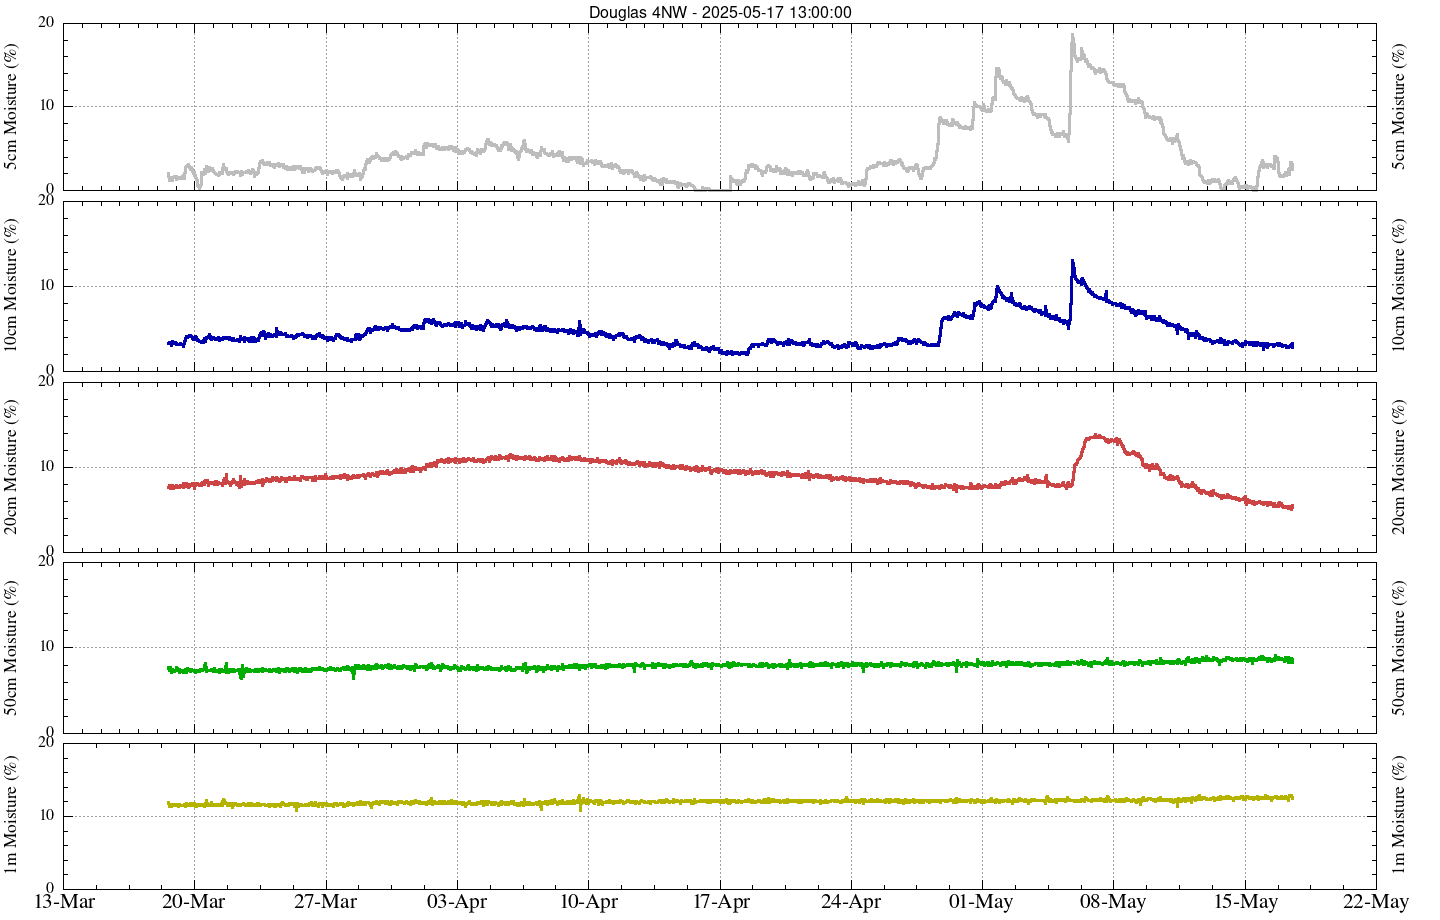
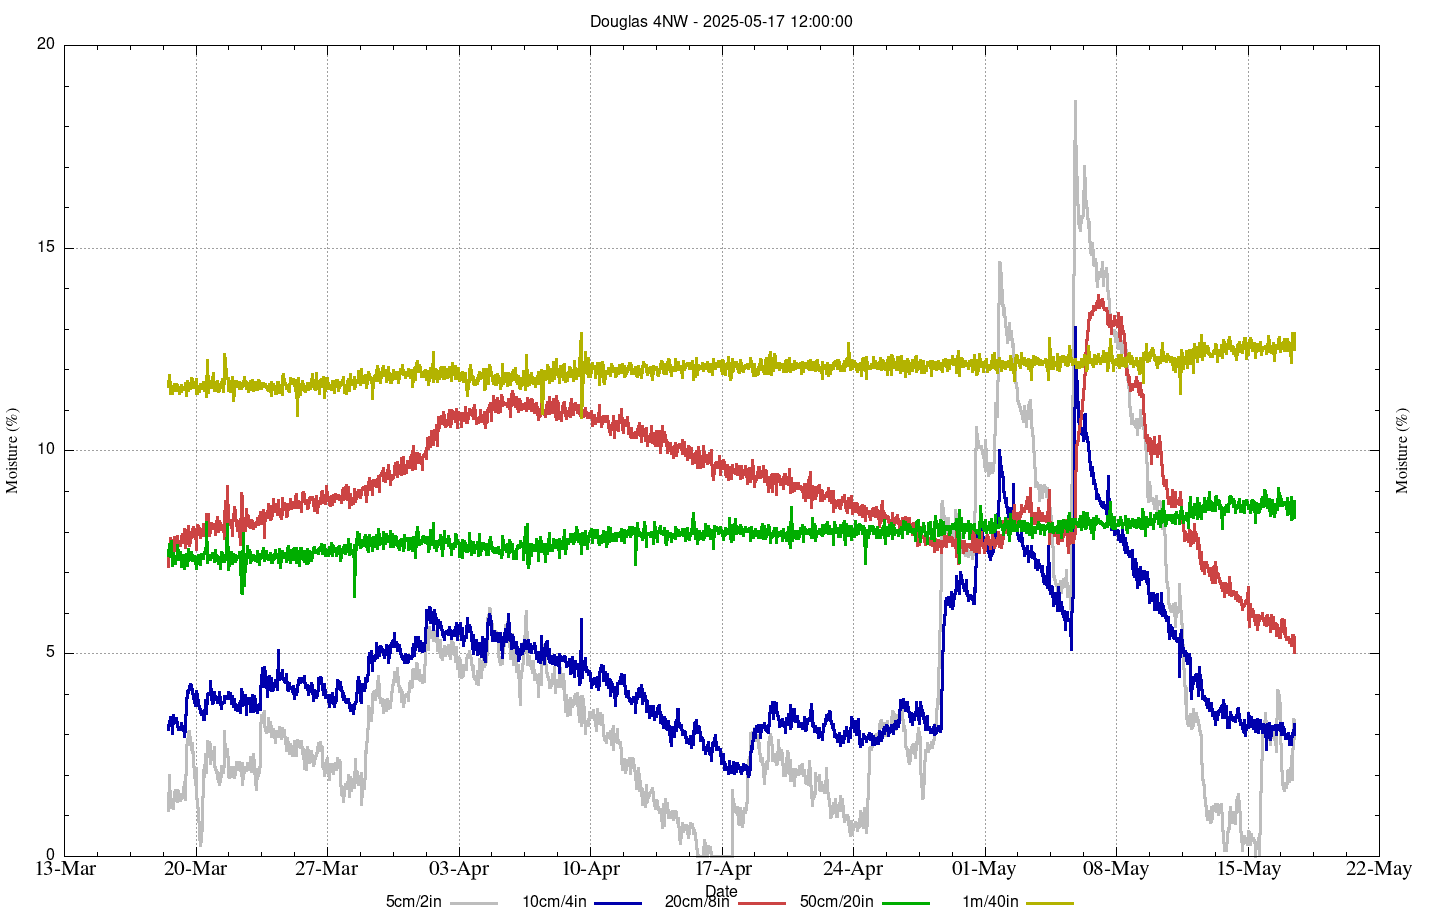
Soil Moisture
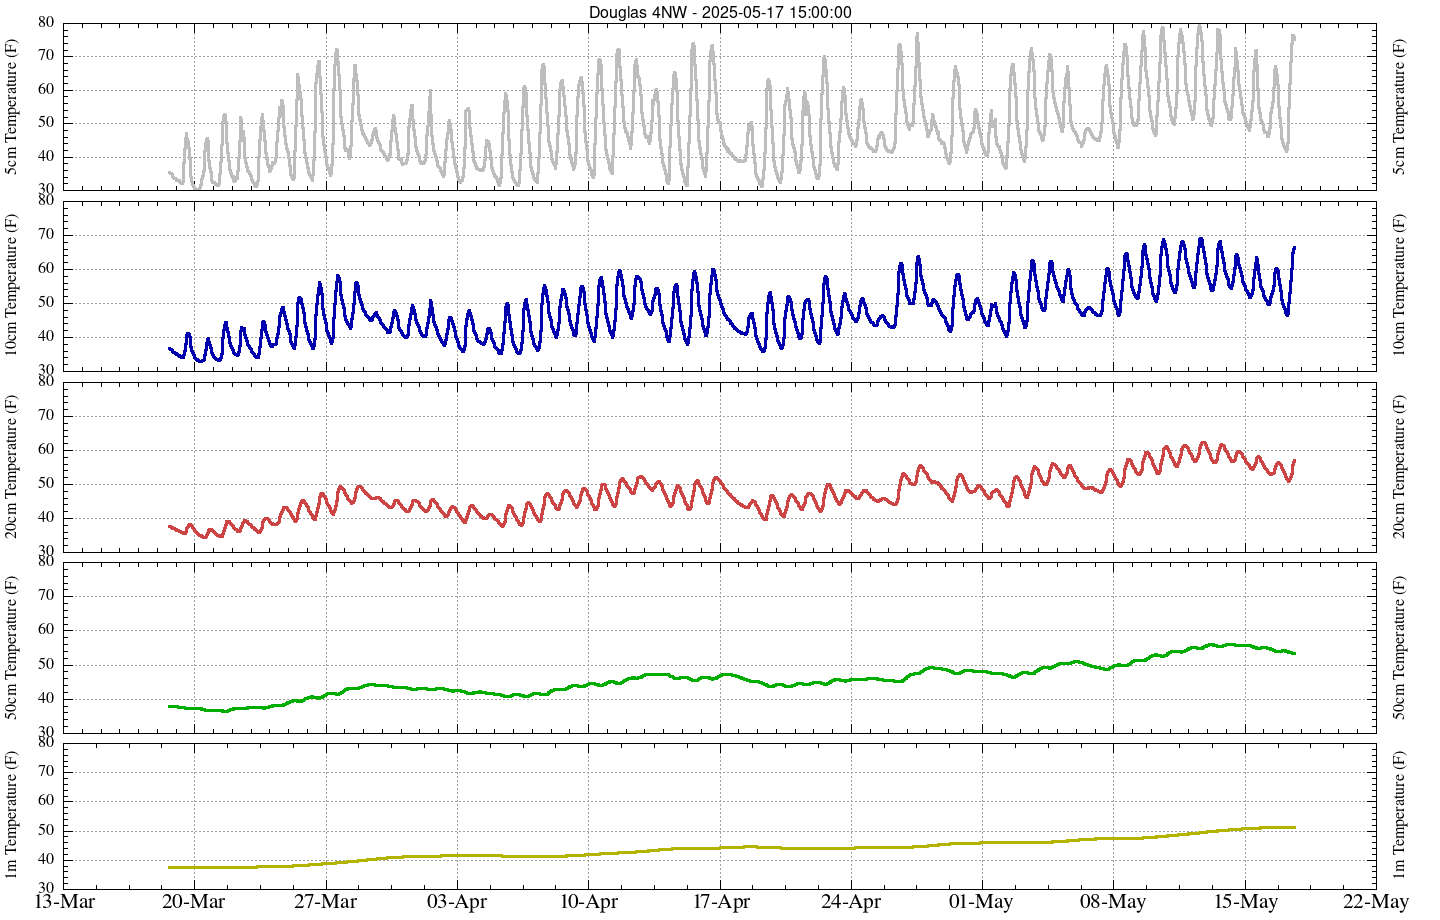
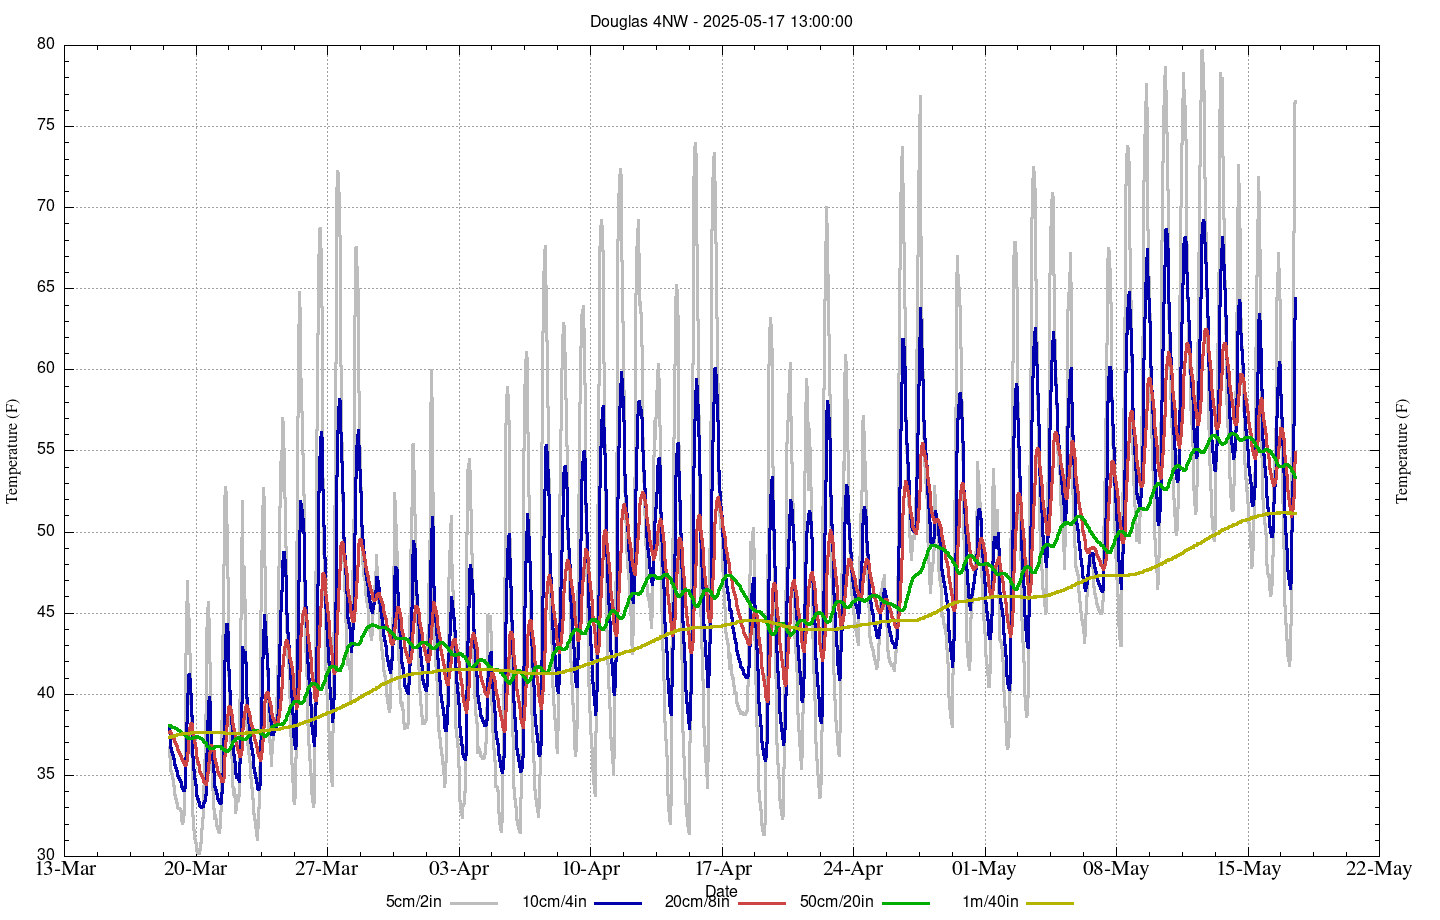
Soil Temperature
Hourly Charts for Last 30 Days | Daily Charts for Last 1000 days