Water Resources Data System & State Climate Office
Water Resources Data System & State Climate Office
Water Resources Data System & State Climate Office


Station Map | WACNet Home
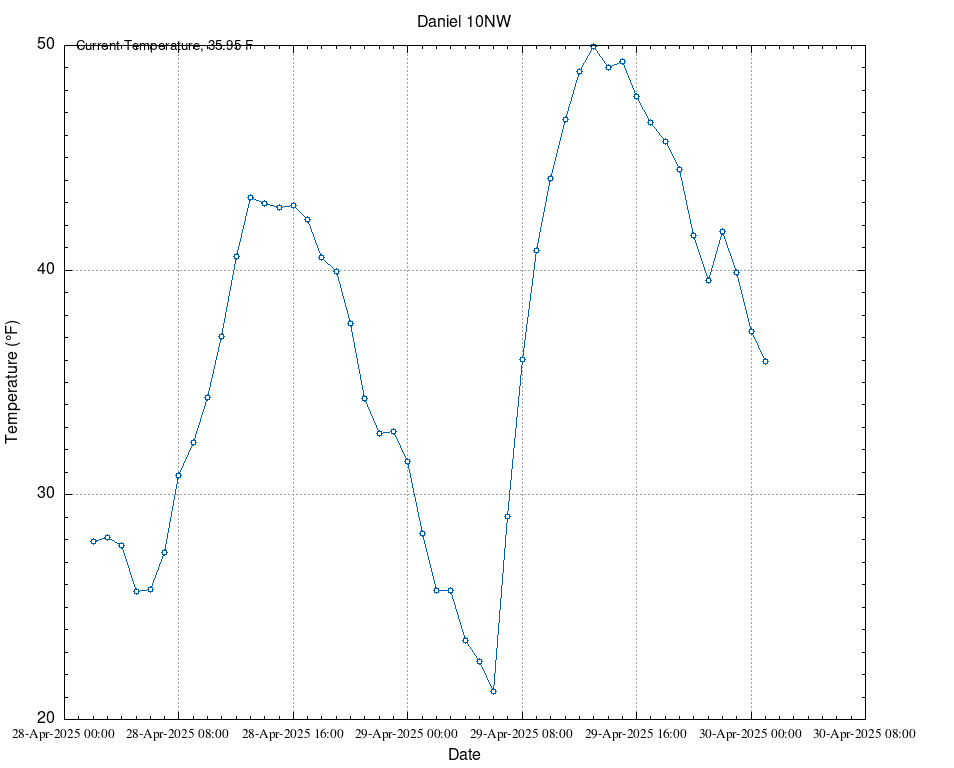
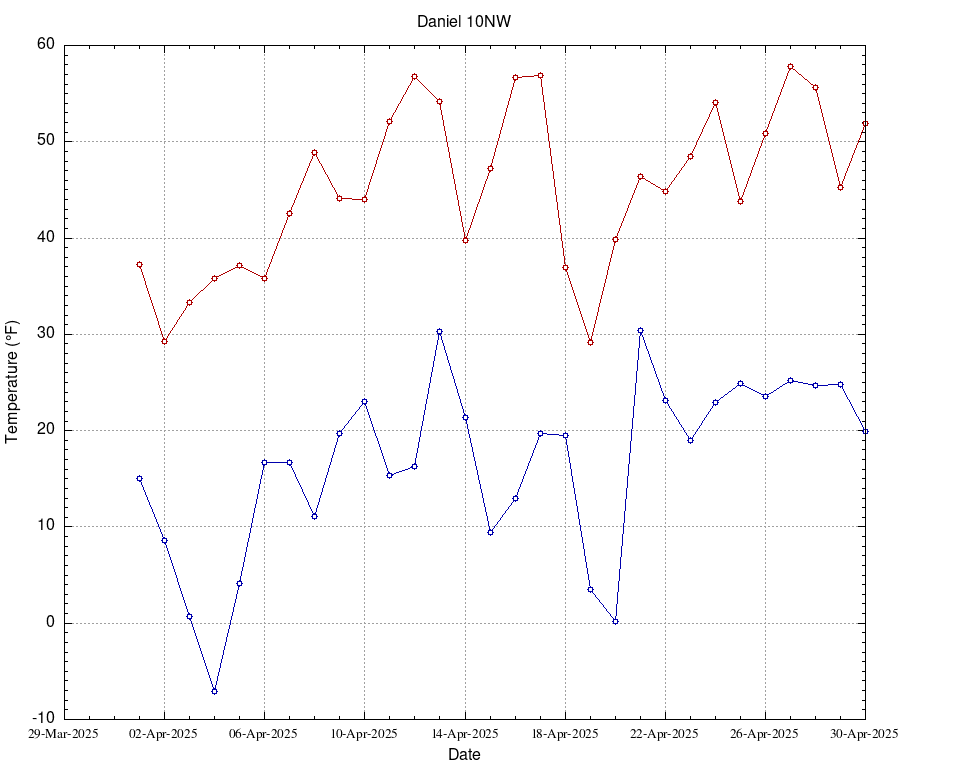
Week at a Glance
| Date | TMax (F) | TMin (F) | TAvg (F) | SoilTemp (F) | Avg Vapor Pressure (kPa) | Avg Sat Vapor Pressure (kPa) | Avg RH (%) | Solar Rad (w/m^2) | Avg Wind Spd (mph) | Precipitation (") |
| 2026-01-20 | 27.29 | -8.18 | 12.06 | 32.00 | 0.17 | 0.29 | 64 | 114.60 | 4.99 | 0.00 |
| 2026-01-21 | 29.99 | -0.09 | 16.84 | 32.00 | 0.20 | 0.34 | 63 | 100.90 | 6.25 | 0.00 |
| 2026-01-22 | 32.58 | -8.54 | 13.24 | 32.00 | 0.17 | 0.31 | 60 | 116.60 | 3.73 | 0.00 |
| 2026-01-23 | 33.18 | -7.19 | 10.63 | 32.00 | 0.15 | 0.28 | 62 | 111.00 | 3.58 | 0.00 |
| 2026-01-24 | 19.54 | -10.03 | 6.04 | 32.00 | 0.15 | 0.21 | 75 | 91.70 | 2.74 | 0.00 |
| 2026-01-25 | 16.72 | -22.02 | -1.82 | 32.00 | 0.10 | 0.16 | 70 | 118.20 | 6.00 | 0.00 |
| 2026-01-26 | 13.89 | -15.48 | 1.40 | 32.00 | 0.11 | 0.17 | 65 | 121.20 | 7.30 | 0.00 |
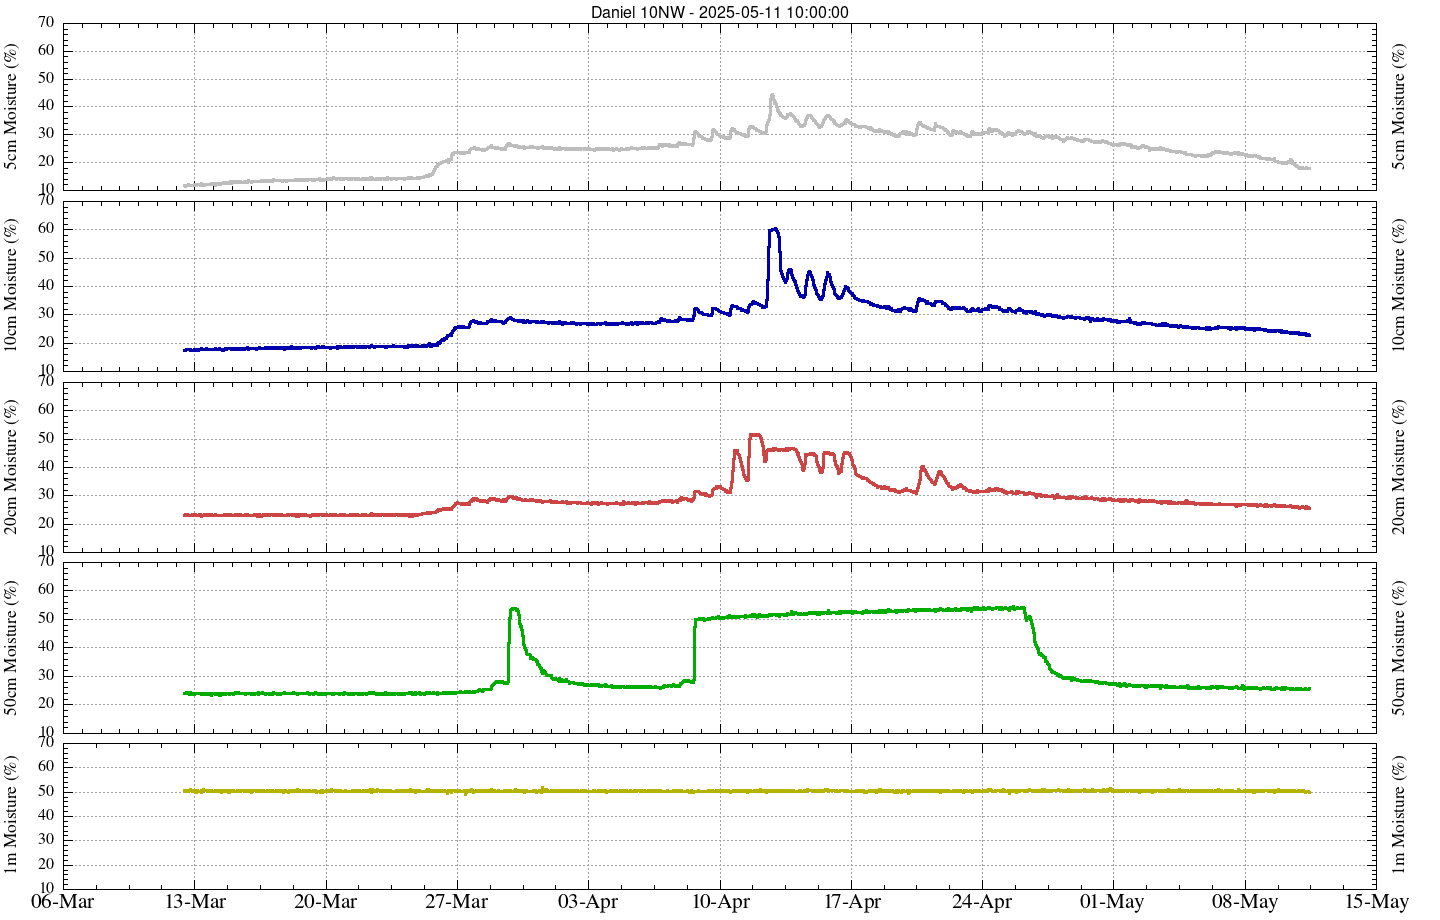
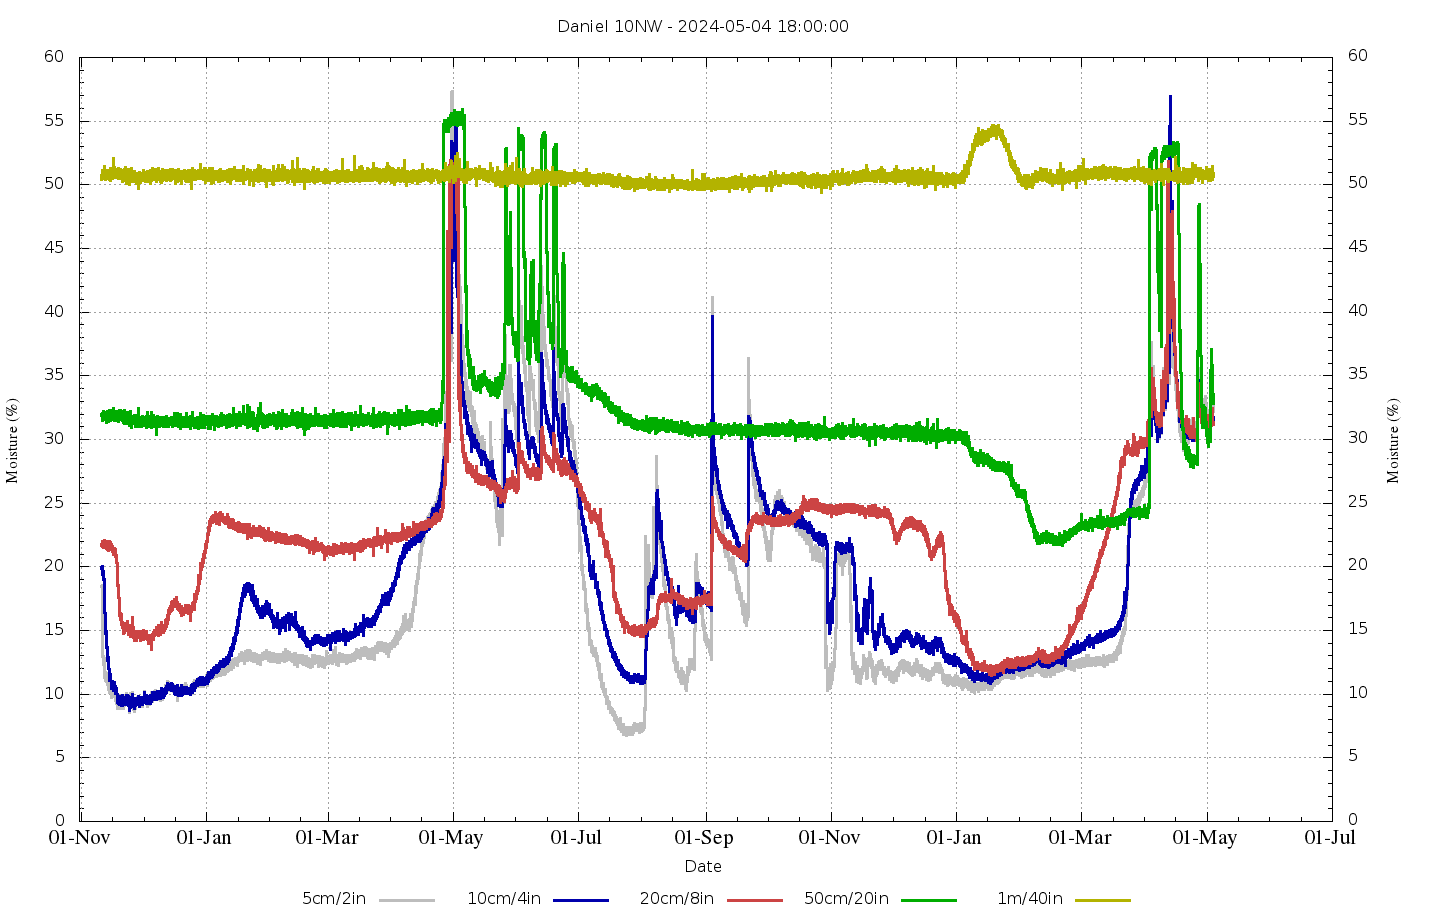
Soil Moisture
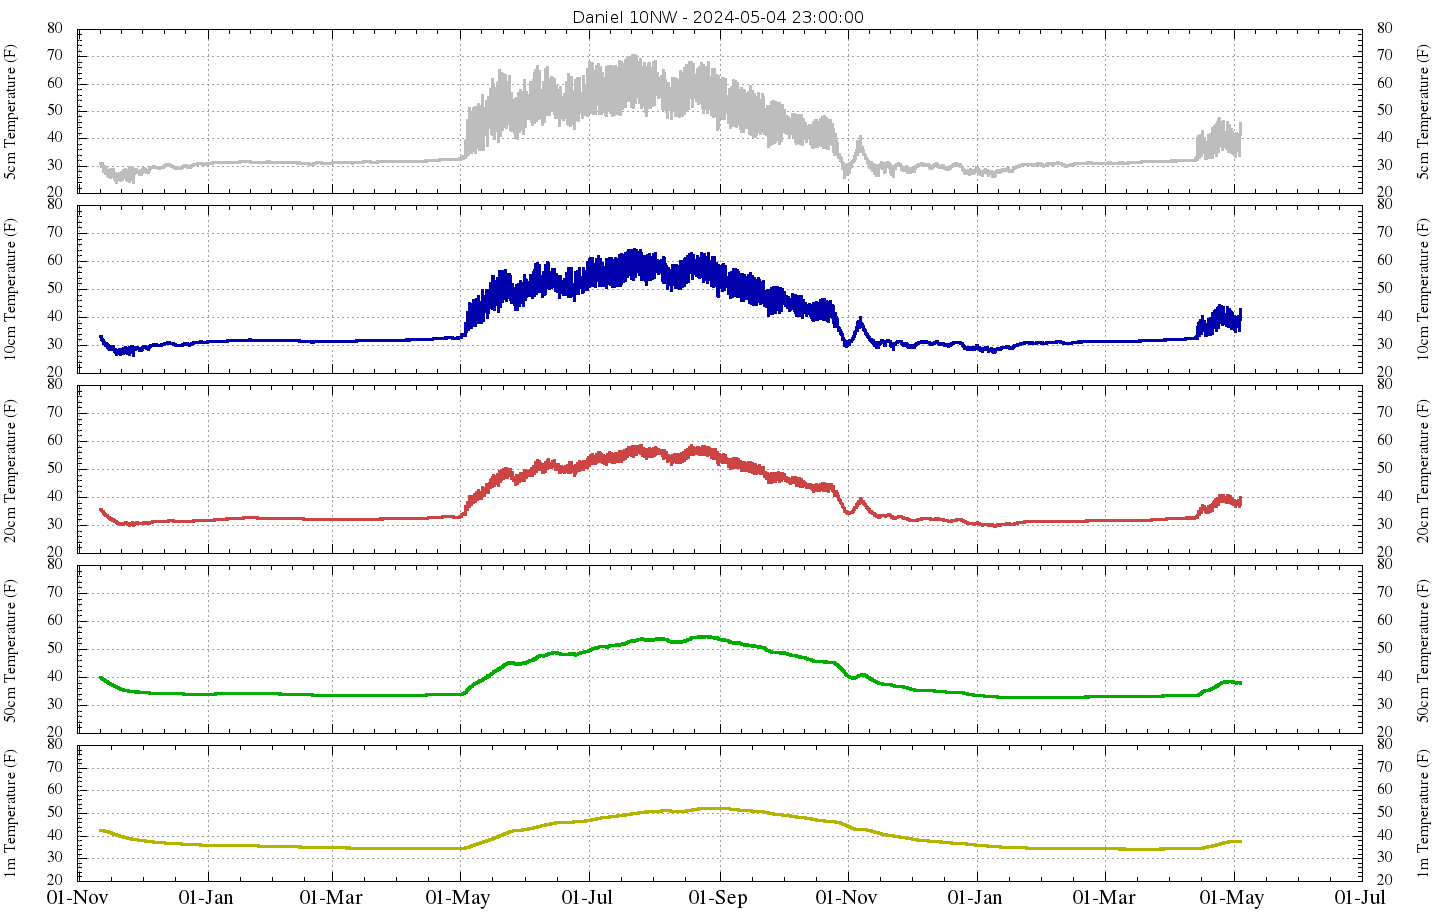
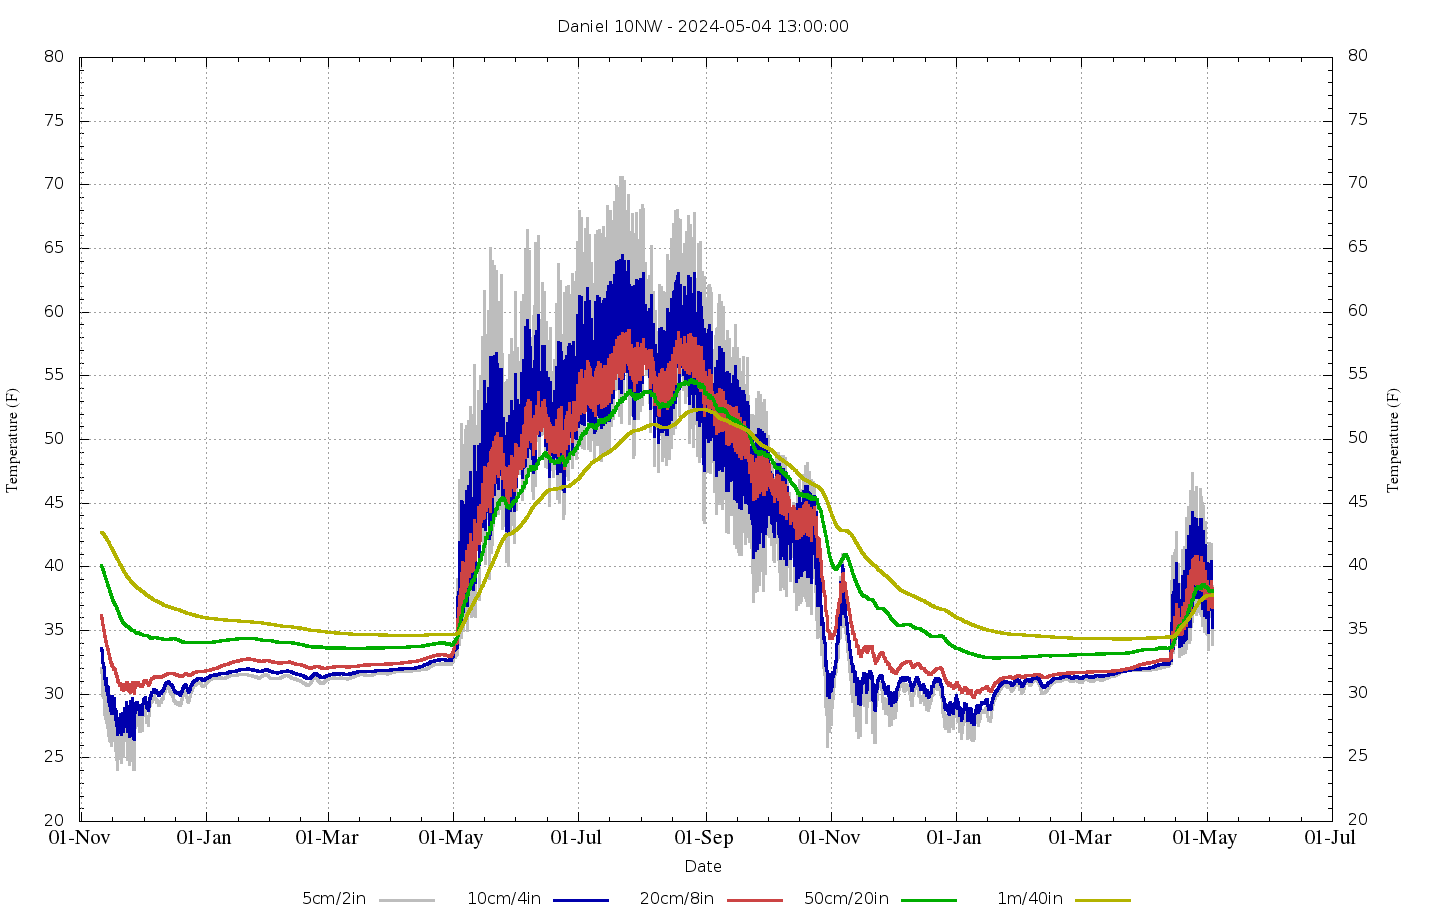
Soil Temperature
Hourly Charts for Last 30 Days | Daily Charts for Last 1000 days