Water Resources Data System & State Climate Office
Water Resources Data System & State Climate Office
Water Resources Data System & State Climate Office


Station Map | WACNet Home
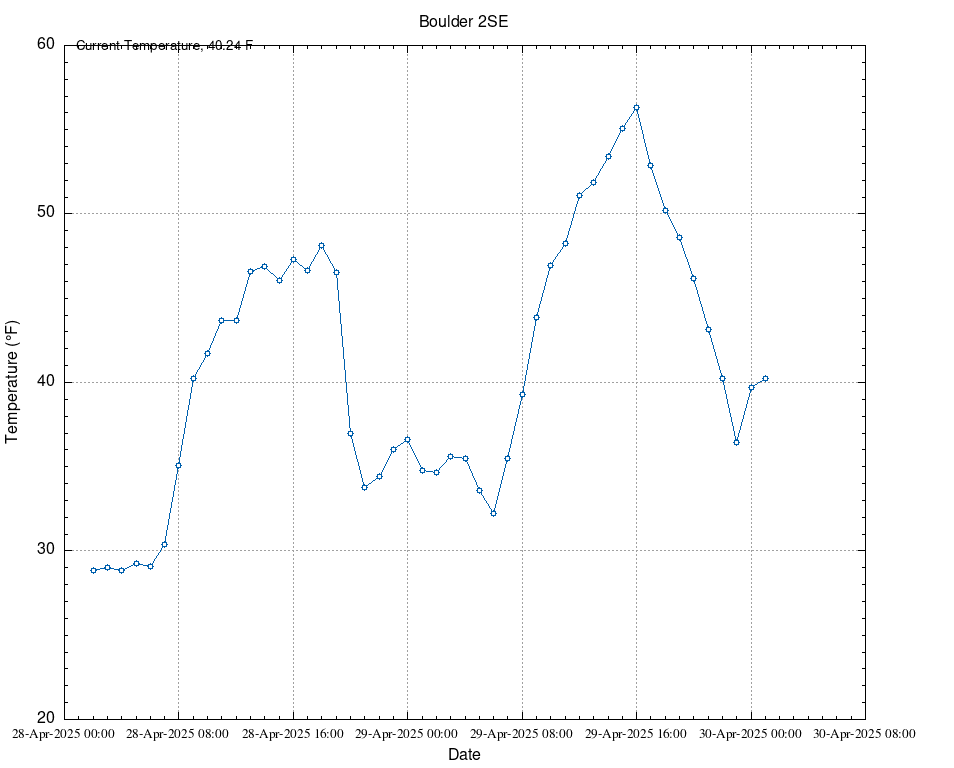
Week at a Glance
| Date | TMax (F) | TMin (F) | TAvg (F) | SoilTemp (F) | Avg Vapor Pressure (kPa) | Avg Sat Vapor Pressure (kPa) | Avg RH (%) | Solar Rad (w/m^2) | Avg Wind Spd (mph) | Precipitation (") |
| 2025-11-14 | -39.23 | 3614.00 | 3677.00 | 3614.00 | 0.00 | 0.02 | 0 | 122.40 | 2.00 | 0.00 |
| 2025-11-15 | -39.24 | 3614.00 | 3677.00 | 3614.00 | 0.00 | 0.02 | 0 | 47.87 | 4.23 | 0.00 |
| 2025-11-16 | -39.24 | 3614.00 | 3677.00 | 3614.00 | 0.00 | 0.02 | 0 | 105.70 | 3.65 | 0.00 |
| 2025-11-17 | -39.24 | 3614.00 | 3677.00 | 3614.00 | 0.00 | 0.02 | 0 | 86.00 | 2.43 | 0.00 |
| 2025-11-18 | -39.26 | 3614.00 | 3677.00 | 3614.00 | 0.00 | 0.02 | 0 | 76.98 | 5.97 | 0.00 |
| 2025-11-19 | -39.26 | 3614.00 | 3677.00 | 3614.00 | 0.00 | 0.02 | 0 | 71.60 | 1.93 | 0.00 |
| 2025-11-20 | -39.26 | 3614.00 | 3677.00 | 3614.00 | 0.00 | 0.02 | 0 | 1.57 | 1.27 | 0.00 |

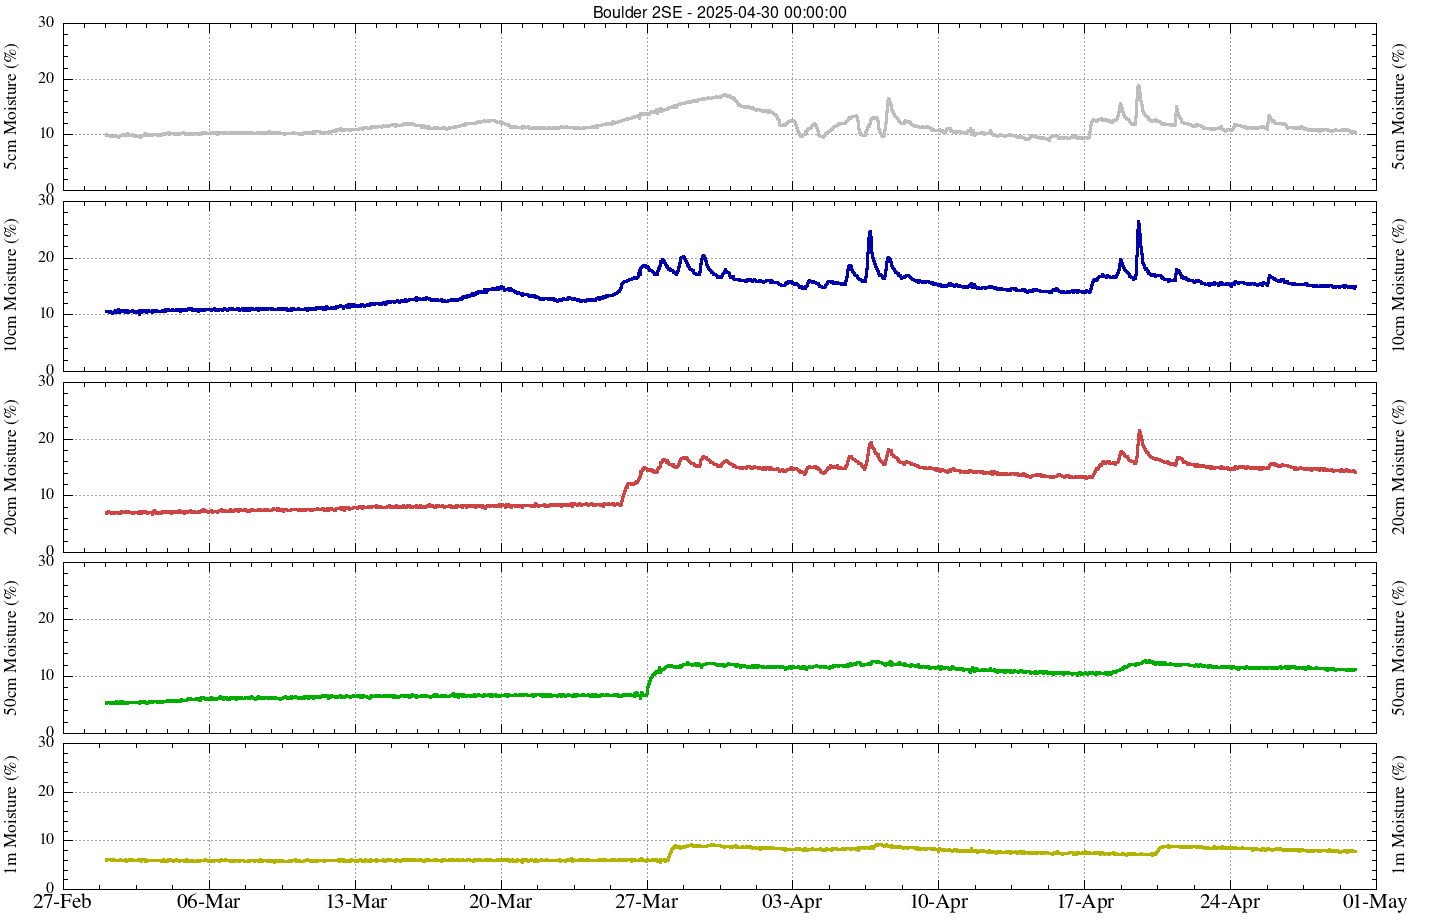
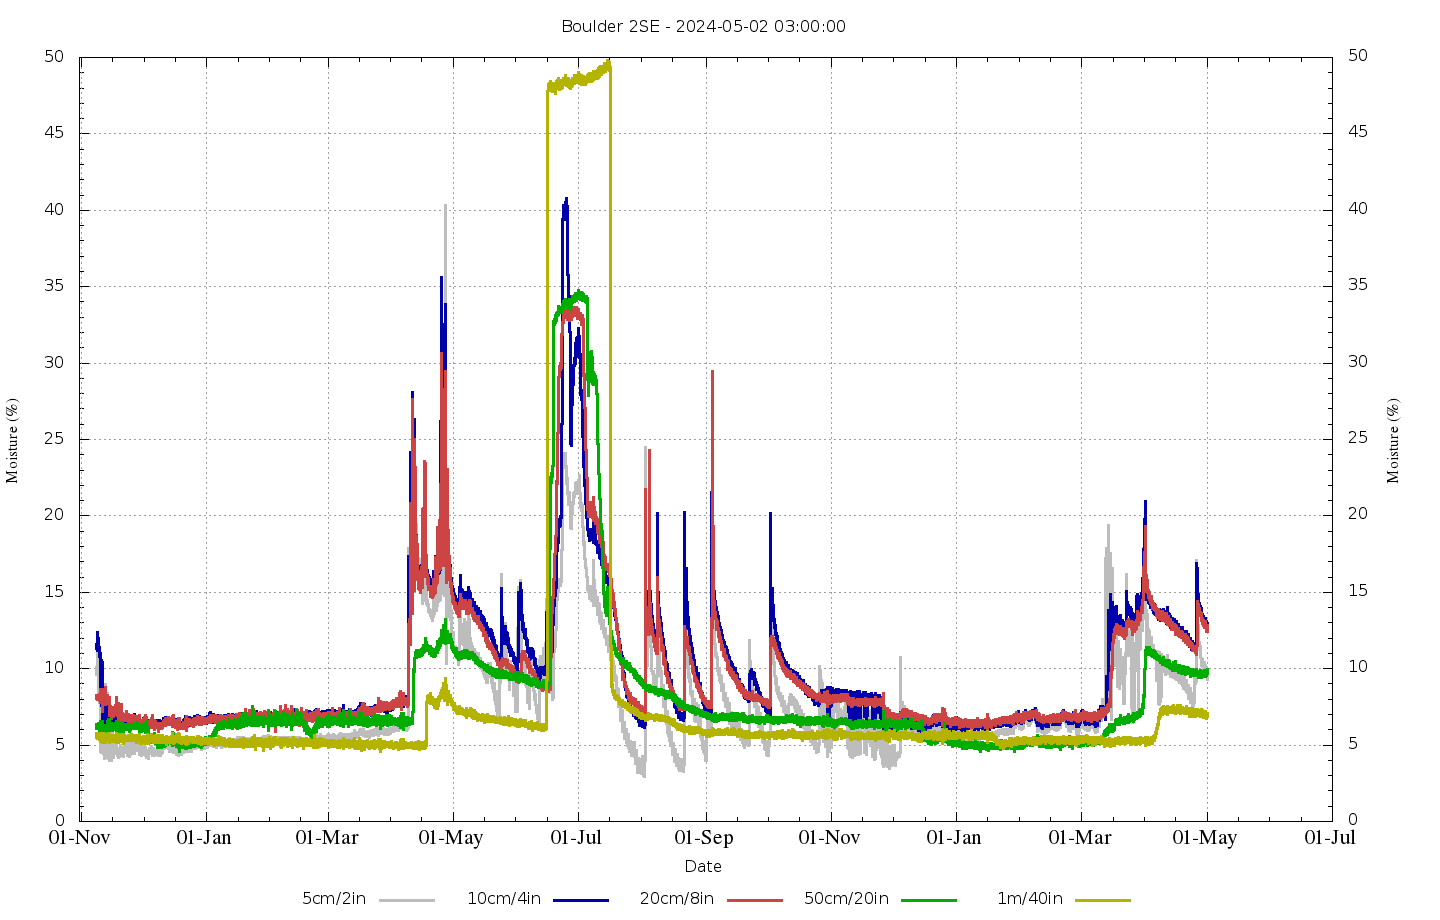
Soil Moisture
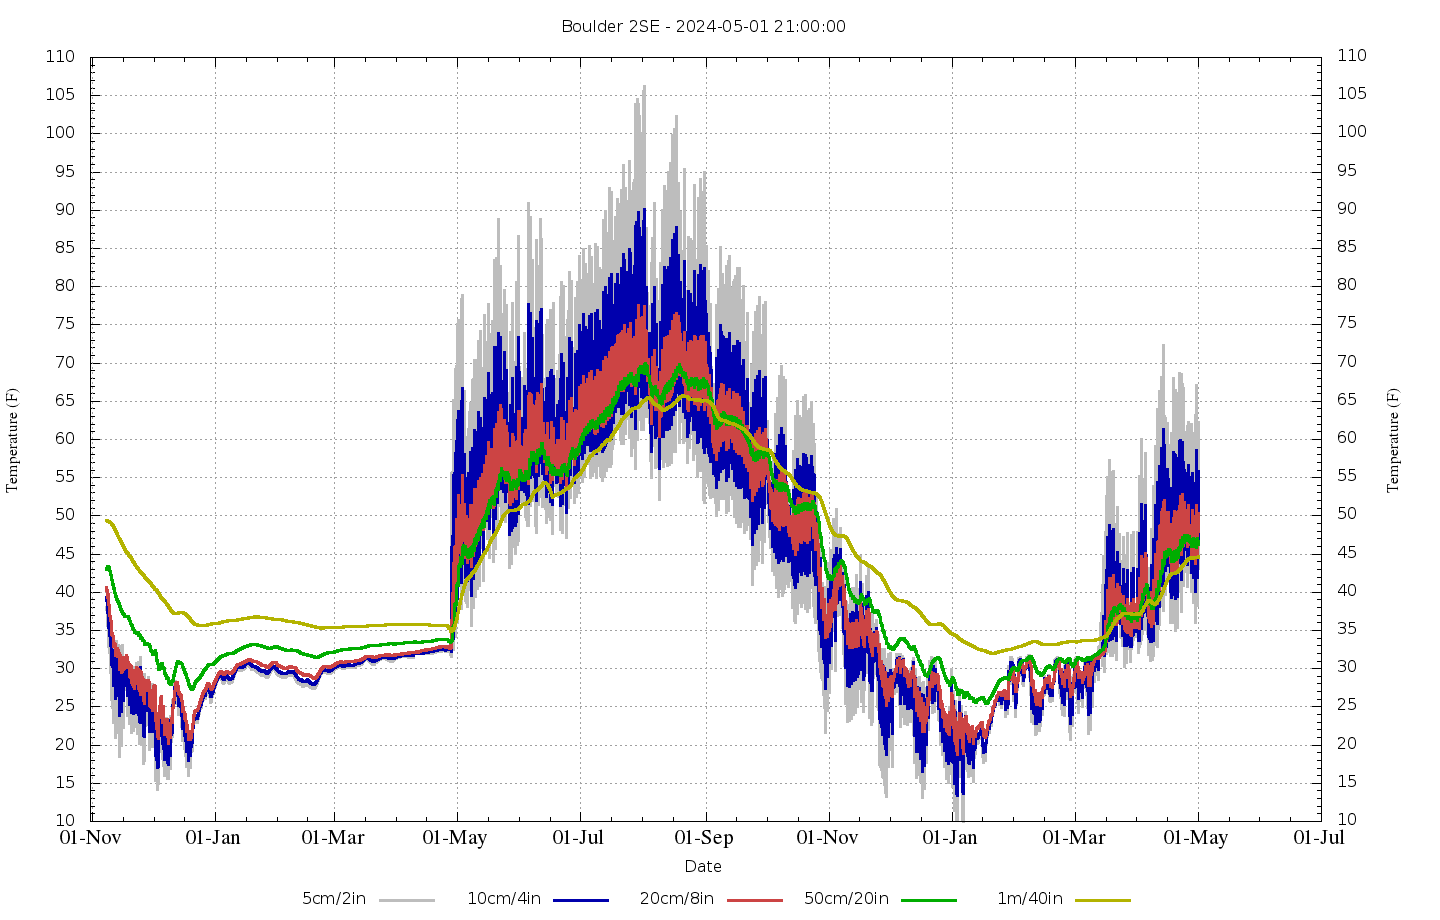
Soil Temperature
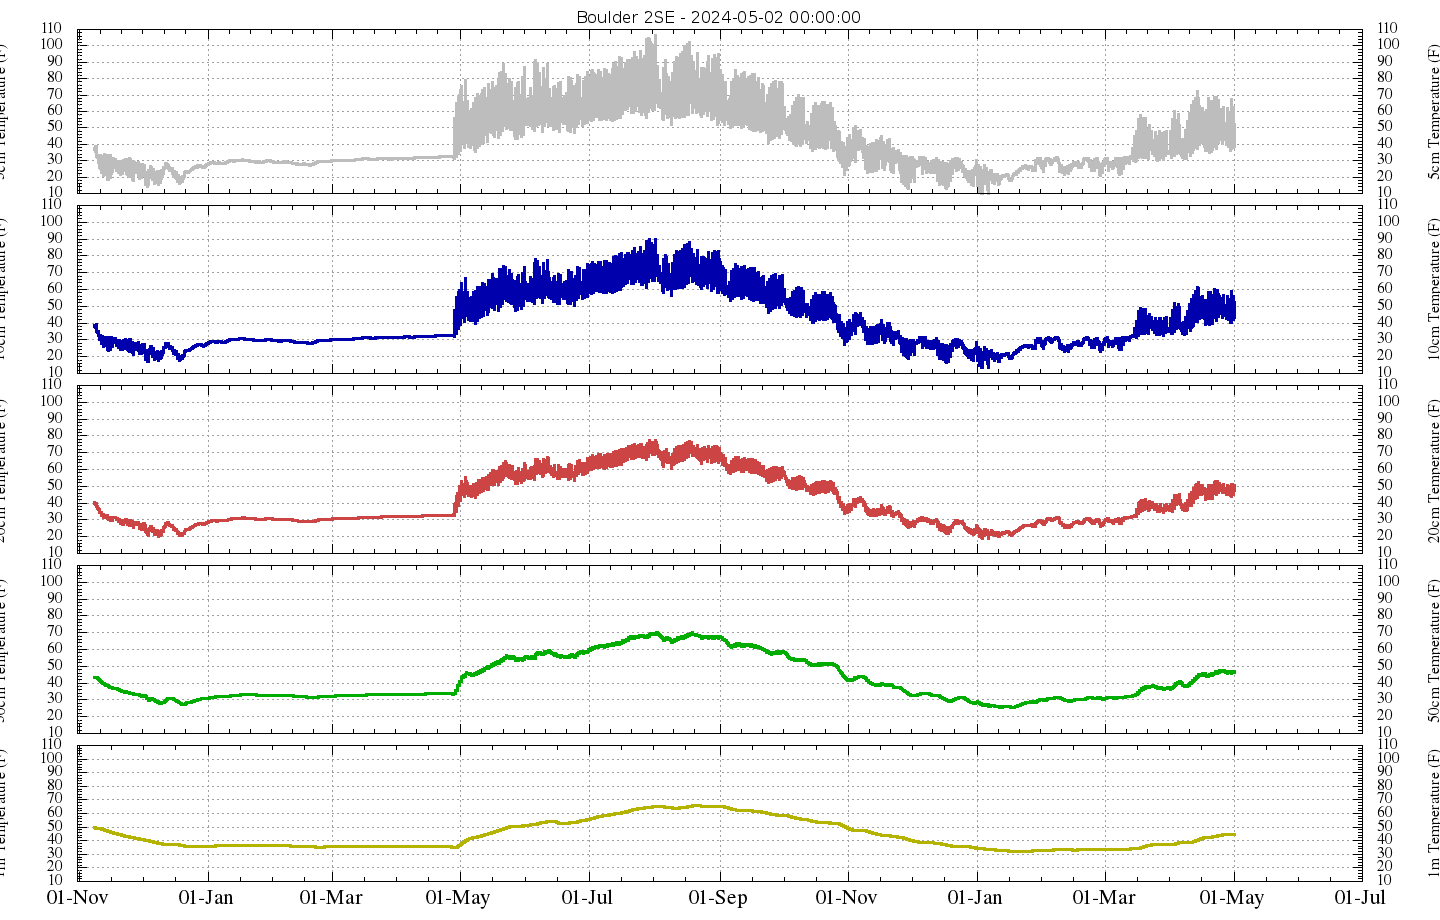
Hourly Charts for Last 30 Days | Daily Charts for Last 1000 days