Water Resources Data System & State Climate Office
Water Resources Data System & State Climate Office
Water Resources Data System & State Climate Office


Station Map | WACNet Home
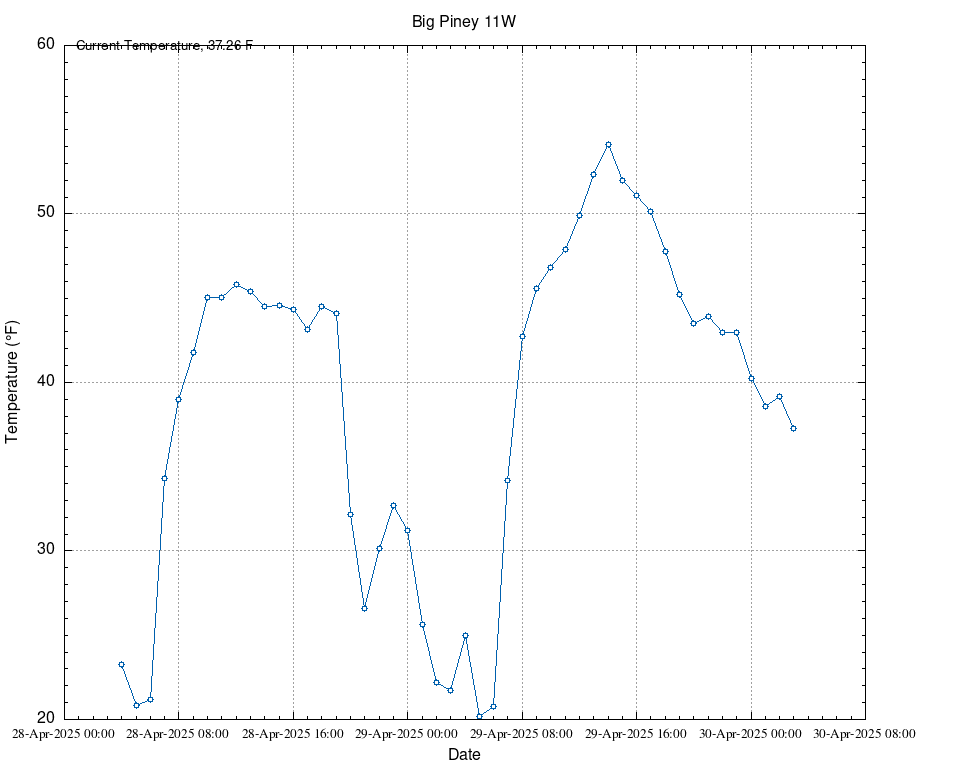
Week at a Glance
| Date | TMax (F) | TMin (F) | TAvg (F) | SoilTemp (F) | Avg Vapor Pressure (kPa) | Avg Sat Vapor Pressure (kPa) | Avg RH (%) | Solar Rad (w/m^2) | Avg Wind Spd (mph) | Precipitation (") |
| 2026-03-06 | 27.45 | 3678.80 | 3678.80 | 3678.80 | 0.00 | 0.33 | 51 | -8.23 | 35.40 | 0.00 |
| 2026-03-07 | 26.37 | 3678.80 | 3678.80 | 3678.80 | 0.00 | 0.29 | 50 | -10.03 | 34.11 | 0.00 |
| 2026-03-08 | 26.18 | 3678.80 | 3678.80 | 3678.80 | 0.00 | 0.33 | 51 | -8.89 | 30.78 | 0.00 |
| 2026-03-09 | 36.30 | 3678.80 | 3678.80 | 3678.80 | 0.00 | 0.46 | 77 | -3.97 | 44.43 | 0.00 |
| 2026-03-10 | 41.61 | 3678.80 | 3678.80 | 3678.80 | 0.00 | 0.47 | 91 | -3.67 | 45.76 | 0.00 |
| 2026-03-11 | 26.09 | 3678.80 | 3678.80 | 3678.80 | 0.00 | 0.28 | 49 | -10.56 | 12.57 | 0.00 |
| 2026-03-12 | 20.49 | 3678.80 | 3678.80 | 3678.80 | 0.00 | 0.22 | 42 | -13.96 | 46.56 | 0.00 |
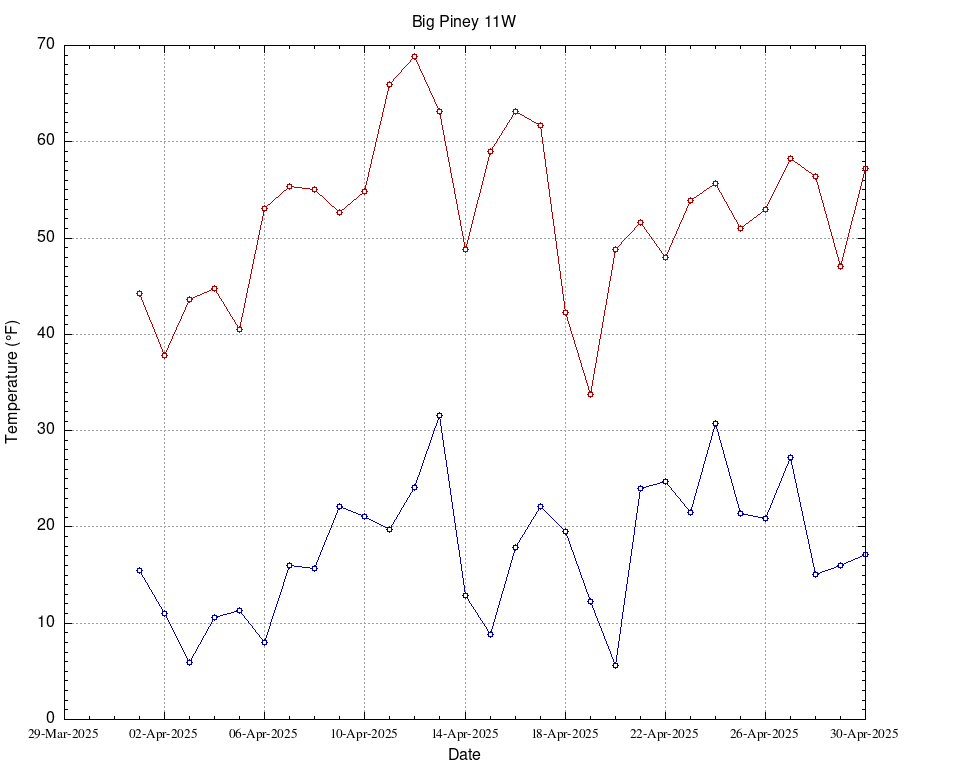
Hourly Charts for Last 30 Days | Daily Charts for Last 1000 days