Water Resources Data System & State Climate Office
Water Resources Data System & State Climate Office
Water Resources Data System & State Climate Office


Station Map | WACNet Home
Week at a Glance
| Date | TMax (F) | TMin (F) | TAvg (F) | SoilTemp (F) | Avg Vapor Pressure (kPa) | Avg Sat Vapor Pressure (kPa) | Avg RH (%) | Solar Rad (w/m^2) | Avg Wind Spd (mph) | Precipitation (") |
| 2026-03-18 | 65.75 | 34.09 | 49.37 | 32.00 | 0.43 | 1.27 | 40 | 216.70 | 9.01 | 0.00 |
| 2026-03-19 | 74.88 | 29.30 | 51.15 | 32.00 | 0.38 | 1.51 | 36 | 241.20 | 9.53 | 0.00 |
| 2026-03-20 | 77.14 | 30.13 | 51.31 | 32.00 | 0.40 | 1.53 | 39 | 241.90 | 7.27 | 0.00 |
| 2026-03-21 | 76.66 | 28.03 | 50.83 | 32.00 | 0.42 | 1.50 | 40 | 243.90 | 6.68 | 0.00 |
| 2026-03-22 | 79.14 | 31.16 | 54.70 | 32.00 | 0.41 | 1.71 | 34 | 236.00 | 9.27 | 0.00 |
| 2026-03-23 | 68.79 | 31.64 | 49.78 | 32.00 | 0.42 | 1.32 | 40 | 229.30 | 4.52 | 0.00 |
| 2026-03-24 | 63.50 | 30.55 | 49.69 | 32.00 | 0.47 | 1.29 | 41 | 98.70 | 4.32 | 0.00 |
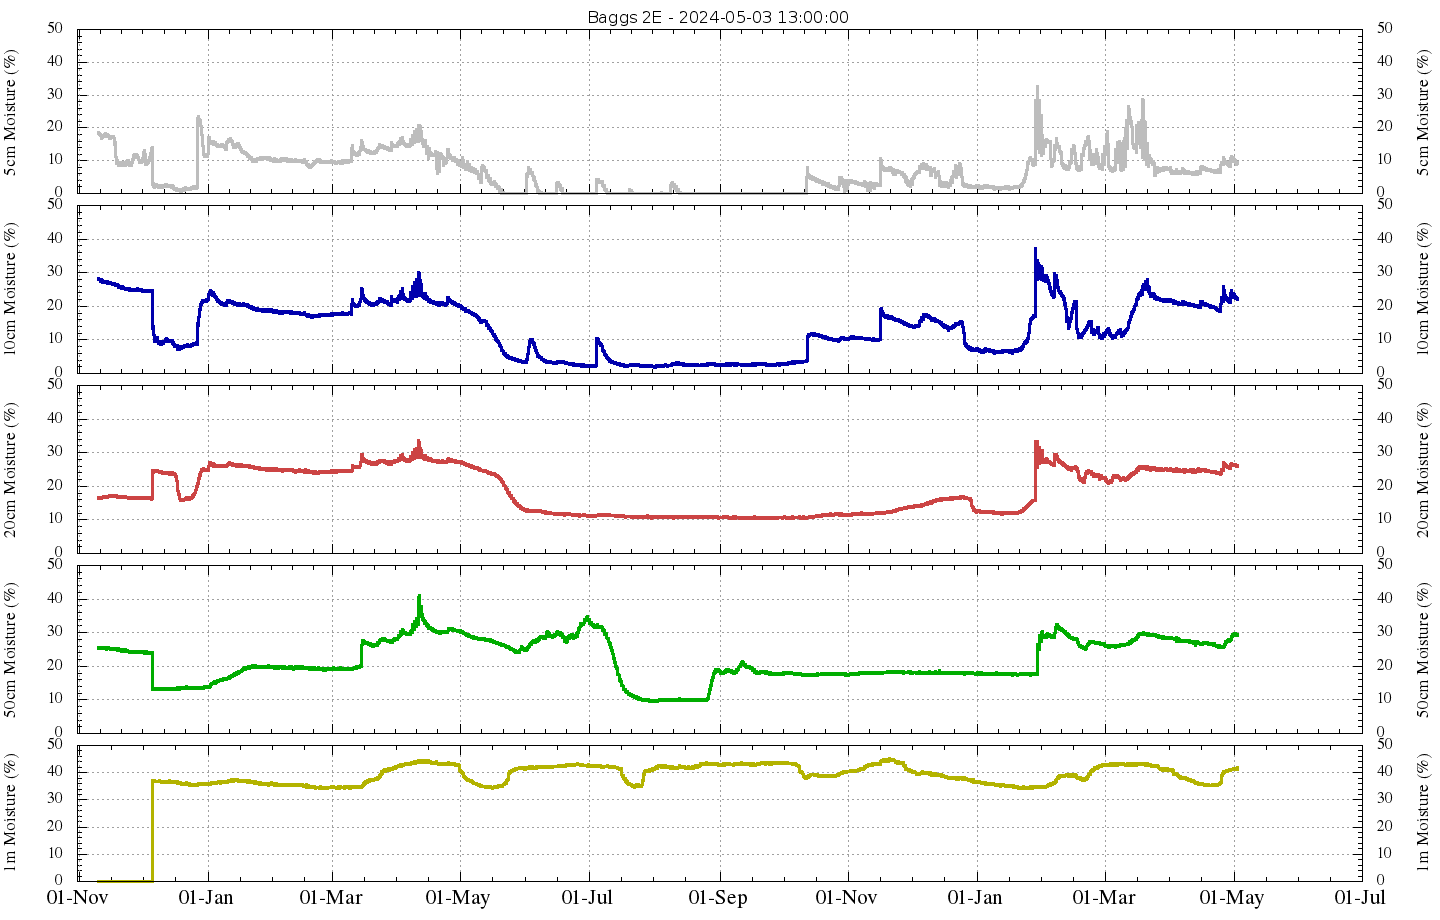
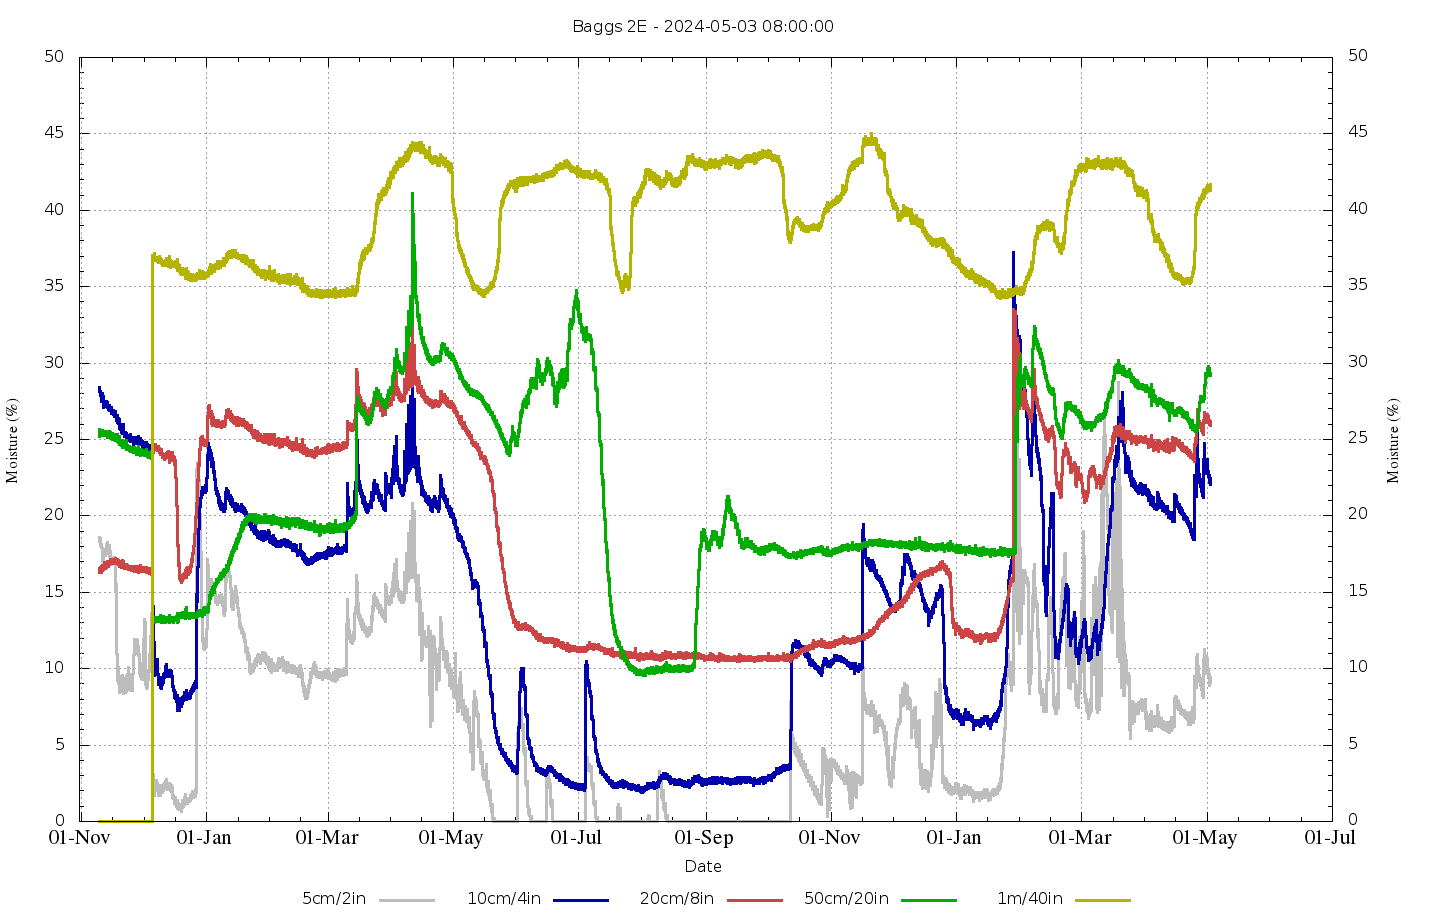
Soil Moisture
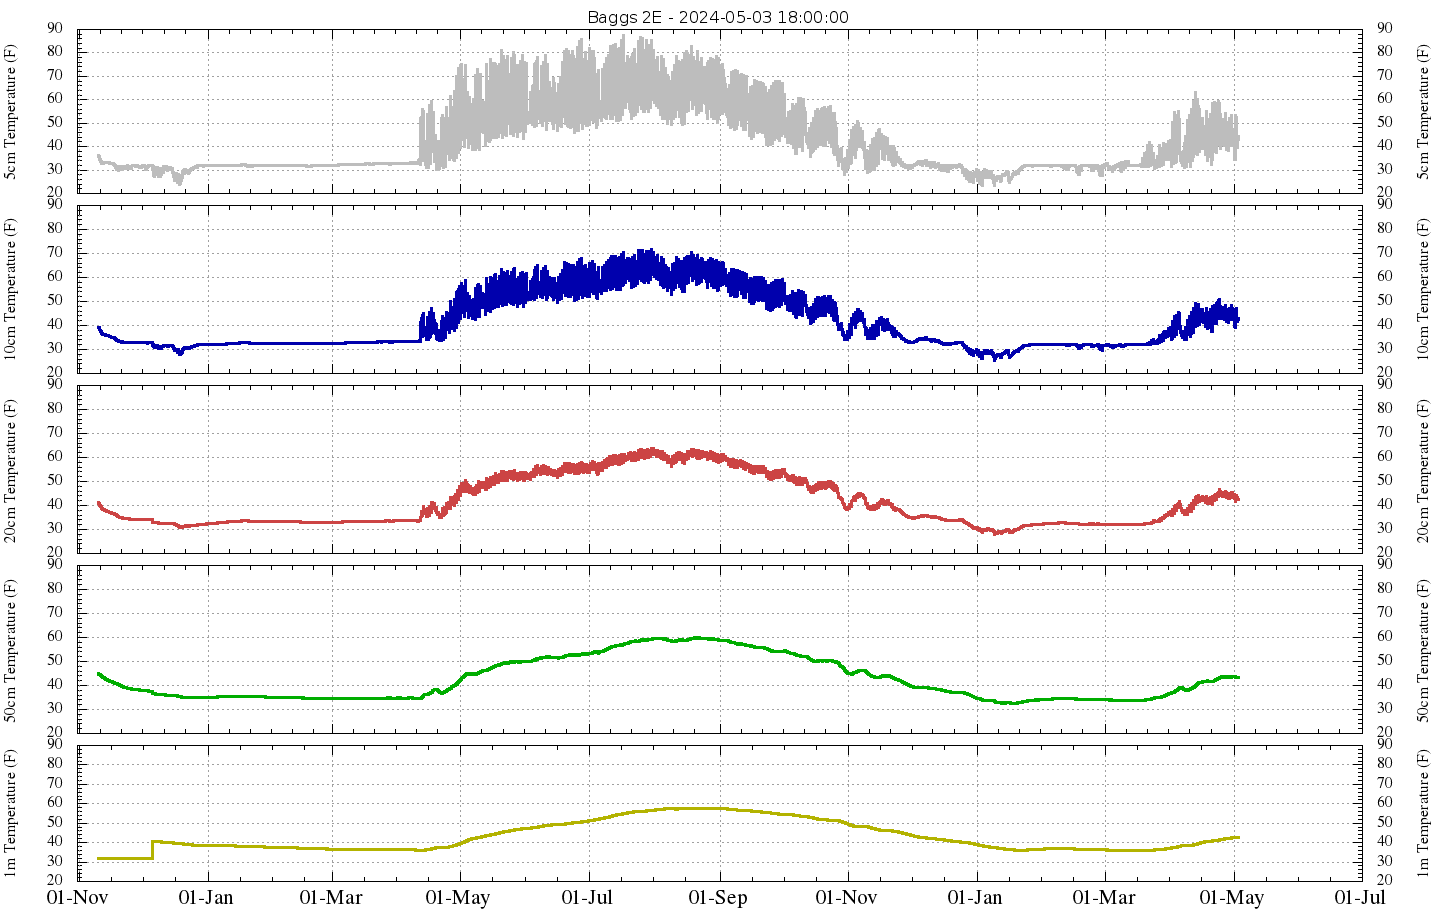
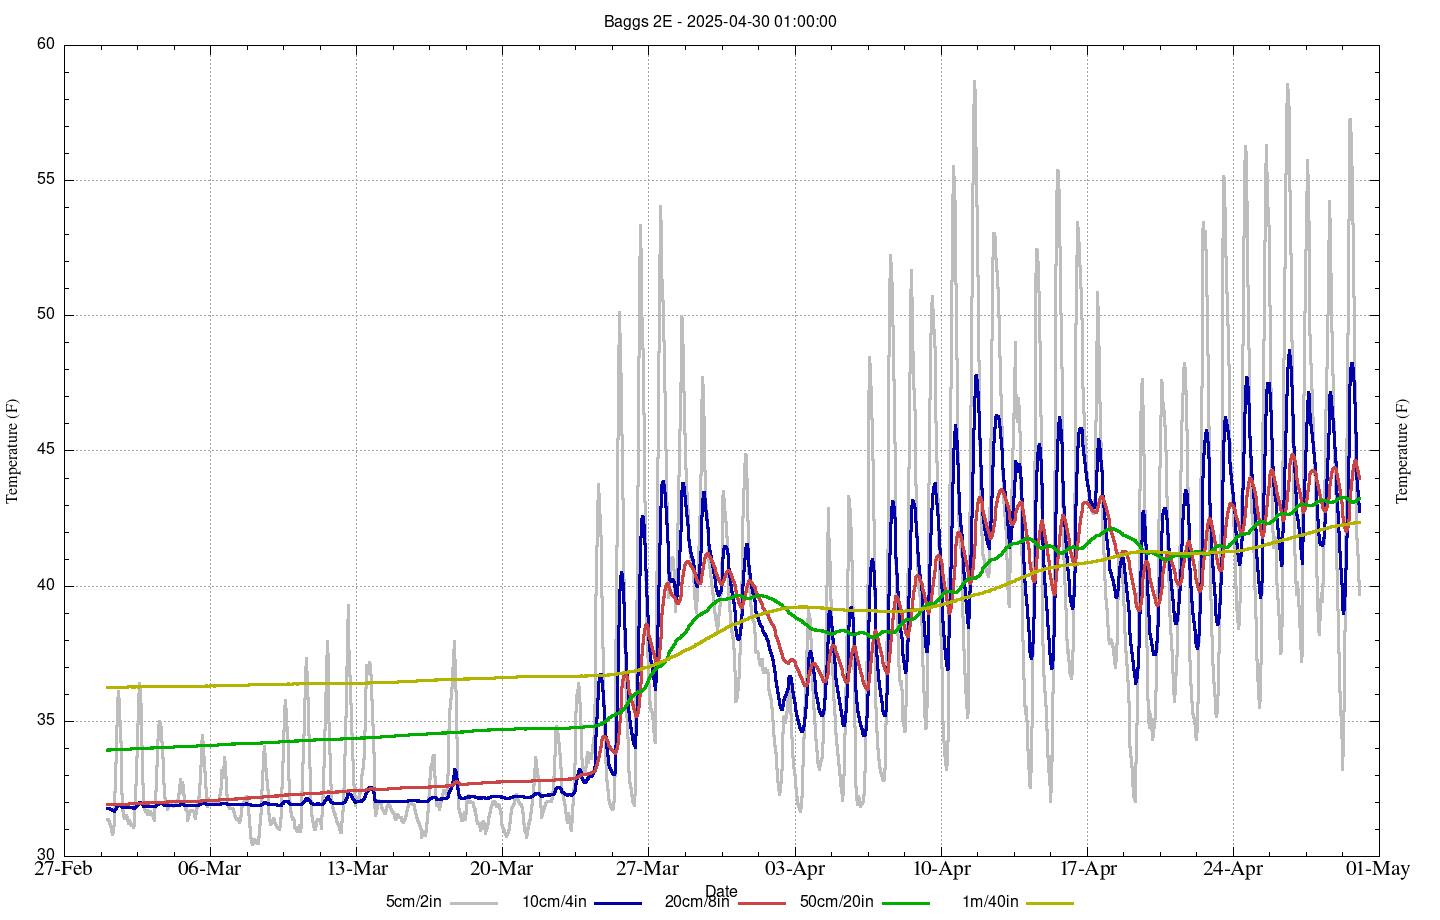
Soil Temperature
Hourly Charts for Last 30 Days | Daily Charts for Last 1000 days