Contents
Temperature
The period from 01 Oct 2017 through 30 Sep 2018 (Water Year 2018) was the 12th warmest Wyoming water year in the last 123 years. The state ranged from about 2.5°F below normal to 4°F above normal (Figure 1). The lower elevations of the Bighorn Basin and much of the northeast quarter of the state were coolest compared to normal, whereas the far eastern plains in the south, central Campbell County, and the central region (lower elevation areas of Fremont County and southern Natrona County into Converse County) were about normal. The rest of the state and the high elevation mountain ranges were above normal, especially throughout the southwest.
Looking at the Climate Divisions (CD) in the state (Figure 2), the rankings show that the warmth in the higher elevations offset the relative coolness in the basins. This is seen most vividly in CD 4, the Bighorn Basin. Parts of the basin were as much as 2.5°F below normal, but the Bighorns in the east and the Absaroka Range in the west were above normal, making the CD the 20th warmest of the last 123 years. CD 3, the Green and Bear drainages, had the warmest ranking of all ten divisions and was the 4th warmest since 1895. At the opposite corner of the state, CD 6, the Belle Fourche Drainage, was the coolest. Even this, ranking as the 50th warmest, was in the warmer half of years.
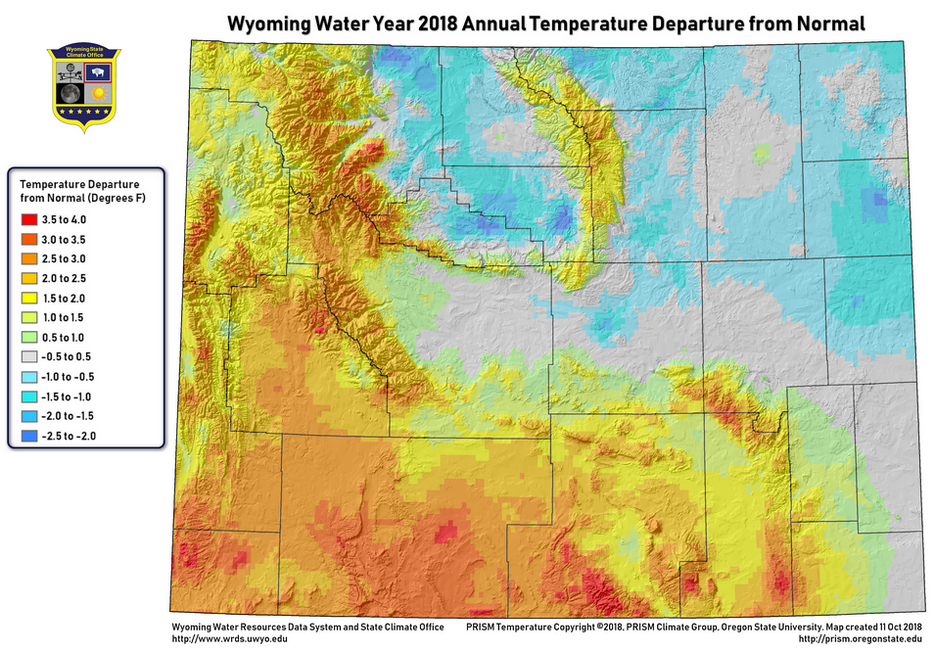
Figure 1. Wyoming Water Year 2018 Annual Temperature Departure from Normal (PRISM Climate Group, 2018)
Statewide, there was no one period in particular that drove the ranking. While all but three months of the water year (August, February, and October) were in the warmer half of their rankings, four isolated months pushed this water year to its rank of the 12 warmest. September was ranked 12th, January and November were both ranked 8th, and May was ranked as the 7th warmest.
When considering the individual months, all divisions except CD 6 (the Belle Fourche drainage) were in the bottom tercile (below normal) for average temperature in October of 2017. For maximum temperature, all climate divisions were in the middle tercile (normal) except for CD 2 and CD 9 (Snake and Wind River drainages) which were in the bottom tercile. The minimum temperature drove down the average temperature ranking for the state as all climate divisions were in the bottom tercile. CD 3 (the Green and Bear drainages), ranked as the 12th coldest October since 1895, was in the bottom 10 percent.
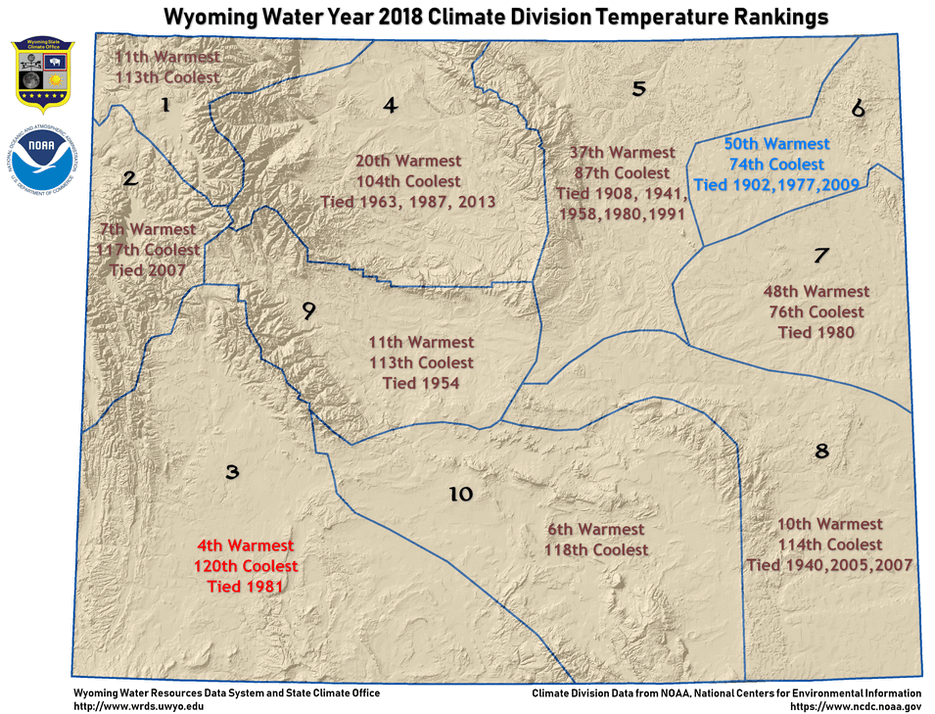 Figure 2. Wyoming Water Year 2018 Climate Division Temperature Rankings (NOAA National Centers for Environmental Information (NCEI), 2018)
February was the other month with a statewide ranking in the bottom third for average temperature. Like October, this was also driven more by the minimum temperature. Unlike October, though, February.s minimum temperatures were not as intense across all climate divisions, rather, the statewide ranking was influenced by extreme cold in northeast Wyoming. Minimum temperatures in Climate Divisions 5, 6, and 7 (the Powder/Tongue, Belle Fourche, and Cheyenne/Niobrara drainages) were all in the bottom 10 percent of the record from 1895 to 2018.
On the other end of the thermometer, May 2018 had monthly average temperatures in the top 10 percent of years statewide and for all climate divisions except CD 9, the Wind River drainage (Table 1). The maximum temperature was only in the top 10 percent of years in four climate divisions but, again, the minimum temperatures are what drove up the average and statewide and in all climate divisions, the minimum monthly temperatures were in the top 10 percent of year in all drainage basins without exception (Table 2).
Tables 1, 2, and 3 below show the rankings for the state and for each climate division in terms of how cold and how warm each period was ranked and compared to the last 123 years. The rankings are shown for each month and for the water year as a whole. The table below shows Average Temperature rankings and the two tables on the following page show rankings for the Minimum and Maximum Temperature.
|
Coldest 10%
|
Coldest 33%
|
Normal
|
Warmest 33%
|
Warmest 10%
|
|
|
Average Temperature (Coldest [C] and Warmest [W] Rankings)
|
|
Date
|
Wyoming
|
CD 1
|
CD 2
|
CD 3
|
CD 4
|
CD 5
|
CD 6
|
CD 7
|
CD 8
|
CD 9
|
CD 10
|
|
|
C
|
W
|
C
|
W
|
C
|
W
|
C
|
W
|
C
|
W
|
C
|
W
|
C
|
W
|
C
|
W
|
C
|
W
|
C
|
W
|
C
|
W
|
|
Oct-17
|
35
|
89
|
39
|
85
|
30
|
94
|
30
|
94
|
41
|
83
|
41
|
83
|
44
|
80
|
40
|
84
|
36
|
88
|
37
|
87
|
33
|
91
|
|
Nov-17
|
116
|
8
|
100
|
24
|
100
|
24
|
120
|
4
|
102
|
22
|
97
|
27
|
99
|
25
|
104
|
20
|
120
|
4
|
111
|
13
|
119
|
5
|
|
Dec-17
|
96
|
28
|
92
|
32
|
103
|
21
|
115
|
9
|
78
|
46
|
55
|
69
|
50
|
74
|
49
|
75
|
90
|
34
|
94
|
30
|
111
|
13
|
|
Jan-18
|
117
|
8
|
119
|
6
|
122
|
3
|
120
|
5
|
113
|
12
|
101
|
24
|
89
|
36
|
74
|
51
|
112
|
13
|
114
|
11
|
119
|
6
|
|
Feb-18
|
27
|
98
|
30
|
95
|
66
|
59
|
70
|
55
|
16
|
109
|
14
|
111
|
9
|
116
|
12
|
113
|
36
|
89
|
33
|
92
|
56
|
69
|
|
Mar-18
|
93
|
32
|
88
|
37
|
78
|
47
|
98
|
27
|
92
|
33
|
82
|
43
|
72
|
53
|
86
|
39
|
100
|
25
|
93
|
32
|
99
|
26
|
|
Apr-18
|
73
|
52
|
80
|
45
|
85
|
40
|
91
|
34
|
62
|
63
|
53
|
72
|
31
|
94
|
40
|
85
|
70
|
55
|
77
|
48
|
89
|
36
|
|
May-18
|
118
|
7
|
119
|
6
|
117
|
8
|
116
|
9
|
119
|
6
|
116
|
9
|
117
|
8
|
117
|
8
|
120
|
5
|
111
|
14
|
119
|
6
|
|
Jun-18
|
97
|
28
|
83
|
42
|
84
|
41
|
106
|
19
|
91
|
34
|
89
|
36
|
90
|
35
|
89
|
36
|
104
|
21
|
87
|
38
|
106
|
19
|
|
Jul-18
|
98
|
27
|
107
|
18
|
105
|
20
|
115
|
10
|
96
|
29
|
85
|
40
|
68
|
57
|
56
|
69
|
84
|
41
|
97
|
28
|
105
|
20
|
|
Aug-18
|
60
|
65
|
70
|
55
|
69
|
56
|
89
|
36
|
59
|
66
|
49
|
76
|
44
|
81
|
34
|
91
|
55
|
70
|
65
|
60
|
74
|
51
|
|
Sep-18
|
113
|
12
|
101
|
24
|
108
|
17
|
120
|
5
|
102
|
23
|
92
|
33
|
85
|
40
|
106
|
19
|
121
|
4
|
110
|
15
|
121
|
4
|
|
2018
|
112
|
12
|
113
|
11
|
117
|
7
|
120
|
4
|
104
|
20
|
87
|
37
|
74
|
50
|
76
|
48
|
114
|
10
|
113
|
11
|
118
|
6
|
Table 1. Statewide and Climate Division Rankings for Average Temperature (NOAA NCEI Climate at a Glance, 2018)
|
Coldest 10%
|
Coldest 33%
|
Normal
|
Warmest 33%
|
Warmest 10%
|
|
|
Minimum Temperature (Coldest and Warmest Rankings)
|
|
Date
|
Wyoming
|
CD 1
|
CD 2
|
CD 3
|
CD 4
|
CD 5
|
CD 6
|
CD 7
|
CD 8
|
CD 9
|
CD 10
|
|
|
C
|
W
|
C
|
W
|
C
|
W
|
C
|
W
|
C
|
W
|
C
|
W
|
C
|
W
|
C
|
W
|
C
|
W
|
C
|
W
|
C
|
W
|
|
Oct-17
|
21
|
103
|
39
|
85
|
24
|
100
|
12
|
112
|
29
|
95
|
19
|
105
|
33
|
91
|
32
|
92
|
32
|
92
|
27
|
97
|
21
|
103
|
|
Nov-17
|
118
|
6
|
102
|
22
|
102
|
22
|
121
|
3
|
107
|
17
|
103
|
21
|
106
|
18
|
106
|
18
|
118
|
6
|
114
|
10
|
123
|
1
|
|
Dec-17
|
86
|
38
|
89
|
35
|
93
|
31
|
109
|
15
|
71
|
53
|
53
|
71
|
46
|
78
|
46
|
78
|
69
|
55
|
94
|
30
|
100
|
24
|
|
Jan-18
|
115
|
10
|
119
|
6
|
116
|
9
|
120
|
5
|
113
|
12
|
101
|
24
|
88
|
37
|
76
|
49
|
109
|
16
|
113
|
12
|
120
|
5
|
|
Feb-18
|
25
|
100
|
50
|
75
|
81
|
44
|
88
|
37
|
18
|
107
|
12
|
113
|
3
|
122
|
10
|
115
|
22
|
103
|
31
|
94
|
58
|
67
|
|
Mar-18
|
86
|
39
|
95
|
30
|
81
|
44
|
98
|
27
|
92
|
33
|
72
|
53
|
67
|
58
|
76
|
49
|
90
|
35
|
95
|
30
|
98
|
27
|
|
Apr-18
|
49
|
76
|
84
|
41
|
92
|
33
|
79
|
46
|
47
|
78
|
25
|
100
|
19
|
106
|
23
|
102
|
35
|
90
|
48
|
77
|
68
|
57
|
|
May-18
|
121
|
4
|
123
|
2
|
118
|
7
|
121
|
4
|
121
|
4
|
117
|
8
|
120
|
5
|
122
|
3
|
122
|
3
|
118
|
7
|
119
|
6
|
|
Jun-18
|
102
|
23
|
98
|
27
|
90
|
35
|
108
|
17
|
99
|
26
|
89
|
36
|
98
|
27
|
93
|
32
|
103
|
22
|
87
|
38
|
107
|
18
|
|
Jul-18
|
102
|
23
|
100
|
25
|
99
|
26
|
113
|
12
|
95
|
30
|
87
|
38
|
89
|
36
|
76
|
49
|
92
|
33
|
90
|
35
|
103
|
22
|
|
Aug-18
|
58
|
67
|
76
|
49
|
66
|
59
|
79
|
46
|
58
|
67
|
55
|
70
|
46
|
79
|
32
|
93
|
50
|
75
|
58
|
67
|
70
|
55
|
|
Sep-18
|
97
|
28
|
94
|
31
|
58
|
67
|
95
|
30
|
95
|
30
|
82
|
43
|
98
|
27
|
104
|
21
|
111
|
14
|
78
|
47
|
106
|
19
|
|
2018
|
110
|
14
|
115
|
9
|
115
|
9
|
120
|
4
|
96
|
28
|
75
|
49
|
72
|
52
|
73
|
51
|
107
|
17
|
109
|
15
|
118
|
6
|
Table 2. Statewide and Climate Division Rankings for Minimum Temperature (NOAA NCEI Climate at a Glance, 2018)
|
Coldest 10%
|
Coldest 33%
|
Normal
|
Warmest 33%
|
Warmest 10%
|
|
|
Maximum Temperature (Coldest [C] and Warmest [W] Rankings)
|
|
Date
|
Wyoming
|
CD 1
|
CD 2
|
CD 3
|
CD 4
|
CD 5
|
CD 6
|
CD 7
|
CD 8
|
CD 9
|
CD 10
|
|
|
C
|
W
|
C
|
W
|
C
|
W
|
C
|
W
|
C
|
W
|
C
|
W
|
C
|
W
|
C
|
W
|
C
|
W
|
C
|
W
|
C
|
W
|
|
Oct-17
|
45
|
79
|
44
|
80
|
36
|
88
|
46
|
78
|
46
|
78
|
50
|
74
|
50
|
74
|
47
|
77
|
43
|
81
|
40
|
84
|
42
|
82
|
|
Nov-17
|
107
|
17
|
96
|
28
|
94
|
30
|
112
|
12
|
98
|
26
|
97
|
27
|
95
|
29
|
100
|
24
|
120
|
4
|
103
|
21
|
117
|
7
|
|
Dec-17
|
105
|
19
|
93
|
31
|
110
|
14
|
120
|
4
|
86
|
38
|
62
|
62
|
47
|
77
|
55
|
69
|
98
|
26
|
102
|
22
|
115
|
9
|
|
Jan-18
|
116
|
9
|
119
|
6
|
121
|
4
|
120
|
5
|
110
|
15
|
107
|
18
|
90
|
35
|
76
|
49
|
112
|
13
|
116
|
9
|
120
|
5
|
|
Feb-18
|
31
|
94
|
21
|
104
|
40
|
85
|
57
|
68
|
18
|
107
|
19
|
106
|
16
|
109
|
15
|
110
|
52
|
73
|
36
|
89
|
57
|
68
|
|
Mar-18
|
94
|
31
|
87
|
38
|
74
|
51
|
98
|
27
|
93
|
32
|
81
|
44
|
70
|
55
|
91
|
34
|
107
|
18
|
94
|
31
|
100
|
25
|
|
Apr-18
|
86
|
39
|
83
|
42
|
84
|
41
|
96
|
29
|
82
|
43
|
73
|
52
|
48
|
77
|
59
|
66
|
90
|
35
|
88
|
37
|
96
|
29
|
|
May-18
|
112
|
13
|
116
|
9
|
112
|
13
|
115
|
10
|
105
|
20
|
111
|
14
|
113
|
12
|
110
|
15
|
108
|
17
|
103
|
22
|
116
|
9
|
|
Jun-18
|
97
|
28
|
77
|
48
|
82
|
43
|
102
|
23
|
91
|
34
|
90
|
35
|
87
|
38
|
86
|
39
|
105
|
20
|
87
|
38
|
105
|
20
|
|
Jul-18
|
95
|
30
|
104
|
21
|
101
|
24
|
113
|
12
|
92
|
33
|
80
|
45
|
57
|
68
|
39
|
86
|
80
|
45
|
100
|
25
|
103
|
22
|
|
Aug-18
|
67
|
58
|
68
|
57
|
73
|
52
|
95
|
30
|
64
|
61
|
50
|
75
|
38
|
87
|
42
|
83
|
54
|
71
|
70
|
55
|
76
|
49
|
|
Sep-18
|
117
|
8
|
105
|
20
|
118
|
7
|
124
|
1
|
108
|
17
|
93
|
32
|
71
|
54
|
97
|
28
|
122
|
3
|
121
|
4
|
124
|
1
|
|
2018
|
113
|
11
|
108
|
16
|
112
|
12
|
121
|
3
|
106
|
18
|
96
|
28
|
76
|
48
|
81
|
43
|
117
|
7
|
112
|
12
|
120
|
4
|
Table 3. Statewide and Climate Division Rankings for Maximum Temperature (NOAA NCEI Climate at a Glance, 2018)
Precipitation
Precipitation totals across the state ranged from about 25% to 205% of the 1981-2010 Normal for water year 2018. The Continental Divide split the state into two different precipitation regimes. To the west, an area which received less than normal precipitation and, to the east, one which had above normal precipitation (Figure 3). The higher elevation areas such as the Wind River Range, the Bighorn Mountains, the Laramie Range, and the eastern flanks of the Owl Creek mountains also had less than normal precipitation totals for the year.
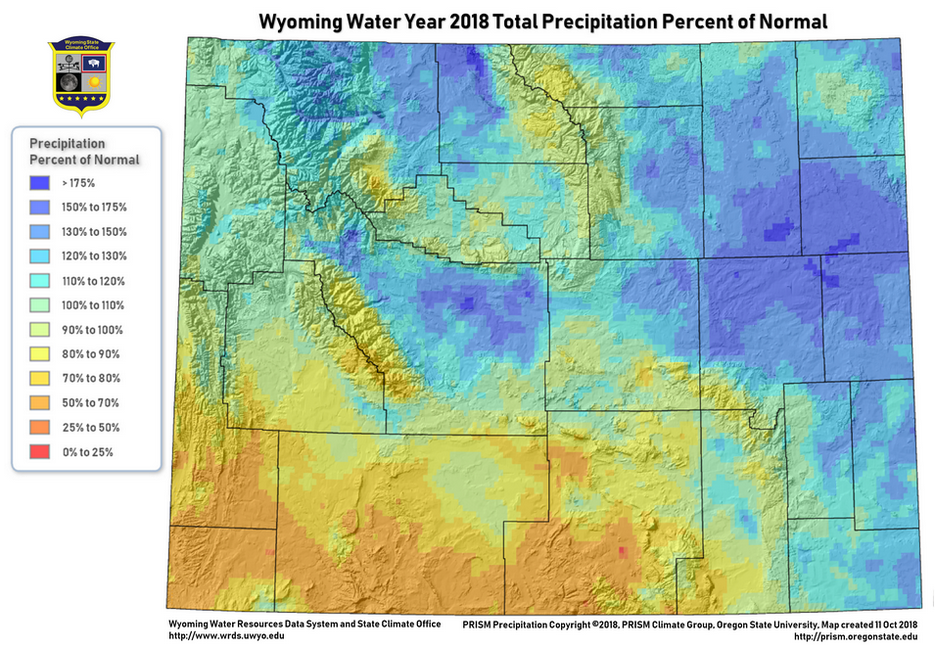
Figure 3. Wyoming Water Year 2018 Annual Precipitation Percent of Normal (PRISM Climate Group, 2018)
Climate Division 7 in the east (the Cheyenne and Niobrara drainages) had the highest percentage of normal and water year 2018 ranked as the 6th wettest year for the period 1895 to 2018. Low elevation areas of the Bighorn Basin and Wind River Basin (Climate Divisions 4 and 9) also had high percentages of normal, but the basins, as a whole, ranked much higher in terms of dryness because of being offset by the relative lack of precipitation in the surrounding higher elevations. Those two divisions (4 and 9) ranked as the 44th and 52nd wettest respectively.
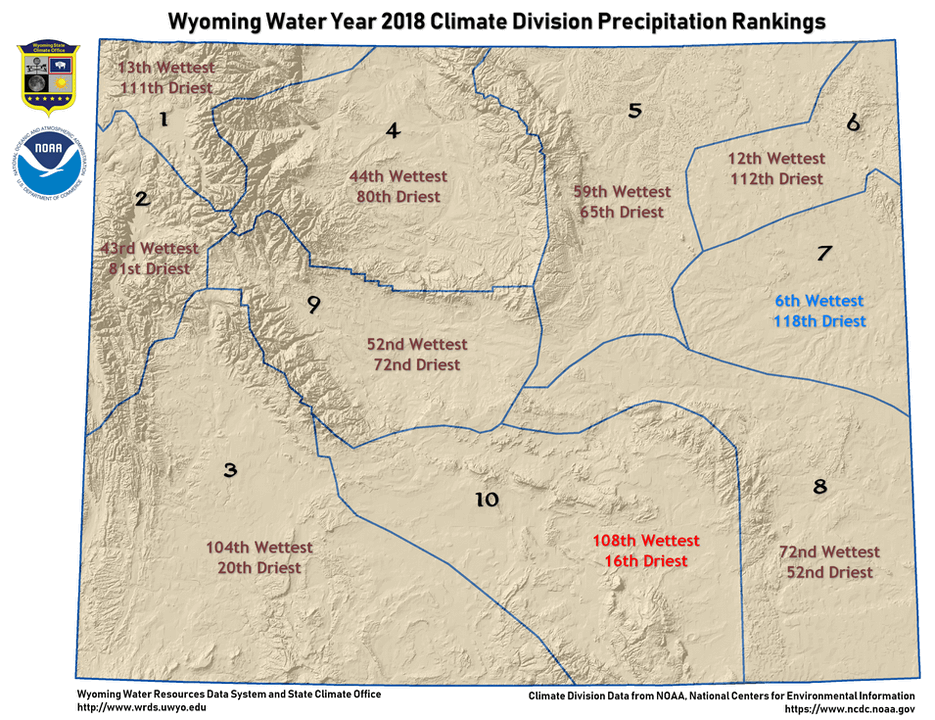
Figure 4. Wyoming Water Year 2018 Climate Division Temperature Rankings (NOAA National Centers for Environmental Information (NCEI), 2018)
Climate Division 6 (the Belle Fourche Drainage) had the second highest ranking in the state (12th wettest out of the last 123 years) and, for all months of the water year, had normal or above normal precipitation. Four months (December, May, June, and August) were in the upper tercile (above normal) of years and an additional three months (February, March, and July) were in the top 10 percent.
Climate Division 10 (the Upper Platte) receive the least precipitation compared to normal and ranked as the 16th driest of the last 123 years. All months ranked either normal or below normal.
Climate Division 1 (the Yellowstone Drainage) had two months (July and September) that were in the bottom 10 percent while three other months (November, February, and April) were in the top 10 percent.
Statewide, September 2018 was the driest month, ranking as the 12th driest since 1895. Four of the divisions (1, 2, 3, and 9) had totals for September that were in the bottom 10 percent (Table 4). While November ranked as the wettest (18th wettest since 1895), February had four divisions (1, 4, 5, and 6) that were in the top 10 percent. May, which had almost the same ranking as February only had one climate division (7, the Cheyenne and Niobrara drainages) that was in the top 10 percent for wetness.
Wyoming, as a whole, for water year 2018 was very close to normal and ranked as the 60th driest and 64th wettest year of the last 123. This ranking, though, is somewhat misleading given the stark differences east and west of the Continental Divide.
|
Driest 10%
|
Driest 33%
|
Normal
|
Wettest 33%
|
Wettest 10%
|
|
|
Precipitation (Driest [D] and Wettest [W] Rankings)
|
|
Date
|
Wyoming
|
CD 1
|
CD 2
|
CD 3
|
CD 4
|
CD 5
|
CD 6
|
CD 7
|
CD 8
|
CD 9
|
CD 10
|
|
|
D
|
W
|
D
|
W
|
D
|
W
|
D
|
W
|
D
|
W
|
D
|
W
|
D
|
W
|
D
|
W
|
D
|
W
|
D
|
W
|
D
|
W
|
|
Oct-17
|
33
|
91
|
40
|
84
|
46
|
78
|
13
|
111
|
41
|
83
|
41
|
83
|
55
|
69
|
53
|
71
|
49
|
75
|
49
|
75
|
36
|
88
|
|
Nov-17
|
106
|
18
|
119
|
5
|
115
|
9
|
93
|
31
|
105
|
19
|
81
|
43
|
63
|
61
|
74
|
50
|
48
|
76
|
110
|
14
|
63
|
61
|
|
Dec-17
|
66
|
58
|
73
|
51
|
31
|
93
|
49
|
75
|
92
|
32
|
83
|
41
|
96
|
28
|
91
|
33
|
60
|
64
|
106
|
18
|
57
|
67
|
|
Jan-18
|
47
|
78
|
71
|
54
|
55
|
70
|
41
|
84
|
37
|
88
|
61
|
64
|
79
|
46
|
105
|
20
|
70
|
55
|
43
|
82
|
45
|
80
|
|
Feb-18
|
102
|
23
|
117
|
8
|
79
|
46
|
71
|
54
|
117
|
8
|
116
|
9
|
122
|
3
|
109
|
16
|
41
|
84
|
108
|
17
|
60
|
65
|
|
Mar-18
|
78
|
47
|
59
|
66
|
92
|
33
|
66
|
59
|
59
|
66
|
93
|
32
|
114
|
11
|
103
|
22
|
79
|
46
|
60
|
65
|
50
|
75
|
|
Apr-18
|
48
|
77
|
119
|
6
|
121
|
4
|
39
|
86
|
74
|
51
|
35
|
90
|
59
|
66
|
30
|
95
|
25
|
100
|
43
|
82
|
19
|
106
|
|
May-18
|
103
|
22
|
82
|
43
|
103
|
22
|
98
|
27
|
110
|
15
|
78
|
47
|
89
|
36
|
113
|
12
|
108
|
17
|
108
|
17
|
67
|
58
|
|
Jun-18
|
84
|
41
|
110
|
15
|
88
|
37
|
66
|
59
|
88
|
37
|
86
|
39
|
109
|
16
|
113
|
12
|
65
|
60
|
90
|
35
|
64
|
61
|
|
Jul-18
|
73
|
52
|
8
|
117
|
13
|
112
|
16
|
109
|
30
|
95
|
84
|
41
|
115
|
10
|
118
|
7
|
89
|
36
|
51
|
74
|
37
|
88
|
|
Aug-18
|
60
|
65
|
87
|
38
|
70
|
55
|
42
|
83
|
88
|
37
|
81
|
44
|
98
|
27
|
56
|
69
|
52
|
73
|
38
|
87
|
43
|
82
|
|
Sep-18
|
12
|
113
|
7
|
118
|
1
|
124
|
2
|
123
|
21
|
104
|
46
|
79
|
47
|
78
|
43
|
82
|
38
|
87
|
6
|
119
|
17
|
108
|
|
2018
|
60
|
64
|
111
|
13
|
81
|
43
|
20
|
104
|
80
|
44
|
65
|
59
|
112
|
12
|
118
|
6
|
52
|
72
|
72
|
52
|
16
|
108
|
Table 4. Statewide and Climate Division Rankings for Precipitation (NOAA NCEI Climate at a Glance, 2018)
Snowpack
April 1st snowpack in Wyoming, the amount which is commonly used in spring stream runoff forecasts, was above normal for much of the north and west. The Upper Bear, Lower Green, Little Snake, Upper North Platte, and Sweetwater basins were about 80% to 90% of normal. The Lower North Platte was the lowest at only 70% of normal.
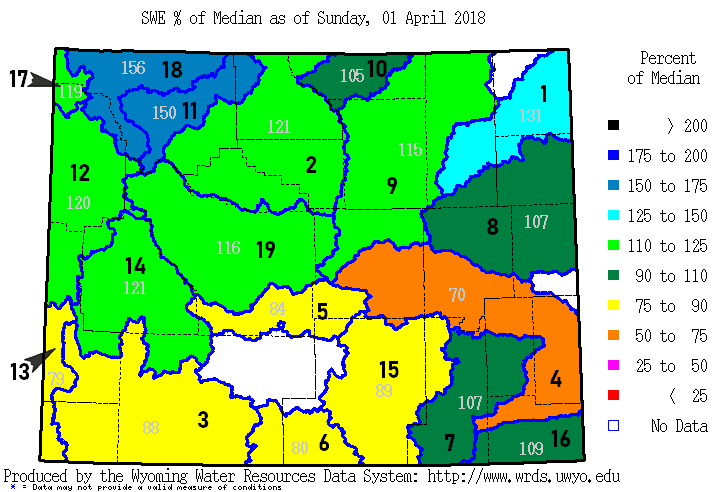
Figure 5. Basin Snow Water Equivalent Percent of Normal on the
1st of April, 2018 |
- Belle Fourche River Basin. April snowstorms pushed Snow Water Equivalent (SWE) well above normal although the start of meltout began less than a week later than the median. Final meltout took place almost exactly at the normal date.
- Bighorn River Basin. Spring snows made for an above normal snowpack and meltout began about a week later than normal. The basin was melted out almost a full two weeks before normal.
- Lower Green River Basin. Snowpack was about two inches less than normal SWE. Meltout began about two weeks later than normal but finished about a week and a half early.
- Lower North Platte River Basin. A poor snowpack reached its peak about as normal but melted out close to two weeks early.
- Sweetwater River Basin. Peak snowpack occurred about the normal time but was about three inches below normal SWE. The basin was melted out at the beginning of a June, just a few days earlier than normal.
- Little Snake River Basin. Peak snowpack was a few days later than normal but close to three inches of SWE less than normal. Meltout came a little over a week earlier than normal.
- Laramie River Basin. This basin peaked right about on schedule compared to normal. SWE was higher than normal but melted out about two weeks earlier than normal.
- Cheyenne River Basin. The basin had normal snowpack until the last week in March when storms pushed the SWE up two inches above normal. The peak came a few days later than normal and meltout finished near to the normal date.
- Powder River Basin. The peak SWE was reached a few days early but was almost three inches above normal. The basin melted out a little less than a week before normal.
- Tongue River Basin. The basin was under normal up until the first part of February. Peak SWE was more than a week later than normal and the SWE, itself, above normal. Meltout came about a week earlier than normal.
- Shoshone River Basin. The northwest part of the state received much precipitation and the Shoshone had a peak SWE that was over 12 inches above normal. The peak came at about normal and meltout ended only a day or two early.
- Snake River Basin. Peak SWE was about eight inches above normal and the peak was about a week late. The meltout date was only a few days earlier than normal.
- Upper Bear River Basin. The peak SWE in this basin was more of a plateau that spanned the normal peak date. Meltout began about a week late and finished about a week early.
- Upper Green River Basin. The peak SWE was under five inches above normal and came almost two weeks late. This was one of the few basins that melted out later than normal, although only by a few days.
- Upper North Platte River Basin. Peak SWE was just under an inch below normal and occurred right at normal. Final meltout took place more than two weeks early, though.
- South Platte River Basin. While peak SWE occurred as normal and was a bit above normal, the basin melted out about two weeks early.
- Madison-Gallatin River Basins. This basin peaked about two weeks late with about two inches of SWE more than normal. Even so, meltout occurred close to normal.
- Yellowstone River Basin. The basin had above normal SWE for the entire season. It peaked right about normal and finished meltout a few days later than normal.
- Wind River Basin. At about two inches of SWE higher than normal, the basin peaked a few days later and melted out a few days early.
Basin snowpack may be monitored using various products available at http://www.wrds.uwyo.edu/wrds/nrcs/nrcs.html
Drought
The start of the 2018 water year showed a state with three areas of drought; south central, a small portion in Goshen and Platte counties, and an area covering the far northeast part of the state (Figure 6). While the first two areas were strictly D0 (Abnormally Dry), the latter included an area of D1 (Moderate Drought) stretching across the northern parts of Campbell and Crook counties.
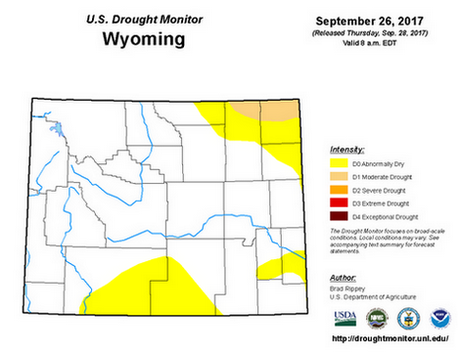
Figure 6. US Drought Monitor showing conditions at the start of Water Year 2018 | 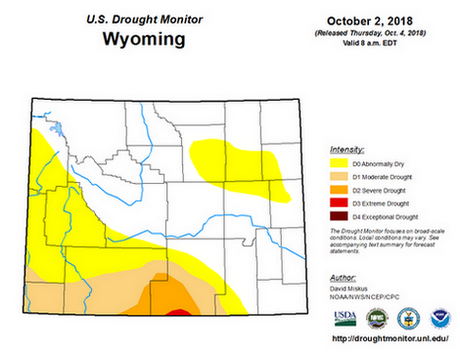
Figure 7. US Drought Monitor showing conditions at the end of Water Year 2018 |
| The U.S. Drought Monitor is jointly produced by the National Drought Mitigation Center at the University of Nebraska-Lincoln, the United States Department of Agriculture, and the National Oceanic and Atmospheric Administration. Map courtesy of NDMC.
|
After a brief expansion which saw the two eastern areas merge and cover about half of the eastern quarter of Wyoming starting in mid-December and lasting into the first part of February, only the south central drought remained by mid-April. By this time the D0 had spread all the way to the western border, covering almost all of Uinta County as well as a large portion of southern Lincoln County. Additionally, D1 formed in the central areas around the Carbon and Sweetwater county border.
High evaporative demand fueled by the warm temperatures in July and September and especially by the lack of precipitation in those months caused both the D0 and the D1 areas to continue to expand through the summer with the D1 entering southwestern Albany County by 10 July. By the end of July, D1 conditions expanded westward to the Stateline covering much of Uinta County as well as the southwest corner of Lincoln County. At the same time, D2 (Severe Drought) covered the southern two-thirds of the border area between Carbon and Sweetwater counties.
By mid-August, almost all of Sweetwater County was in D0 to D2 and D0 had spread two-thirds of the way north into Lincoln County. By the 21st of August, a swath of D0 covered the western part of the state all the way to the Montana border, although conditions quickly improved for the Yellowstone National Park area in the following weeks. In mid-September, D0 covered all of Sublette County and the far southern part of Fremont County.
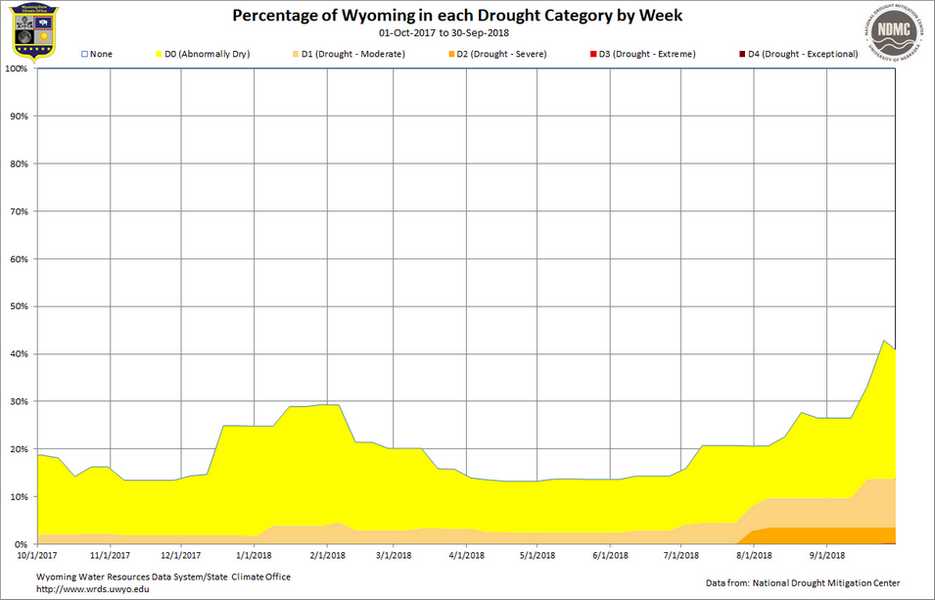 Figure 8. Timeline of drought intensities and geographic extent for Water Year 2018
The end of the 2018 water year (Figure 7) saw the first D3 (Severe Drought) in Wyoming since the 6th of September 2016. D0 conditions began to emerge in the northeast part of Wyoming again during the last week of the water year.
Figure 8 shows a timeline of drought in Wyoming during the 2018 water year. The chart shows the percentage of the state in each category of drought. Over 10 percent of Wyoming was in D0 or greater for the entire year. And about two percent of the state was in D1 or worse for the same period. The increased drought levels and area in southwest and south central Wyoming can be seen starting in the first third of July as a result of above normal temperatures and below normal precipitation amounts (Tables 1-4).
Severe Weather and Natural Disasters
Avalanches
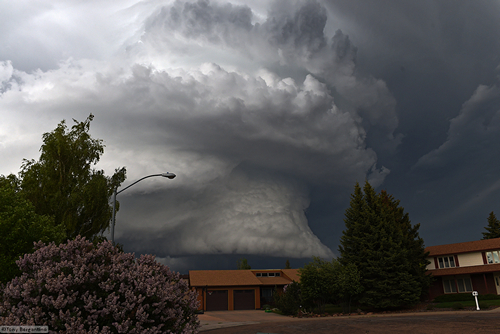
Figure 9. Mesocyclone that spawned Laramie EF3 tornado, 06 June 2018
(Photo: Tony Bergantino) |
Three fatalities were reported in Wyoming resulting from avalanches. On 29 December 2017 five snowmobilers were caught with one buried and killed. On 17 February an avalanche caught and killed a skier near Wilson. On 22 April a snowmobiler was caught and killed west of Togwotee Pass.
Tornadoes
Thirteen tornadoes were reported in Wyoming between late May and the end of July. Almost three times as many warnings were issued this year compared to the average of 19 per year from 2006 to 2017. Three of the thirteen tornadoes were EF3 and two were rated at EF2. The EF3 tornadoes were the first confirmed tornadoes of that intensity since 1987 when the state.s lone F4 tornado went through Teton County. Since the start of records in 1950, Wyoming has only had a dozen EF3 or greater tornadoes. The EF3 in Laramie on the 6th of June was the strongest ever in Albany County dating back to 1950. The map in Figure 10 shows the dates and locations of confirmed tornadoes in Wyoming during the 2018 tornado season.
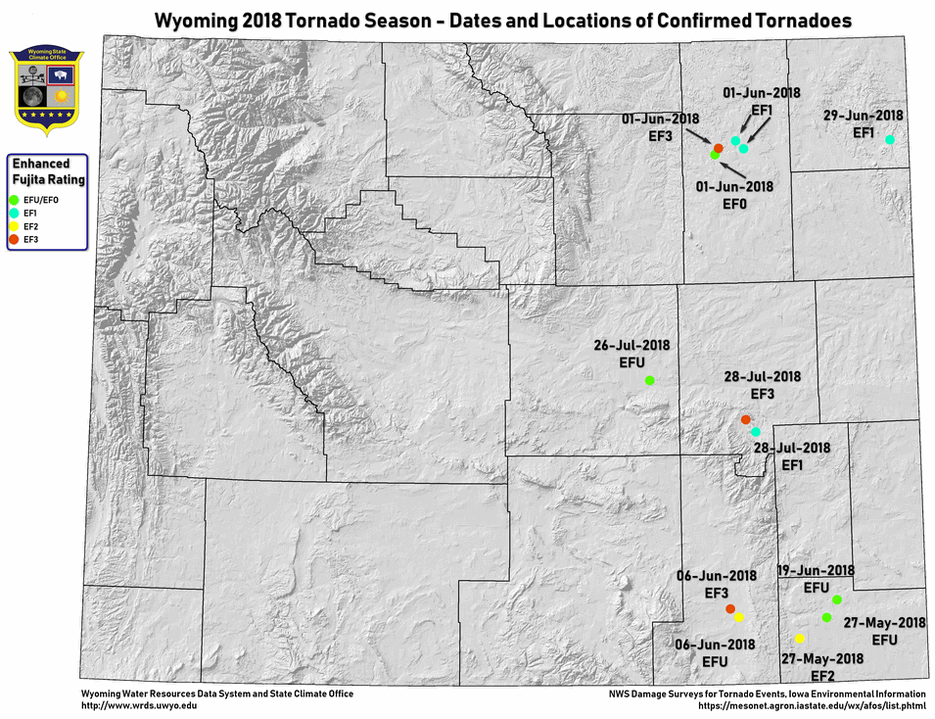 Figure 10. Map showing locations, intensities, and dates of tornadoes in Wyoming during the 1918 season (NWS Damage Surveys)
Hail
Numerous hail storms impacted the state in 2018 and, while most of these were on the eastern plains, Fremont, Sweetwater, Hot Springs, Park, Big Horn, Sublette, and Washakie counties were not without incidents. Lusk saw a particularly severe storm on the 24th of July when hailstones up to 1.75. in diameter caused property damage across the town. On the 26th of July severe thunderstorms hit Lovell, also producing 1.75. diameter hail, and causing extensive property damage. On the 27th of July, Buffalo was hit by golf-ball size hail which caused property damage in the form of broken windows, damaged siding, and, in the surrounding areas, crop damage. (NCDC Storm Events Database, 2018). The 29th of July saw Cheyenne pounded with damaging hail resulting in over a 1,000 insurance claims for property damage. (Casper Star Tribute, 2018).
Floods
A combination of rain and melting snowpack caused flooding along the Wind River in June while the Green River was also in flood stage. In Teton County, a mudslide that blocked an irrigation ditch caused flood damage to six homes south of Jackson. Rains also caused minor flooding along the Shoshone River in northern Wyoming. Rain and snowmelt also caused Ten Sleep Creek to overflow into a local campground. Heavy rains in late May caused Big Goose Creek near Sheridan to rise which caused street flooding as well as flooding of numerous basements. Additionally, thunderstorms and hail caused urban flooding in other locations such as Casper in late May, and Laramie in June. (NCDC Storm Events Database, 2018).
Fires
During the summer of 2018, much of Wyoming lay under smoke-filled skies which either blocked the sun completely or turned it into a distinct blood-red circle. Much of this smoke originated out of state from as far away as the Ranch and Carr fires in northern California.
Within the borders of the state, there were nearly 75 fires reported this season. Almost two-thirds of these were under 100 acres in size.
Another five fires were between 1,000 and 10,000 acres while the top seven ranged from 12,073 acres to the largest, the Roosevelt Fire in the far west part of the state, at over 62,000 acres. The fires combined had a total of almost 245,000 acres burned.
The 245,000 acres is almost twice the average annual acres burned over the last 16 years and 2018 had the highest number of burned acres since the 2012 Drought when almost 475,000 acres burned. In the last 16 years, 2018 had the third highest acreage, falling just below the number of acres burned in 2006.
The total number of fires per year is a bit less significant since there could be several small fires that burn less acreage than just one large fire. However, the 74 fires in 2018 was above the approximately 55 fire yearly average from 2003 to 2018, and 2018 ranked as the 6th highest in terms of fire-count.
At the end of the September, fire activity around the state was at a minimum and mostly constrained to mop-up operations.
Figure 11 below shows smoke from the Badger Creek fire drifting over Jelm Mountain southwest of Laramie. The photo was taken on the 12th of June, one day after the fire started.
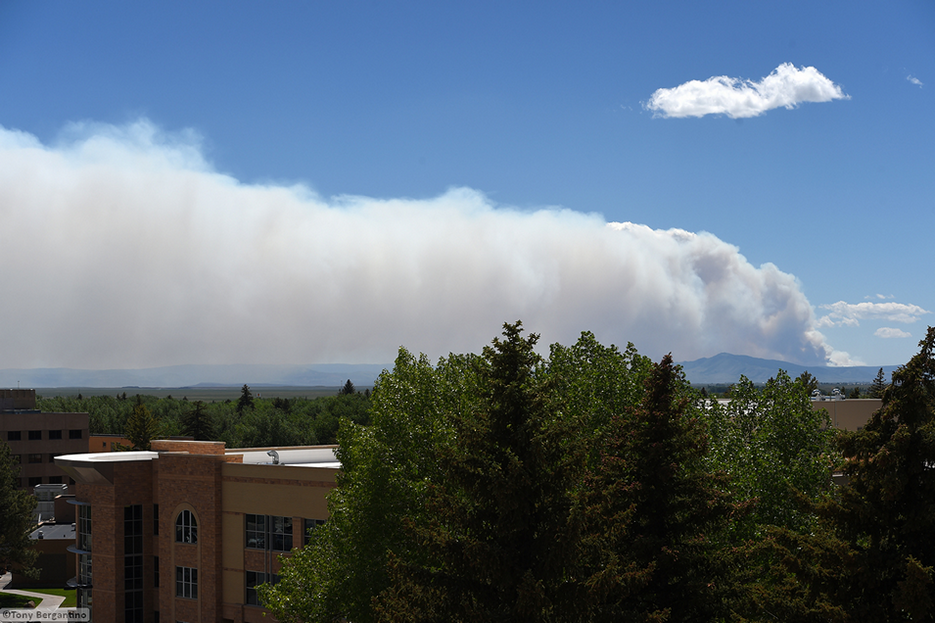 Figure 11. Badger Creek fire seen from Laramie, 12 June 2018 (Photo: Tony Bergantino)
|
Fire
|
Date Reported
|
Acres Burned
|
|
Fire
|
Date Reported
|
Acres Burned
|
|
Roosevelt
|
15-Sep-2018
|
62,042
|
|
Boxelder
|
20-Jun-2018
|
36
|
|
Terek
|
09-Jul-2018
|
47,901
|
|
Turner Draw
|
15-Jul-2018
|
33
|
|
Britania Mountain
|
28-Aug-2018
|
32,193
|
|
Basin Creek
|
28-Sep-2018
|
31
|
|
Ryan
|
16-Sep-2018
|
28,784
|
|
Skull Creek
|
13-Aug-2018
|
29
|
|
Badger Creek
|
11-Jun-2018
|
21,404
|
|
Butte
|
08-Aug-2018
|
25
|
|
Laney Rim
|
30-Jul-2018
|
13,183
|
|
Fence Creek
|
09-Jul-2018
|
25
|
|
Marten Creek
|
16-Sep-2018
|
12,073
|
|
Buffalo Creek
|
16-Jul-2018
|
24
|
|
Denver Jake
|
14-Aug-2018
|
7,247
|
|
Mckenzie
|
06-Jul-2018
|
19
|
|
Zimmerman
|
30-Jul-2018
|
6,289
|
|
Horse Pasture
|
30-Jun-2018
|
15
|
|
Black Butte
|
29-Jul-2018
|
4,937
|
|
Patterson
|
09-Jul-2018
|
14
|
|
Black Mountain
|
17-Sep-2018
|
2,100
|
|
Little Missouri
|
31-Jul-2018
|
11
|
|
Weintz
|
15-Jun-2018
|
1,990
|
|
Sulphur Creek
|
05-Aug-2018
|
10
|
|
Yellow Mountain
|
29-Sep-2018
|
482
|
|
Highway 31
|
30-Jul-2018
|
10
|
|
Alkali Flats
|
05-Jul-2018
|
434
|
|
Jake
|
22-Jun-2018
|
10
|
|
Rattlesnake
|
06-Aug-2018
|
354
|
|
Buffalo North
|
07-Aug-2018
|
9
|
|
Tater Ridge
|
08-Aug-2018
|
346
|
|
Coal Gulch
|
23-Jul-2018
|
8
|
|
Reno
|
16-Jul-2018
|
299
|
|
Big Antelope Basin
|
06-Aug-2018
|
8
|
|
Baker Cabin
|
08-Jul-2018
|
250
|
|
Beck
|
11-Jun-2018
|
7
|
|
Bixby
|
01-Aug-2018
|
247
|
|
Willow Creek
|
12-Jul-2018
|
7
|
|
Big Ridge
|
29-Jul-2018
|
205
|
|
286
|
15-Aug-2018
|
6
|
|
Red Butte
|
08-Aug-2018
|
176
|
|
Chameleon
|
30-Aug-2018
|
6
|
|
Haul
|
16-Jul-2018
|
152
|
|
Highway 2
|
06-Aug-2018
|
5
|
|
King Draw
|
14-Jul-2018
|
151
|
|
Gravel Pit
|
05-Aug-2018
|
5
|
|
Shirttail Butte
|
10-Jul-2018
|
142
|
|
Sweet Clover
|
17-Jul-2018
|
5
|
|
Hampton
|
22-Jun-2018
|
123
|
|
Geary
|
03-Sep-2018
|
4
|
|
Spotted Horse Creek
|
17-Aug-2018
|
110
|
|
Mud Lake
|
27-Jul-2018
|
4
|
|
Olmstead Creek
|
02-Jul-2018
|
105
|
|
Blue Ridge
|
06-Jul-2018
|
4
|
|
Evans Draw
|
10-Sep-2018
|
90
|
|
Shed
|
04-Aug-2018
|
3
|
|
Brush
|
12-Jul-2018
|
89
|
|
Leigh Canyon
|
15-Sep-2018
|
3
|
|
Enduro
|
06-Aug-2018
|
79
|
|
259
|
12-Sep-2018
|
3
|
|
Lower Nowood
|
06-Aug-2018
|
78
|
|
Lxr Creek
|
31-Jul-2018
|
3
|
|
North Bobcat
|
30-Jul-2018
|
65
|
|
Ek Road
|
21-Aug-2018
|
2
|
|
Diamond
|
10-Sep-2018
|
65
|
|
Cabin Camp
|
03-Jul-2018
|
2
|
|
Fire Trail
|
12-Aug-2018
|
61
|
|
Million Creek
|
11-Jun-2018
|
1
|
|
Martin
|
10-Jul-2018
|
51
|
|
Spring Creek
|
17-Aug-2018
|
1
|
|
Devils Slide
|
22-Jun-2018
|
42
|
|
Pitch Draw
|
16-Jul-2018
|
1
|
|
Coalbank
|
22-Jul-2018
|
37
|
|
Schoonover Road
|
29-Jun-2018
|
1
|