| |
 |
|
Water Resources Data System
wrds@uwyo.edu
|
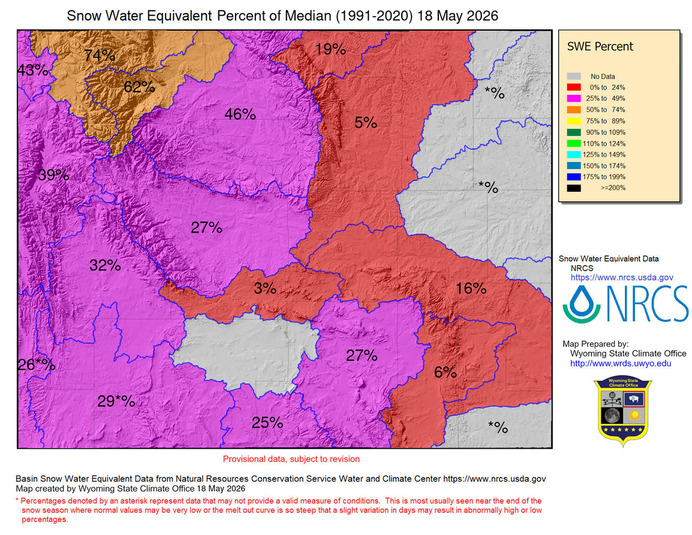
Wyoming – NRCSReport #23 Weekly Snow Report May 18, 2026
Good day to all. This is the 23rd Snow Report for Water Year 2026 (2025-2026 snow season). Currently the state’s SNOTELs are reading 33% of median with a basin high of 74% and a basin low of 3%. Last year the state was at 69%, and at 103% in 2024. The map may differ slightly from the table depending upon how many stations were reporting at the time. This report and a map displaying basin SWE percentages of median for the state may be found at: http://www.wrds.uwyo.edu/wrds/nrcs/nrcs.html.
For information on the use of median vs. average go to http://www.wcc.nrcs.usda.gov/normals/median_average.htm
SNOW WATER EQUIVALENT AS PERCENT OF MEDIAN. The following table shows the percent of median for today, the 2 previous weeks, one year ago, and two years ago for Wyoming basins. Normal (median) is based on all reporting SNOTEL sites in the basin with calculated medians (newer SNOTEL sites do not have medians figured), but does not include manually measured snow courses. The statewide SNOTEL percent of median is calculated by averaging medians for all stations associated with Wyoming basins. The weighted state average is figured using the area of basins (square miles). The reference period for computing medians is the 30-year period 1991 through 2020.
red = down blue = up green = same * Basin SWE values, close to dates of first measurable snowfall and melt-out, can be irregular or erratic
For more info contact:
Jeff Coyle Jeffrey.Coyle@usda.gov (307) 233-6787 NRCS Snow Survey 100 East B St., Room 3124 Casper, WY 82601
|
|||||||||||||||||||||||||||||||||||||||||||||||||||||||||||||||||||||||||||||||||||||||||||||||||||||||||||||||||||||||||||||||||||||||||||||||||||||||||