Water Resources Data System & State Climate Office
Water Resources Data System & State Climate Office
Water Resources Data System & State Climate Office


Wyoming Climate Atlas
 Temperature
Because of its elevation, Wyoming has a relatively cool climate ranks 41st in the US with an annual average of 45.6°F (Figure 3.1). Above the 6,000 foot level, the temperature rarely exceeds 100&def;F. The warmest parts of the state are the lower portions of the Bighorn Basin, the lower elevations of the central and northeast, and along the eastern border. The highest recorded temperature is 116°F on July 12, 1900 at Bitter Creek in Sweetwater County. The average maximum temperature at Basin in July is 92°F. For most of the state, the mean maximum temperatures in July range between 85°F and 95°F. With increasing elevation, average values drop rapidly (5.5°F per 1,000 feet). A few places in the mountains at about the 9,000 foot level have average maximums in July close to 70°F. Summer nights are almost invariably cool even though daytime readings may be quite high at times. For most places away from the mountains the mean minimum temperature in July ranges from 50°F to 60°F. Of course the mountains and high valleys are much cooler with average lows in the middle of the summer in the 30s and 40s with occasional drops to below freezing.
In the wintertime, it is characteristic to have rapid and frequent changes between mild and cold spells. Usually there are up to 10 cold waves that hit the state but frequently less than half that number for any one location in Wyoming. The majority of cold waves move southward on the east side of the Divide. Sometimes only the northeast part of the state is affected by the cold air as it slides eastward over the plains. Many of the cold waves are not accompanied by enough snow to cause severe conditions. However, blowing snow can severly reduce visibility.In January, generally the coldest month, minimum temperatures range mostly from 5°F to 10°F. In the western valleys mean values go down to about -5°F. The record low for the state was originally -66°F observed February 9, 1933 in Yellowstone Park. This record, however, is under review as the observations recorded for the Riverside station very likely were made just across the border in Montana in 1933. -63F at Moran 5WNW is the next likely contender.
To illustrate winter temperature extremes, figure 3.0 shows the average number of days per season based on an average of 28 weather stations across Wyoming for 55 winter seasons from 1948-9. By definition, in this study an extreme temperature that equals or exceeds two standard deviations based on the 55 winter average daily maximum and minimum temperatures was used. Linear trend lines show that winter extreme cold days have been diminishing from just over 4.2 days per winter to 3.2 days while extreme warm days in winter have increased from just over one day every two winters to about 1.4 days every two winters. The individual winter rankings from most warm and cold extreme number of days to least is shown in Table 3.1. While the average number of extreme maxima seasonal events varied from 2.6 days or less (i.e., 1980-1, 1994-5), extreme minima events were as high as nearly 13 days on average in 1978-9 to nearly no events in 1982-3, 1966-7, and 1999-2000. In Table 3.2, Torrington, Wheatland, Newcastle, Phillips, and Laramie (all eastern cities) have been trending towards more extreme cold days since 1948-9 while the remainder of the stations listed has shown a decreasing trend for the number of extreme cold days. The " * " for Moran shows the greatest decreasing trend of -4.5 days over 55 winter seasons. This exception can be explained in part since during the first winter of the study, there were 21 days of extreme cold. If there were about half that number, the trend would be -3.4 days while if there were no extreme cold days, the trend would be only -2.3 days. Thus caution should always be used when reviewing trends since the start and end points can cause exaggerated and skewed results. The maximum number of days of extreme temperatures during the 55 winter seasons is listed by season if two or fewer seasons had the same maximum number of days.
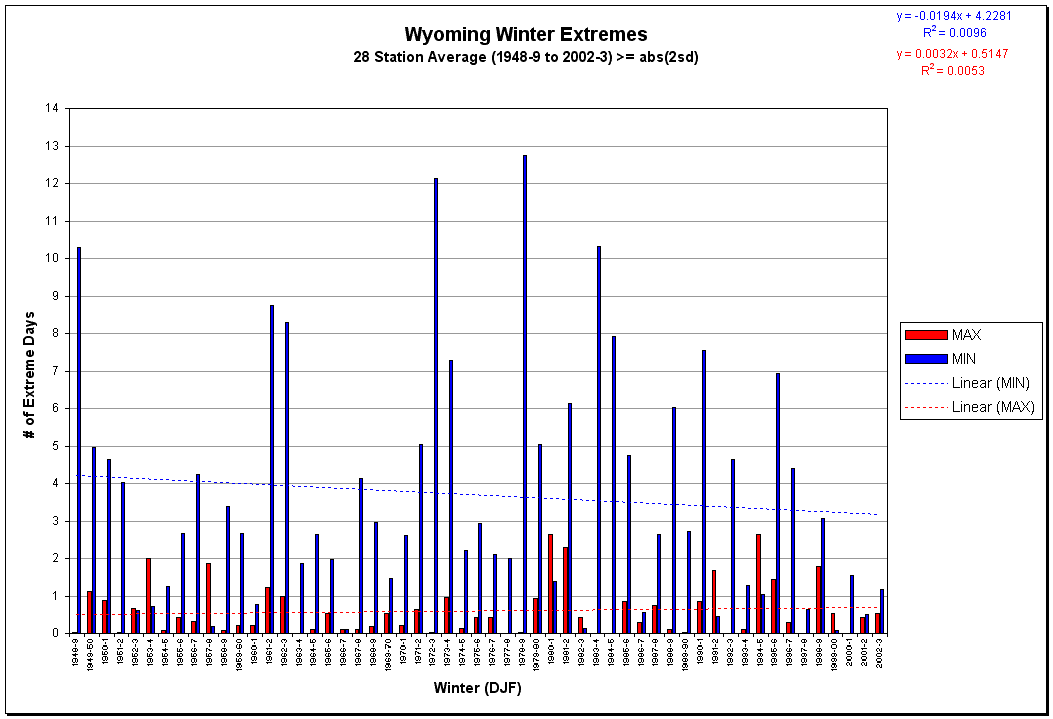
Figure 3.0. Wyoming Winter Extremes (temperatures >=ABS(2sd))
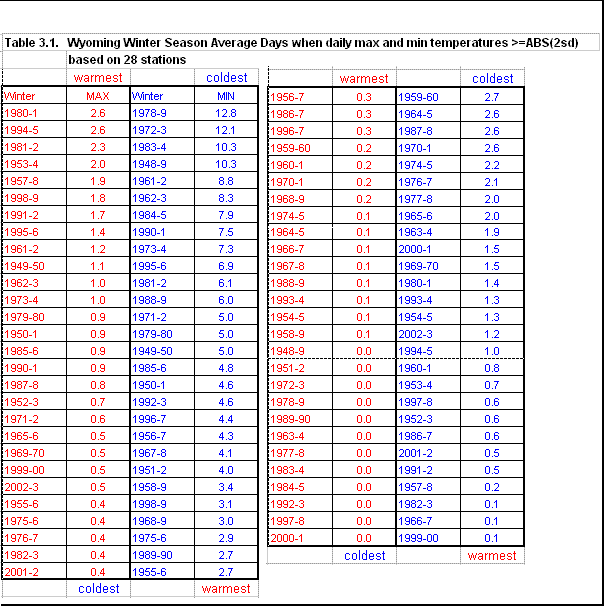
Table 3.1. Wyoming winter season average days when daily max and min temps >=ABS(2sd)
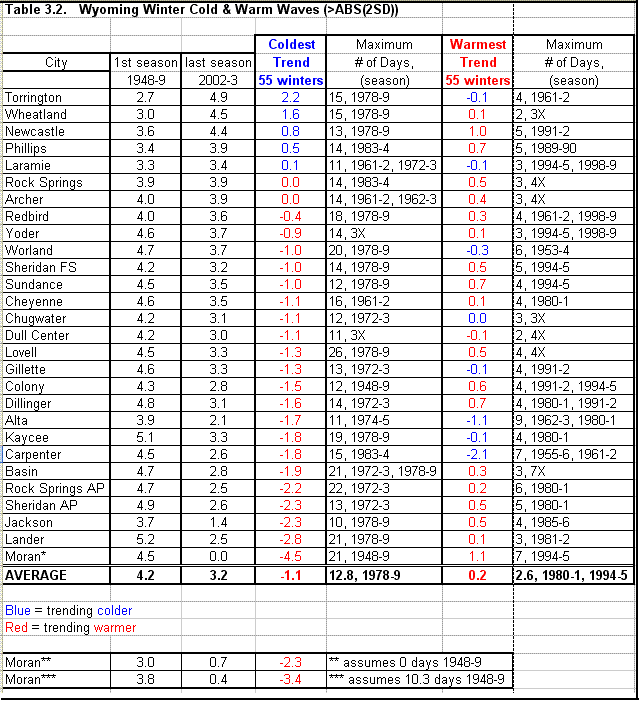
Table 3.2. Wyoming winter cold & warm waves (>ABS(2sd))
During warm spells in the winter, nighttime temperatures frequently remain above freezing. Chinooks, warm downslope winds, are common along the eastern slopes.
Numerous valleys provide ideal pockets for the collection of cold air drainage at night. Protective mountain ranges prevent the wind from stirring the air, and the colder, heavier air settles into the valleys often resulting in readings well below 0°F. It is common to have temperatures in the valleys considerably lower than on the nearby mountainside. Big Piney, in the Green River Valley, is such a location.
Mean January temperatures in the Bighorn Basin show the variation between the lower and upper parts of the valley. At Worland and Basin in the lower portion of the Bighorn Basin, not far from the 4,000-foot level, the January mean minimum temperature is 0°F, while Cody, close to 5,000 feet on the west side of the valley, has a January mean minimum of 11°F. January has occasional mild periods when maximum readings will reach the 50s °F; however, winters are usually long and cold.
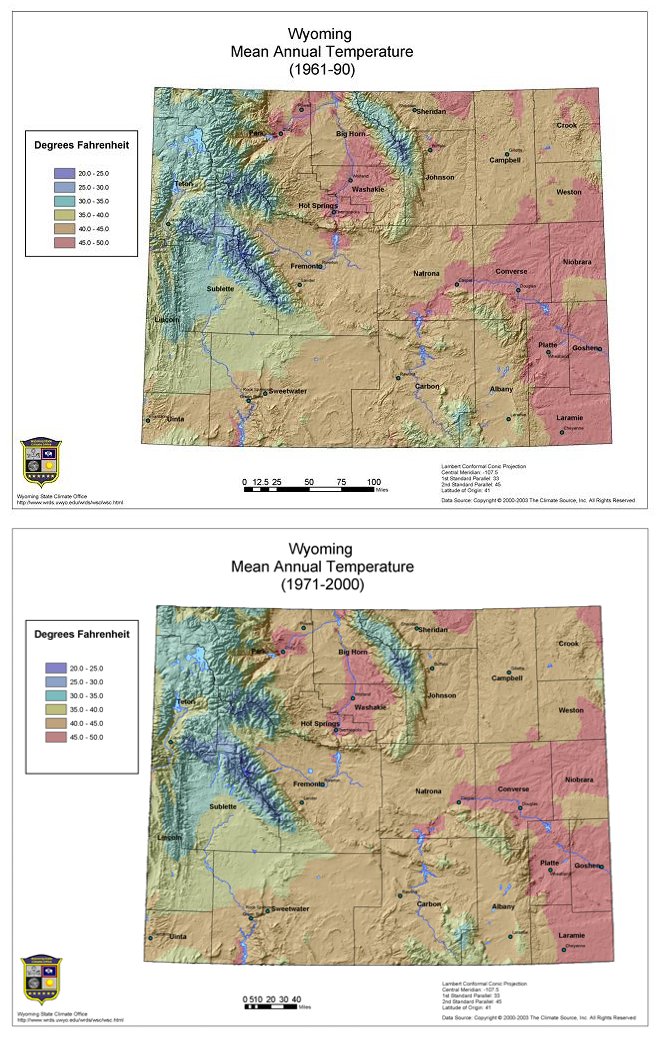
Figure 3.1. Annual average temperature in Wyoming (PRISM)
Discussion about temperature records is always of interest to the general public or special interest groups. Many a bet has been waged during coffee breaks and many are surprised by the answers. For example, Wyoming has experienced a temperature span of over 180°F between its all time highest and lowest readings (Table 3.A. and Table 3.B.).
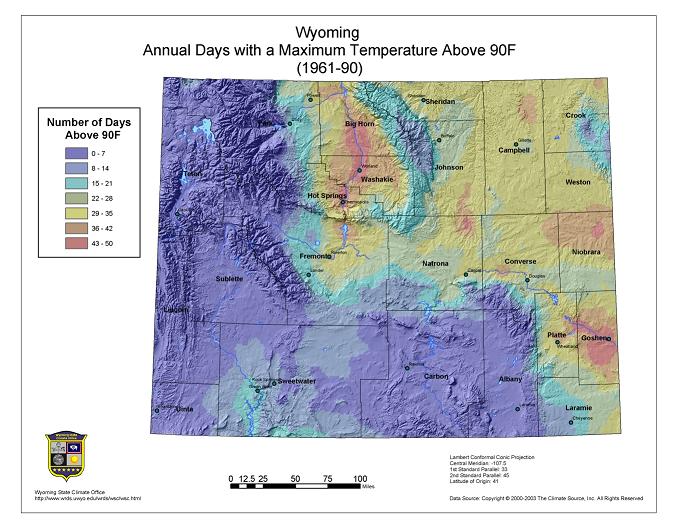
Figure 3.2. Average number of days each year with temperatures above 90°F in Wyoming (PRISM, 1961-90)
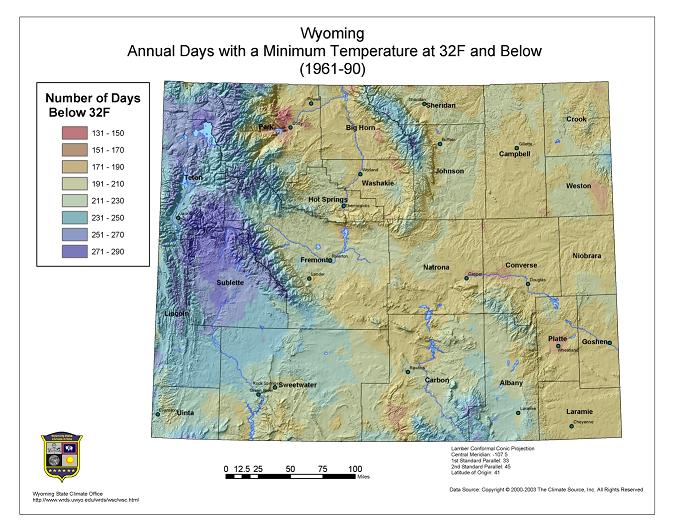
Figure 3.3. Average number of days each year with temperatures of 32° F or lower in Wyoming (PRISM, 1961-90)
In Figure 3.2 and Figure 3.3, the average number of days with temperatures warmer than or equal to 90°F and equal to or cooler than 32°F are shown. Excessively hot days are rare at higher elevations but are common in the Bighorn Basin and eastern plains (>40 days). Days with freezing temperatures or colder exceed 228 days in the mountains but only about half that amount over portions of the eastern plains and central river basins.
Table 3.A. Wyoming temperature records (° F)
|
Record Highest |
116 |
12 Jul 1900 |
Bitter Creek |
|
Record Lowest |
-66 / -63 |
9 Feb 1933 |
Riverside R.S. (under Review) -63F at Moran 5WNW is the next lowest |
|
Highest Average Annual Temp |
49.9 |
|
Lingle 2 S |
|
Lowest Average Annual Temp |
30.8 |
|
Darwin Ranch |
|
Consecutive Days Max >= 90 |
41 days |
Jul-Aug 1964 |
Basin |
|
Consecutive Days Min <= 32 |
277 days |
Oct 67-Jul 68 |
Kendall |
Table 3.B. Wyoming monthly record temperatures (° F)
|
Jan |
72 |
1981 |
Recluse 14NNW* |
-61 |
1875 |
Fort Sanders |
|
Feb |
79 |
1995 |
Weston* |
-66 / -63 |
1933 |
Riverside RS (Under Review) / Moran 5WNW |
|
Mar |
86 |
1907 |
Pine Bluffs |
-50 |
1906 |
Snake River YNP |
|
Apr |
93 |
1948 |
Basin |
-29 |
1920 |
Lake Yellowstone |
|
May |
101 |
1934 |
Sundance* |
-8 |
1912 |
Foxpark |
|
Jun |
114 |
1988 |
Whalen Dam |
5 |
1978 |
Burgess Junction |
|
Jul |
116 |
1900 |
Bitter Creek* |
10 |
1911 |
Lolabana Ranch |
|
Aug |
115 |
1983 |
Basin |
7 |
1910 |
Fountain Hotel YNP |
|
Sep |
108 |
1978 |
Colony |
-15 |
1983 |
Big Piney |
|
Oct |
98 |
1947 |
Hampshire* |
-33 |
1917 |
Soda Butte YNP |
|
Nov |
86 |
1914 |
Wheatland |
-46 |
1976 |
Darwin Ranch |
|
Dec |
78 |
1939 |
Sheridan* |
-59 |
1924 |
Riverside RS |
(* = on more than one occasion)
Heat Stress Index is defined as the combination of high temperature and humidity that humans can physically tolerate. In the US, extreme heat may have a greater impact on human health (Kalkstein and Davis, 1989), especially among the elderly (Changnon et al., 1996), than any other type of severe weather. The combined effects of temperature and humidity cannot be directly measured but can be assessed by a calculation of an "apparent temperature" (A).
Ignoring wind effects, one can estimate apparent temperature as:
where T is ambient air temperature (°C), e is water vapor pressure (kPa) (Steadman, 1984).16
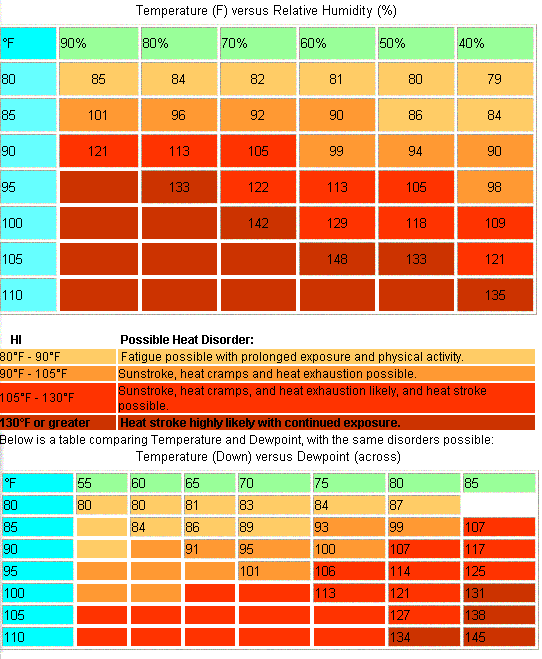
Figure 3.4. NOAA's Heat Index table
The apparent temperature of "how hot it feels" should not be confused with the Heat Index 17 (Figure 3.4) used by NOAA's National Weather Service. Because the latter index is not defined for temperature below 80°F (27°C) and relative humidity below 40 percent, it is not suitable for compilation of a climatology. To include values below these limits would be a misuse of the Heat Index, but rejecting those conditions would introduce bias. Therefore employment of the Steadman (1984) apparent temperature is used. Table 3.C. shows the heat stress index for five Wyoming cities. For each station, three-hourly July and August data for 1961-1990 were used to determine the 85th percentile values of daily average, daily minimum, and daily maximum ambient temperature and apparent temperature in °F. The 85th percentile values have been shown to be closely correlated with weather-related mortality statistics (Kalkstein and Davis, 1989). These conditions are exceeded on average about a dozen days during July and August. In several instances, the apparent temperature is lower than the actual temperature because of very low relative humidity.
Table 3.C. Threshold values of apparent and actual temperatures
|
HEAT STRESS INDEX (threshold) |
Apparent T thresholds (° F) |
Actual T thresholds (° F) |
|
avg, max, min |
avg, max, min |
|
|
CHEYENNE |
71.0, 83.2, 59.6 |
72.4, 86.6, 59.6 |
|
LANDER |
73.3, 85.7, 62.1 |
75.5, 89.5, 63.0 |
|
ROCK SPRINGS |
69.0, 81.6, 57.5 |
71.7, 85.9, 58.3 |
|
SHERIDAN |
74.6, 88.7, 61.0 |
76.0, 92.1, 60.9 |
|
CASPER |
73.5, 86.7, 60.7 |
75.5, 90.8, 60.7 |
Early freezes in the fall and late freezes in the spring are typical in Wyoming. This results in long winters and short growing seasons. Wyoming is in a region of the Country where frequent variations from cold to mild periods, especially in the fall and spring occur. The average growing season (freeze-free period) for the principle agricultural areas is approximately 125 days (Figure 3.5).
For hardier plants which can stand a temperature of 28°F or slightly lower the growing season in the agricultural areas east of the Divide is approximately 145 days.18
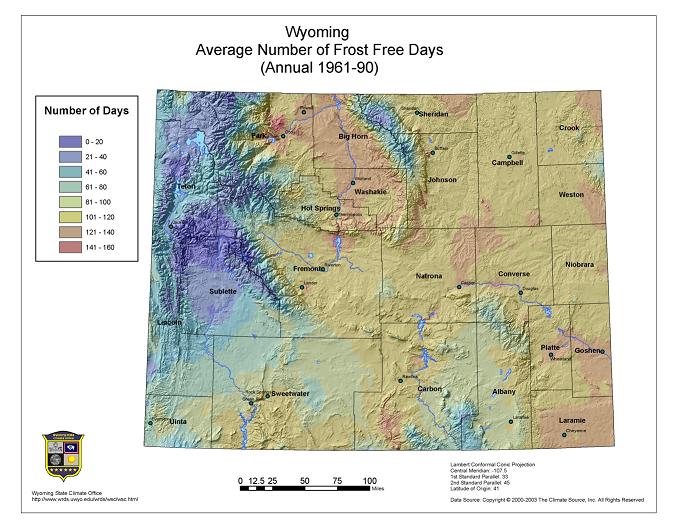
Figure 3.5. Mean number of annual frost free days in Wyoming (PRISM, 1961-90)
In the mountains and high valleys freezing temperatures may occur any time during the summer. For tender plants there is practically no growing season in such areas as the upper Green River Valley, Star Valley and Jackson Hole. Sandy Creek a tributary of the Green River near Farson, has an average of 42 days between the last temperature of 32°F in early summer and the first freeze in late summer. For the places like Star Valley and Jackson Hole, the growing season is even shorter. The earliest and latest expected freezing dates across Wyoming are shown in Figure 3.6 and Figure 3.7.
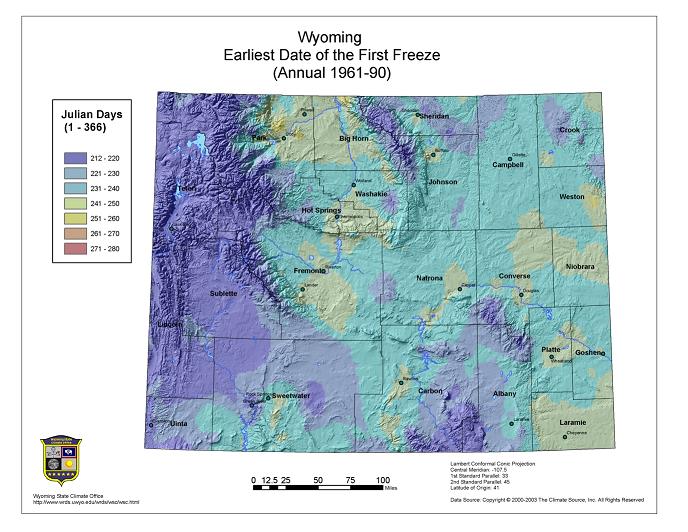
Figure 3.6. Earliest expected freezing date in Julian Days 19,20 (PRISM, 1961-90)
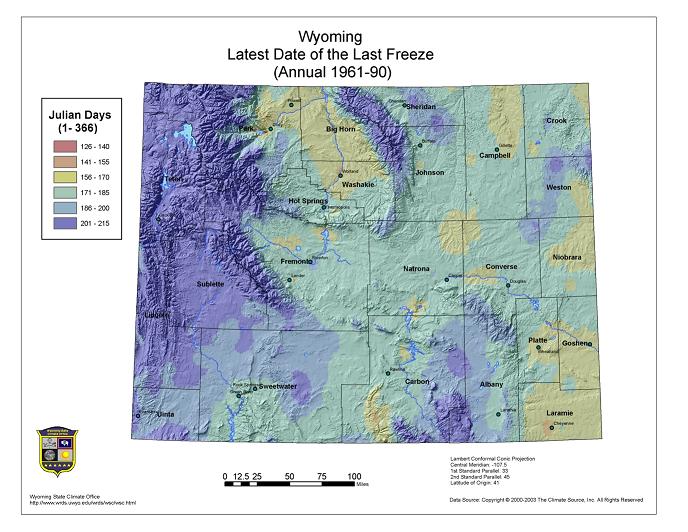
Figure 3.7. Latest expected freezing date in Julian Days (PRISM, 1961-90)
Temperatures that cause freezing injury to winter wheat at different growth stages is shown in Figure 3.7a. Winter wheat rapidly loses hardiness during spring growth and is easily injured by late freezes. Snow cover helps to protect (insulate) plants when temperatures fall below certain thresholds. Winter wheat is grown primarily over northeast and southeast Wyoming.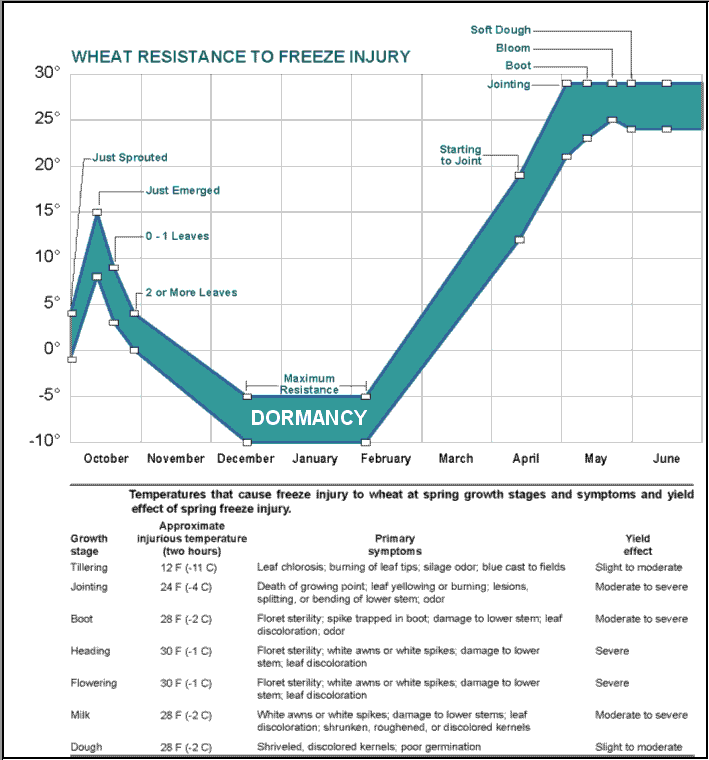
Figure 3.7a. Wheat resistance to freeze injury (courtesy, AG Experimental Station & Cooperative Extension Services, Kansas State University, Manhattan, KA; adapted from A.W. Pauli)
AgriMet uses an agronomically accepted algorithm for computing growing degree days that provides a means of evaluating the progress of the growing season.
The formula is essentially:
(Max Air Temp + Min Air Temp) / 2 - Base Temperature (50°F)
where Max Air Temp is capped at 86°F and Min Air Temp is capped at 50°F.
Temperatures above 86°F are not always beneficial to plant growth (and can be stressful) while temperatures below 50°F do not "detract" from any heat energy available to the plant. Let's take an example where the Max Air Temp is 90°F for the day and the Min Air Temp is 45°F. Since these values are outside of the upper and lower limits, they are reset to 86°F and 50°F.
GDD = (86 +50) / 2 - 50 = 18
To understand how to plan for a typical growing season it is important to consider when the 50% threshold for frost occurs (32°F, moderate freeze 28°F, or hard freeze,24°F). In Figure 3.8, Figure 3.9, and Figure 3.10, the probability of when specific temperatures can be expected is provided. More stations are available in the accompanying CD. 21
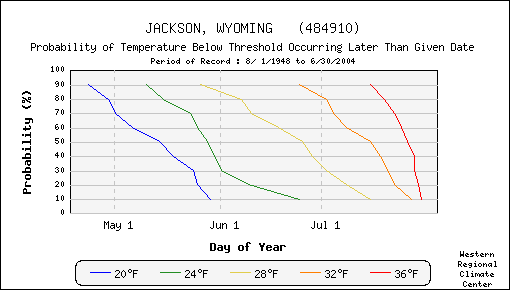
Figure 3.8. Probabilities for critical late spring temperature thresholds that have a negative impact on agriculture (Jackson, WY)
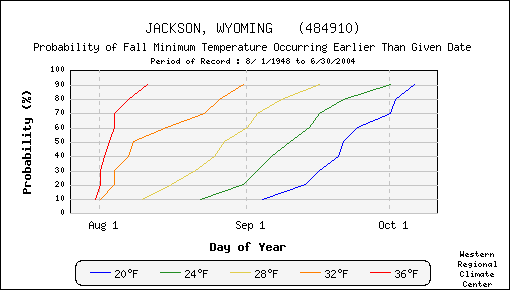
Figure 3.9. Probabilities for critical early fall temperature thresholds that have a negative impact on agriculture (Jackson, WY)
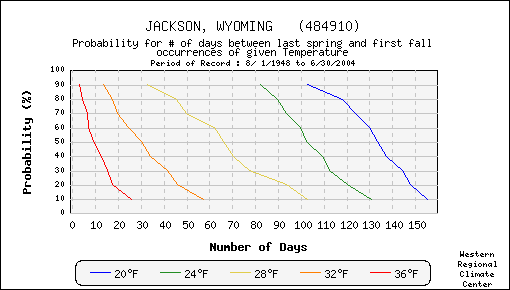
Figure 3.10. Probabilities of how long the growing season is based on critical temperature thresholds (Jackson, WY)
Figure 3.11 shows some of the typical plants that can survive in Wyoming. While this hardiness map is based on expected minimum winter temperatures, consideration should also be given to annual and seasonal precipitation totals. It should be noted that an updated version of this map22 reflecting recent warming during the past two decades is currently under review by the US Department of Agriculture.
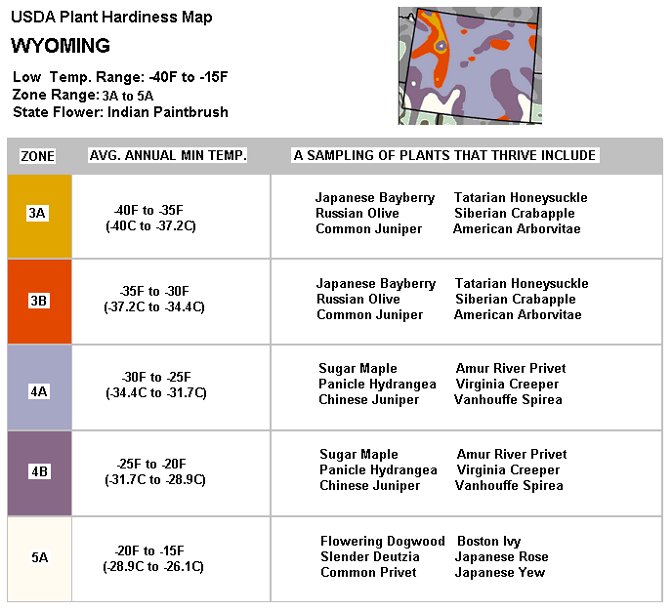
Figure 3.11. USDA Plant Hardiness Map of Wyoming
Table 3.D. presents the annual heating degree day normals to the following bases: 65, 60, 57, 55, 50, 45, and 40°F, and annual cooling degree day normals to the following bases : 70, 65, 60, 57, 55, 50, and 45°F.
These values were computed in NCDC Climatography of the United States, number 81. More stations are available in the companion CD.24
Table 3.D. Annual Degree Days to Selected Bases (1971-2000)| Degrees Days | ||||||||||||||
| Heating | Cooling | |||||||||||||
|
°F --> |
65 |
60 |
57 |
55 |
50 |
45 |
40 |
70 |
65 |
60 |
57 |
55 |
50 |
45 |
|
AFTON |
9915 |
8254 |
7320 |
6733 |
5387 |
4221 |
3223 |
13 |
74 |
237 |
399 |
544 |
1014 |
1650 |
|
ALBIN |
6836 |
5467 |
4713 |
4246 |
3189 |
2309 |
1592 |
152 |
441 |
896 |
1239 |
1497 |
2240 |
3124 |
|
ALTA 1 NNW |
9102 |
7491 |
6594 |
6032 |
4741 |
3619 |
2660 |
42 |
145 |
359 |
556 |
723 |
1247 |
1917 |
|
ARCHER |
7495 |
6038 |
5240 |
4736 |
3589 |
2620 |
1811 |
88 |
296 |
666 |
962 |
1188 |
1855 |
2660 |
|
BAGGS |
8169 |
6670 |
5856 |
5344 |
4186 |
3213 |
2406 |
39 |
196 |
520 |
802 |
1022 |
1679 |
2490 |
The most familar heating degree days (HDD) base used is 65°F. During the period from 1961-1990, the maximum expected HDD is shown in Figure 3.12. Although these values represent the expected coldest annual average temperature, it should not be inferred that all locations across Wyoming experience the coldest year during the same year.
In Figure 3.13, the maximum cooling degree days (CDD) for Wyoming is shown. Clearly, the state is divided by a line roughly from the northwest to the southeast.
Higher terrain results in fewer days that require air conditioning. Lower elevations such as in the Bighorn, Lower North Platte, Powder-Tongue, Belle Fourche, and Cheyenne River Basins are considerably hotter. As with Figure 3.12, not all locations experience the hottest summer in the same year.
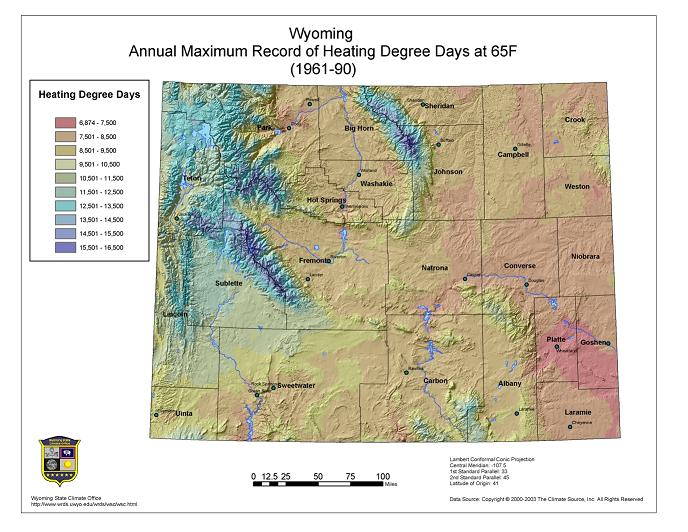
Figure 3.12. Wyoming maximum annual heating degree days (PRISM, 1961-90)
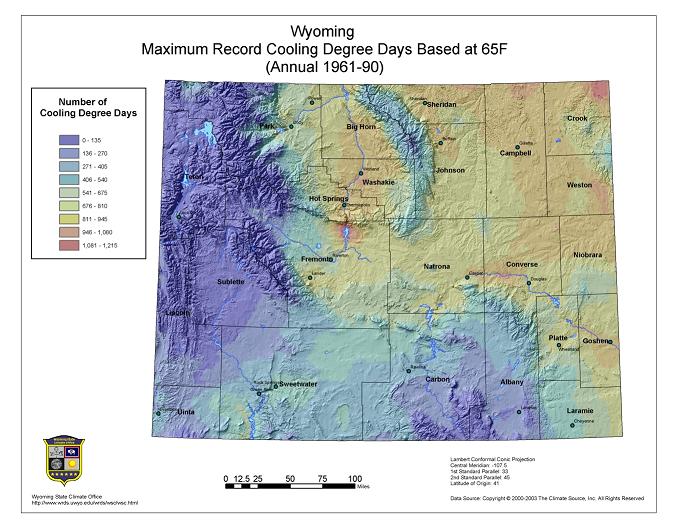
Figure 3.13. Wyoming maximum annual cooling degree days (PRISM, 1961-90)
Temperature data can be viewed and used in many ways. For statewide data where weather stations are unavailable, the high resolution PRISM25 data provides a good means for estimating actual climatology. In Figure 3.14 and Figure 3.15, the record annual minimum and maximum temperatures are shown. In Figure 3.16, daily maximum and minimum temperatures for Wheatland are based on frequency of occurrence throughout the year. This can give one an overview of how often certain temperatures could be expected. Note that nearly 9% of the time, maximum temperatures have exceeded 100°F while minimums have exceeded 70°F more than 3%. However, more detail is provided in Figure 3.17 by showing the frequency of average weekly temperatures for specific weeks throughout the year.
For example, during the hottest period in July, between 30-40% of the time, the average temperature is between 74°F and 77°F, but less than 10% of the time falls below 68°F. Finally, in Figure 3.18, the daily mean maximum, mean minimum, and extremes (records) provide yet another way to summarize a station's temperature climatology. More stations are available in the accompanying CD.26
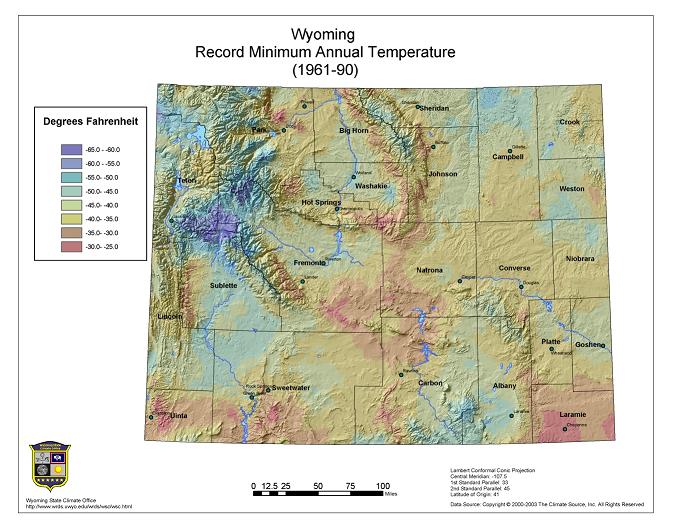
Figure 3.14. Annual record minimum daily temperature in Wyoming (PRISM, 1961-90)
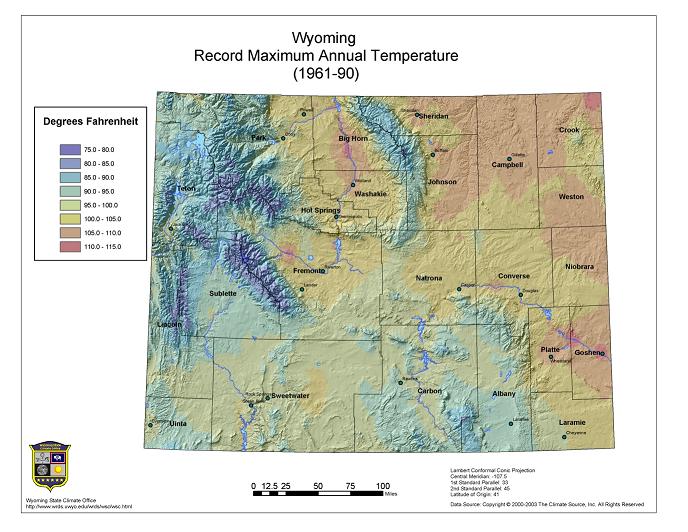
Figure 3.15. Annual record maximum daily temperature in Wyoming (PRISM, 1961-90)
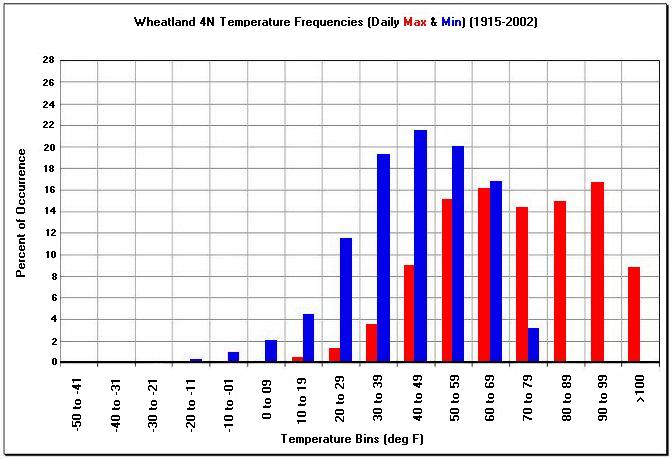
Figure 3.16. Maximum and minimum daily temperature occurrences based on 10° F bins for Wheatland 4 N
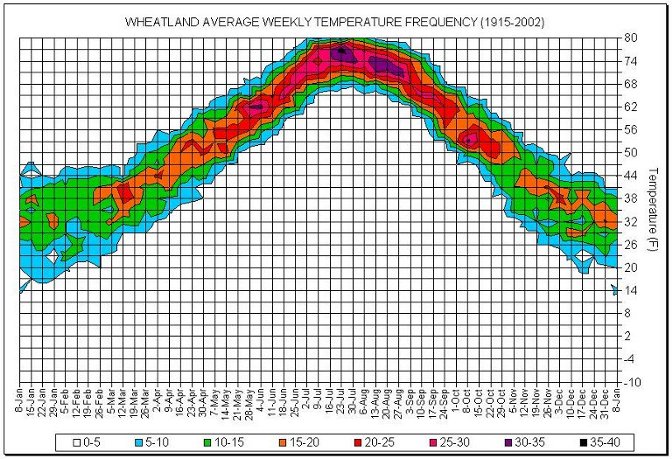
Figure 3.17. Frequency of weekly average temperatures for Wheatland 4 N (1915-2002)
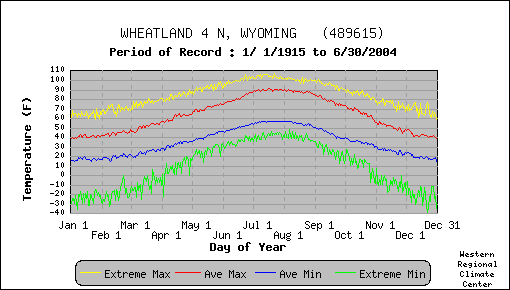
Figure 3.18. Average daily maximum, minimum, and extreme temperatures for Wheatland 4 N
The number of stations reporting hourly weather are increasing over time. Currently the stations in Wyoming officially accepted by the National Climatic Data Center are Casper, Cheyenne, Lander, Sheridan, and 15 other ASOS. WYDOT highway locations report at 15 to 20 minute intervals but these stations are not reliably continuous, routinely calibrated or properly sheltered from the elements. However, these stations nonetheless provide a valuable resource in regions of sparce weather data.
When using hourly data, interesting climatological quirks can be found. For example, by convention, average daily temperatures are based on the maximum plus the minimum divided by two. This convention may not accurately reflect the actual consumption of power required to heat or cool homes or businesses. By taking hourly temperatures each day and dividing by 24, the results show that the average annual temperature is actually 0.7°F cooler in Lander from 1961-1990 (Figure 3.19) than by taking the average from daily highs and lows.
Casper showed -0.5°F annual difference, Cheyenne showed -0.1°F difference, and Sheridan showed a +0.4°F difference. Despite these differences, taking the average from daily maximum and minimum temperatures does approximate the continuous running temperature average for most given days. Yet, perhaps this procedure could be used to filter out any global warming signature trends caused by changing cloud cover or land use changes.
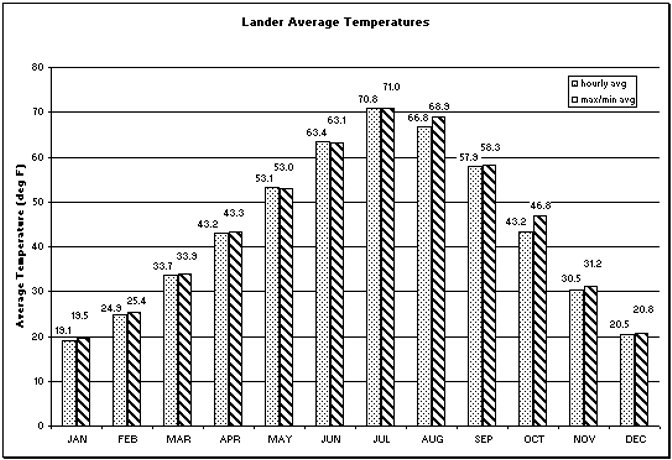
Figure 3.19. Lander's average monthly temperatures calculated hourly and from daily maximum and minimum, 1961-90
Figure 3.20, Figure 3.22, Figure 3.24, and Figure 3.26 show contoured charts of hourly average temperatures as a function of hour of day and month for Casper, Cheyenne, Lander, and Sheridan from 1961-1990. In Figure 3.21, Figure 3.23, Figure 3.25, and Figure 3.27, the monthly frequency of temperatures for the same stations show two or three periods of maximum frequencies (usually in the spring and fall with temperatures just above freezing and in the summer with temperatures in the mid 60s).
When examining hourly temperature changes at six year intervals from 1961-1995 (1990 is an overlapping year in this study), it is interesting to note that the most common temperature change actually fell within +/-1.8°F (Figure 3.28 to Figure 3.31).
Also, one would expect a normal bell shape curve distribution centered on 0°F (+/-1.8°F) hr-1 but is actually skewed towards hourly warming. This result suggests that at night when temperatures fall and the relative humidity increases, temperature change becomes more conservative.
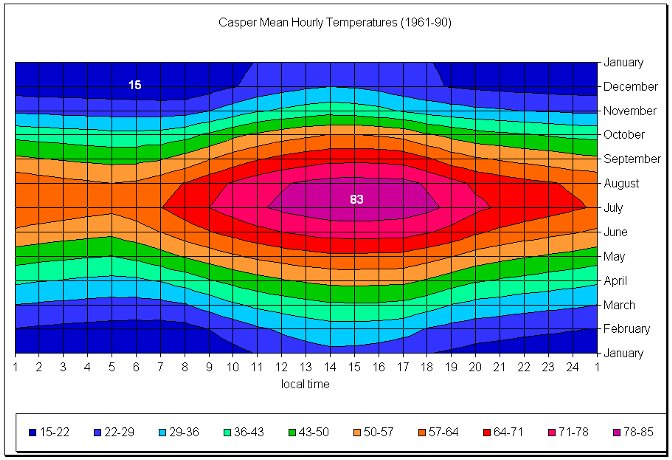
Figure 3.20. Average hourly temperature as a function of month and hour of the day at Casper (1961-1990). Numerical values are the minimum and maximum hourly averages in a year
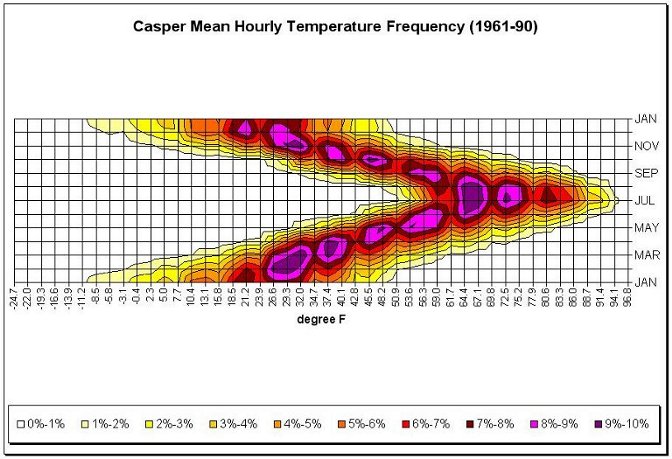
Figure 3.21. Casper monthly temperature frequency based on hourly observations from 1961-1990
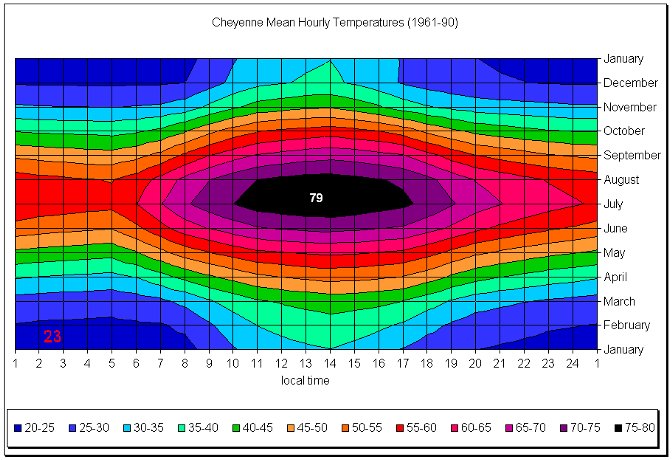
Figure 3.22. Same as Figure 3.20 except for Cheyenne
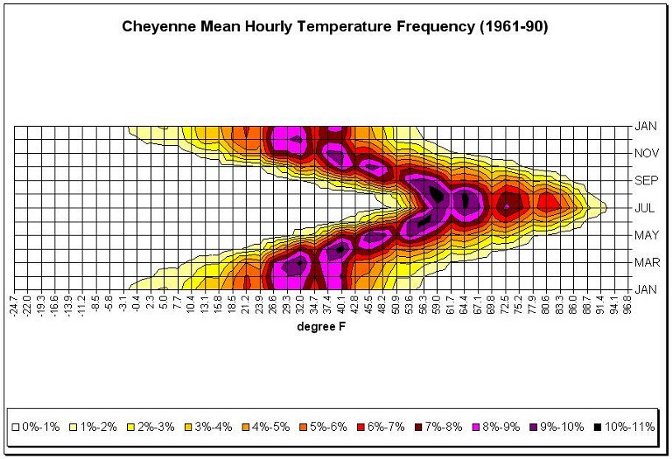
Figure 3.23. Same as Figure 3.21 except for Cheyenne
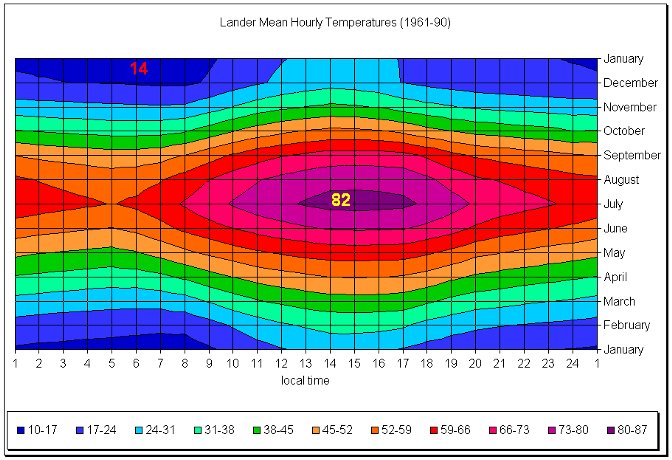
Figure 3.24. Same as Figure 3.20 except for Lander
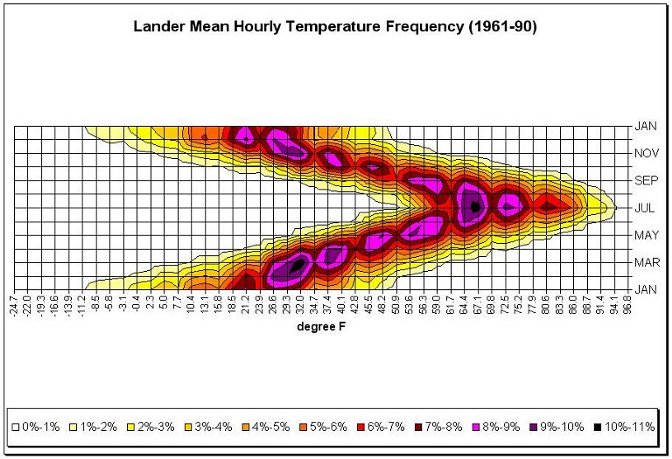
Figure 3.25. Same as Figure 3.21 except for Lander
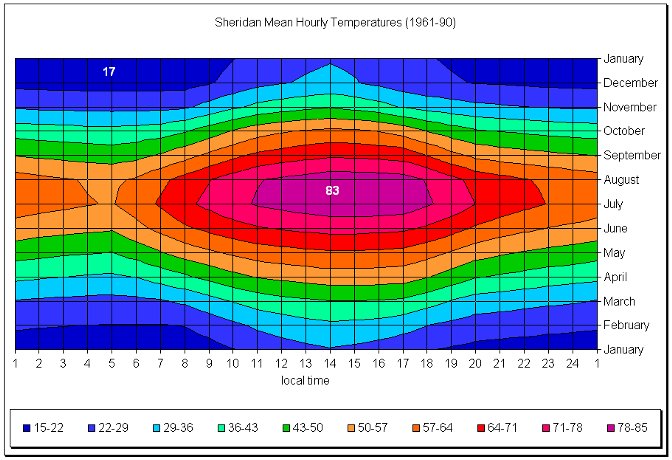
Figure 3.26. Same as Figure 3.20 except for Sheridan
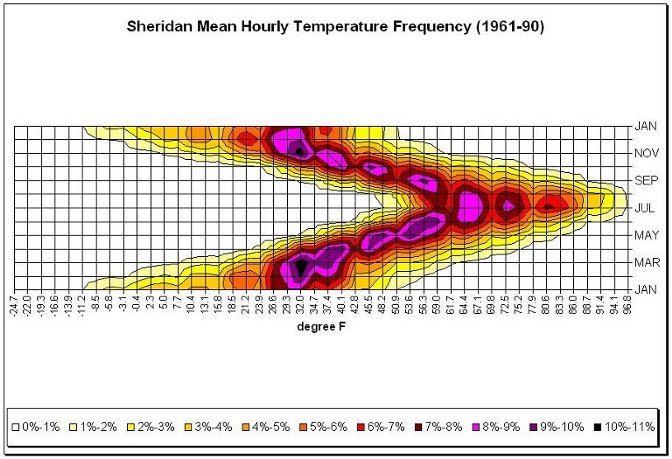
Figure 3.27. Same as Figure 3.21 except for Sheridan
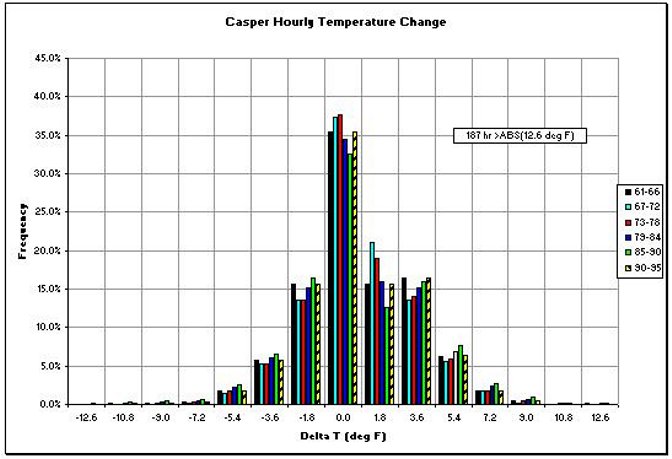
Figure 3.28. Casper hourly temperature changes based on six year intervals from 1961-1995. Temperature changes exceeding +/- 12.6° F in an hour occurred only 187 hours in 35 years.
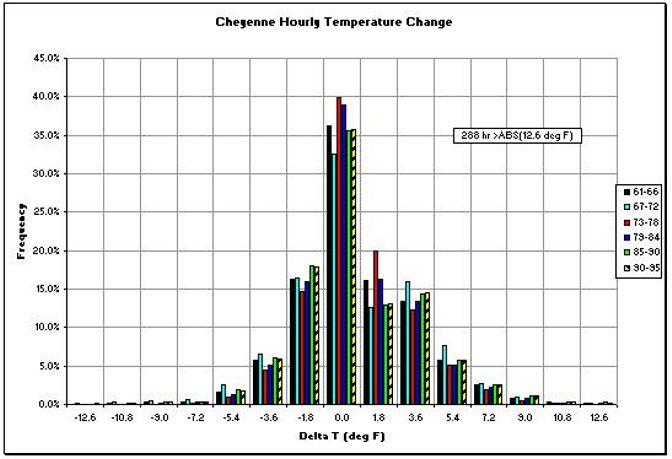
Figure 3.29. Same as Figure 3.28 except for Cheyenne. Temperature changes exceeding +/- 12.6° F in an houroccurred only 288 hours in 35 years.
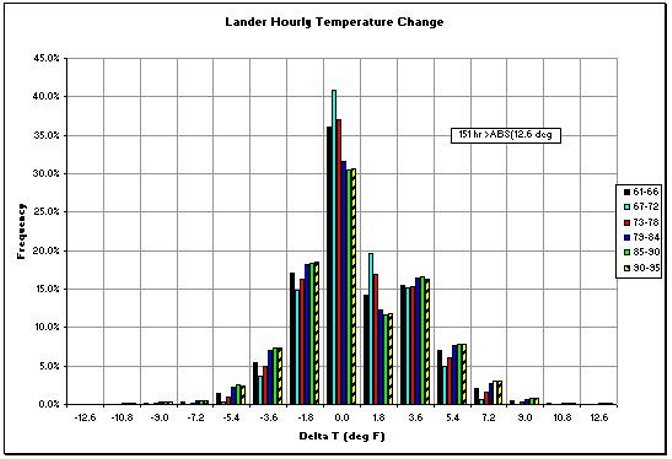
Figure 3.30. Same as Figure 3.28 except for Lander. Temperature changes exceeding +/- 12.6° F in hour occurred only 151 hours in 35 years.
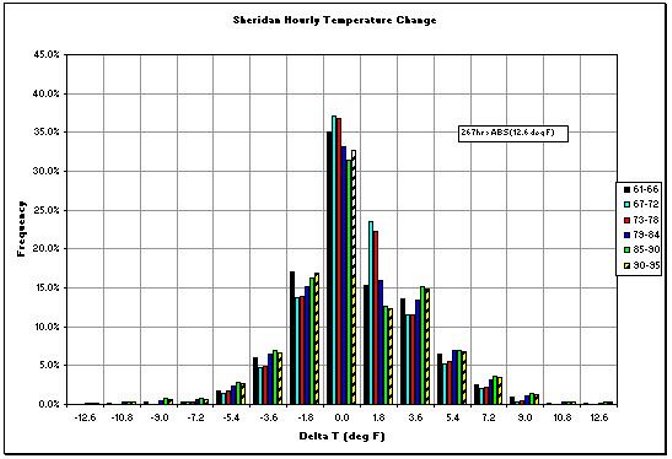
Figure 3.31. Same as Figure 3.28 except for Sheridan. Temperature changes exceeding +/- 12.6° F in an hour occurred only 267 hours in 35 years.
In Table 3.E., extreme hourly temperature changes for six year periods (1990 duplicated in this study) show that, except for the 1967-72 period when the absolute hourly extremes were relatively small, most periods show significant rapid warming and cooling in excess of 20°F. Rapid cooling was related to cold front passages in winter or afternoon thunderstorms in summer. Rapid warming was related to either a warm front passage, rapid increase in winds that helped scour out cold dense pockets of air in winter, or down slope compressional heating (chinook winds). Potential applications for this type of data involve delicate electronics at remote sites or at communication relay stations. For example, rapid changes in atmospheric density can cause unwanted refraction of laser or radar frequencies.
Table 3.E. Extreme hourly temperature changes (°F) for Wyoming's four First Class Weather Stations|
period---> |
1961-66 |
1967-72 |
1973-78 |
1979-84 |
1985-90 |
1990-95 |
|
Casper Max |
24.1 |
9.7 |
18.0 |
27.0 |
27.0 |
29.0 |
|
Casper Min |
-22.9 |
-12.4 |
-27.9 |
-32.0 |
-29.0 |
-24.1 |
|
Cheyenne Max |
20.2 |
9.4 |
16.9 |
18.0 |
25.9 |
24.1 |
|
Cheyenne Min |
-36.0 |
-9.4 |
-20.0 |
-25.7 |
-27.0 |
-26.1 |
|
Lander Max |
20.0 |
10.1 |
26.1 |
25.0 |
22.0 |
22.0 |
|
Lander Min |
-21.8 |
-9.0 |
-22.0 |
-22.1 |
-23.9 |
-22.0 |
|
Sheridan Max |
22.0 |
11.2 |
11.3 |
24.1 |
24.1 |
21.1 |
|
Sheridan Min |
-24.1 |
-10.4 |
-10.1 |
-32.0 |
-26.1 |
-22.1 |
When examining diurnal (daily) average temperature changes, the chance for temperatures exceeding +/- 10.0°F varied between 1% and 19% of the time depending on the station and time of year (Table 3.F.) In Table 3.F., daily temperatures taken from 1948-1997 (1950-1997 for Casper) show the percent of occurrence when these criteria are met.
Table 3.F. Percent frequency by month when average daily temperature changes exceed +/- 10.0°F
|
STN |
JAN |
FEB |
MAR |
APR |
MAY |
JUN |
JUL |
AUG |
SEP |
OCT |
NOV |
DEC |
|
Casper |
15.5 |
11.0 |
10.9 |
8.3 |
6.6 |
3.5 |
1.0 |
2.1 |
6.7 |
9.2 |
13.5 |
14.5 |
|
Cheyenne |
18.1 |
14.4 |
13.3 |
10.3 |
6.1 |
3.8 |
1.3 |
1.0 |
6.5 |
10.8 |
15.2 |
15.9 |
|
Lander |
14.0 |
8.4 |
8.0 |
6.9 |
5.7 |
2.7 |
0.7 |
0.7 |
4.0 |
5.4 |
8.6 |
11.7 |
|
Rock Springs |
9.2 |
4.8 |
6.2 |
4.8 |
4.7 |
2.9 |
0.5 |
0.5 |
2.8 |
3.7 |
5.1 |
7.5 |
|
Sheridan |
19.1 |
13.4 |
9.6 |
7.4 |
5.1 |
2.5 |
1.0 |
1.4 |
5.3 |
6.7 |
10.7 |
16.8 |
In recent years, two of the greatest 24-hour average temperature changes occurred between January 31 and February 1, 1989 when the average temperature dropped from +46°F to -5°F at Lander, and nearly 11 months later on December 22nd to 23rd when the average temperature rose from -15°F to +33°F at Sheridan. However, these changes pale in comparison when one looks at actual temperature changes within the same day and within 48 hours. For example, for the period from 1915 through 2001, Cheyenne had 15 days when the day's maximum minus the minimum was at least 50°F. On November 11, 1959, the maximum temperature was +56°F and the minimum was -5°F. However, looking at day one's maximum to day two's minimum, the temperature dropped from +51°F to -20°F between Februrary 5th to 6th in 1933. A remarkable +75° F temperature rise occurred from day one's minimum to day two's maximum between December 22nd to 23rd in 1989 when the temperature changed from -28°F to +47°F. In about 31,500 days, there were 126 days when the temperature dropped at least 50°F and 167 days when the temperature rose at least 50°F within 48 hours in Cheyenne.
As described above in the general description of Wyoming's temperature, an increase in elevation will result in cooler summer daytime maximum temperatures. In Figure 3.32, there is a strong correlation between temperatures above 89°F and elevation and lesser so with temperatures below 10°F. The outlier shown is Buffalo Bill Dam, which is probably the result of the terrain and close proximity to the cooler reservoir waters.
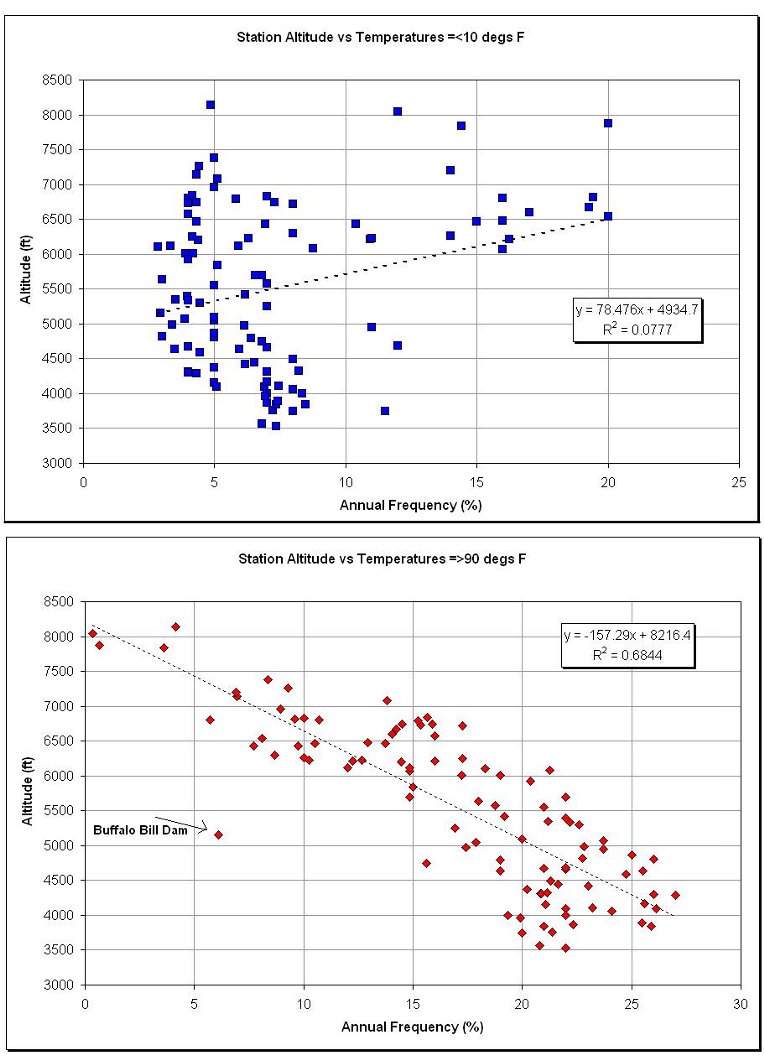
Figure 3.32. Station altitude vs. frequency of extreme temperatures based on 1961-90 weekly temperatures
It should come as no surprise that when winds blow from the south some warming can be expected. Similarly, when the winds are from the north, things should be cooler. In Figure 3.33, this is clearly illustrated. Despite the fact that Casper's prevailing winds are from the southwest, and a wide range of temperatures could therefore be expected, the highest and lowest temperatures are indeed attributable to advection of warm and cold winds, respectively. However, when downslope winds occur, warming can be expected regardless of the wind direction. These chinook winds can occur on the leeward side of the Big Horn, Wind River, and Teton Ranges.
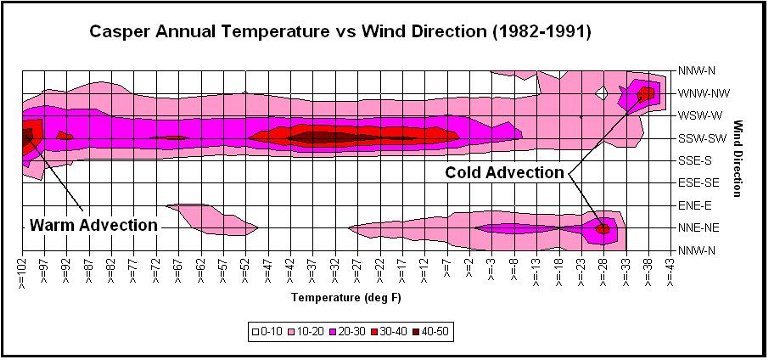
Figure 3.33. Annual frequency of temperature as a function of wind direction (%) for Casper (1982-1991)
Realtime Data pertaining to subsurface temperatures are limited to Afton (USBR, AGRIMET)27 located on the Idaho border between the Snake and Bear Rivers, and the Torrington Experimental Farm (NRCS, SCAN) 28 station located near the Nebraska border in Goshen County. Other stations, such as Archer, WSO Casper, Gillete, Powell, and Wheatland, provide daily data to the Wyoming Climate Office after the end of each month. 28a
Seed germination and plant growth in response to surface and subsurface soil temperature is important for determining potential yield (biomass). In Figure 3.34 Afton's 2-, 4-, and 8-inch depth average soil temperatures from 1992-2002 show little temperature difference between daily maximum and minimum temperatures during the cooler season, and warmer temperatures at shallower depths in the warmer season.
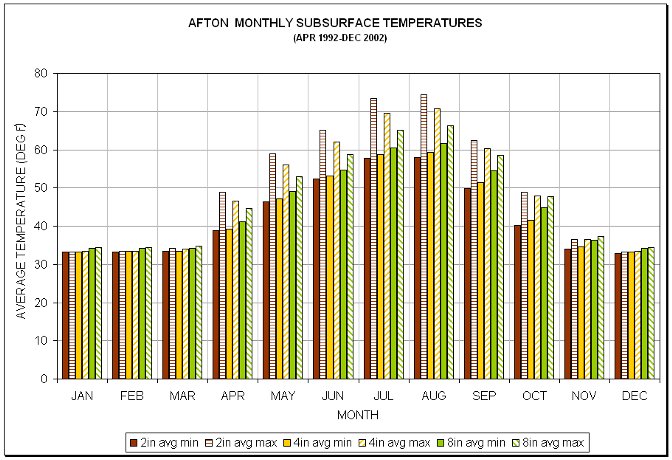
Figure 3.34. Afton, average monthly subsurface maximum and minimum temperatures for 2-, 4-, and 8-inch depth)
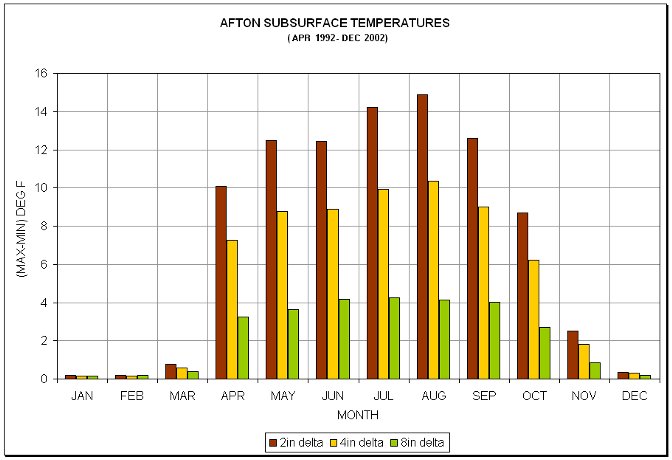
Figure 3.35. Afton 2-, 4- and 8-inch monthly average temperature differences between daily maximum and minimum
Also note that shallower depths have larger daily average temperature differences as would be expected due to the topsoil acting like a black body to the incoming solar radiation. This is illustrated in Figure 3.35. Note the large jump in temperature differences in April.
The temperature record from Torrington Experimental Farm (Figure 3.36) reveals that in the winter, warmer temperatures are experienced at depth while the reverse occurs in the summer. Also note that the deeper levels lag in response time to changing temperatures at the surface. Of course, the degree to which this happens is dependent on soil type, moisture content, and exposure. In March and April the temperature difference between one and 72-inch depths is about 5°F. However in November and December this range increases to 20°F.
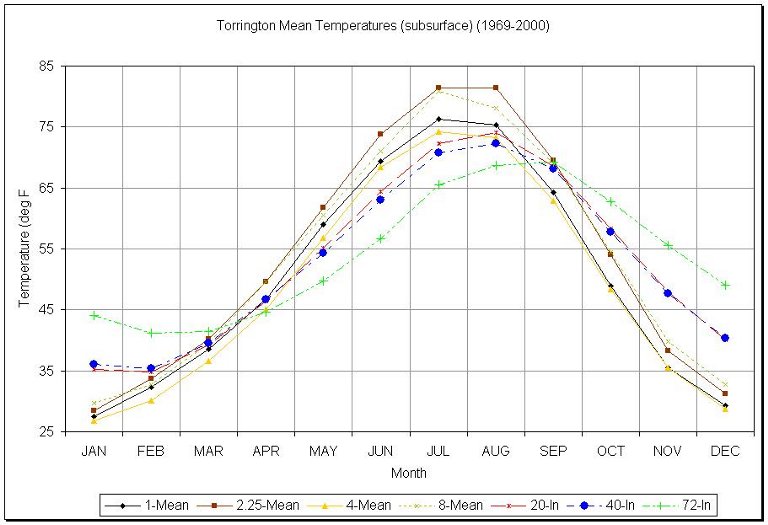
Figure 3.36. Torrington mean monthly subsurface temperatures. The 1-, 4-, 20-, and 40-inch depths are based on an average of 25 years (1969-2000). The 2.25-, 8-, and 72-inch depths are based on an average of 14 years during this same period of operation.
Additional Temperature References
Changnon, S.A., K.E. Kunkel and B.C. Reinke, 1996: Impacts and responses to the 1995 heat wave: A call to action. Bull. Am. Meteorol. Soc., 77, 1497-1506.
Gaffen, D.J., and R.J. Ross, 1998: Increased Summertime Heat Stress in the U.S. Nature, 396, 529-530.
Gaffen, D.J., and R.J. Ross, 1999: Climatology and Trends of U.S. Surface Humidity and Temperature. J. Climate, 12, 811-828.
Kalkstein, L.S., and R.E. Davis, 1989: Weather and human mortality: An evaluation of demographic and inter-regional responses in the U.S. ann. Assoc. Am. Geogr., 79, 44-64.
NREL, 1992: User's Manual - National Solar Radiation Data Base (1961 - 1990), Version 1.0. NSRDB Vol. 1, 93pp.
Steadman, R.G., 1984: A universal scale of apparent temperature. J. Climate Appl. Meteor., 23, 1674-1282.
17#. http://www.crh.noaa.gov/ict/heat.htm
18#. http://www.usbr.gov/pn/agrimet/
19#. Julian Day conversion, see: http://blightcast.coafes.umn.edu/JulianDay.htm
20#. "Julian Days" are numbered from January 1 (day 1) to December 31 (day 365 or 366 depending on leap years) each day is incremently numbered from the first day. For example January 31 would be day 31, while April 1 would be day 91 in a non-leap year, and day 92 in a leap year.
21#. CD: temperature, text, appendix_data, period_of_record, appendix_supplement_data folders
22#. see CD: Temperature, Misc, USDA_Map_3.03 (pdf version)
23#. http://www.ncdc.noaa.gov/oa/climate/normals/usnormals.html
24#. CD: appendix_data, normals_71_00, monthly_wy folders
25#. http://www.ocs.orst.edu/prism/
26#. CD: temperature folder
27#. http://www.usbr.gov/pn/agrimet/agrimetmap/aftyda.html
28#. http://www.wcc.nrcs.usda.gov/scan/site.pl?sitenum=2018&state=wy
28a#. Available on pages 17-19 of the NCDC Annual
Climatological Data publication. Free to .edu and .gov organizations.
State Climate Office | Water Resources Data System
Last Modified: Fri, 23 May 2025