| |
 |
|
| ||||||||||||
Drought Impacts and Outlook Summaries - October 2016View this Summary as a PDF
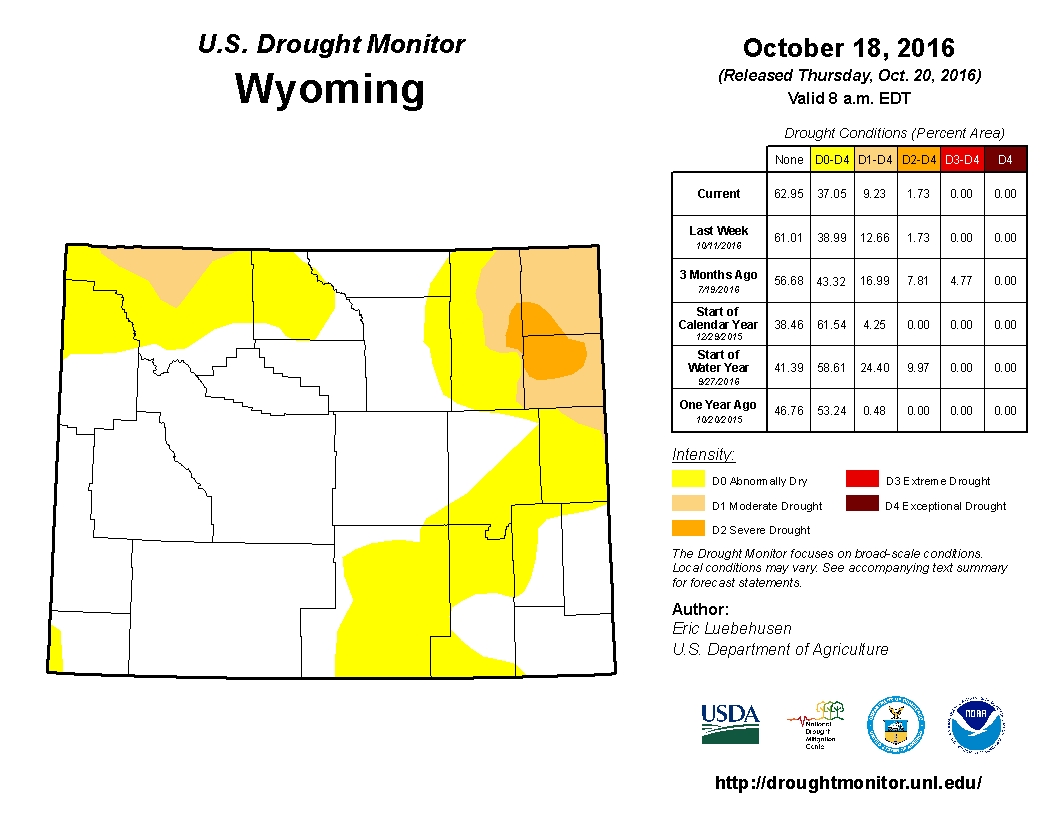
At the Climate Division level, Division 5 (approximately the area composed of Sheridan, Johnson, and northern Campbell counties) had the 4th wettest September of the last 122 years. Since early September, drought in the north and northeast has continued to lessen with Severe Drought (D2) removed from Big Horn, Park, and Teton counties as well as from Niobrara County and all but the central part of the Campbell, Crook, and Weston counties area. Moderate Drought (D1) was removed from Sheridan, Johnson, Natrona, Washakie, Big Horn, Fremont, Teton, and Lincoln counties while Abnormally Dry (D0) was removed from Lincoln, Sublette, Fremont, Washakie, Natrona, and Sweetwater counties.
Several fires are still considered to be active in Wyoming; however, their activity is now minimal and the recent precipitation (snow and rain) has been of great help.
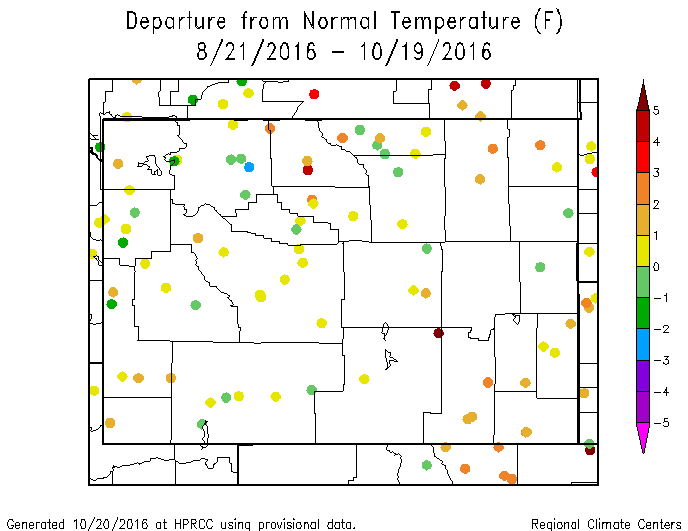
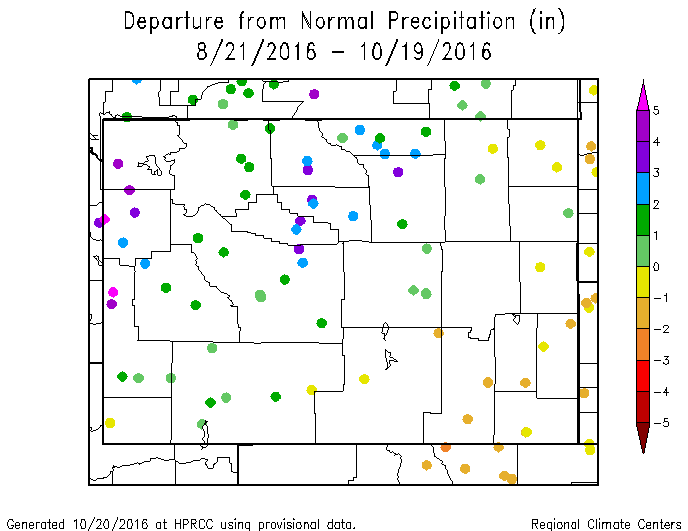
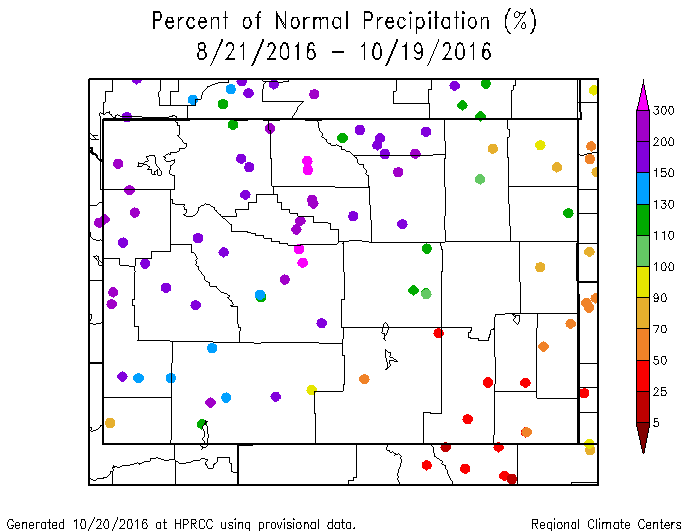
Temperature and Precipitation Anomalies Precipitation divided the state somewhat diagonally with the eastern and southern parts (Carbon, Converse, Niobrara, Goshen, Platte, Albany, and Laramie counties along with parts of Uinta, Sweetwater, Campbell, and Crook counties) being below normal while the remaining counties were above normal. Stations in the Bighorn basin were over 300% of normal for the last 60 days. Unfortunately this abundance of precipitation came too late for the 2016 season.
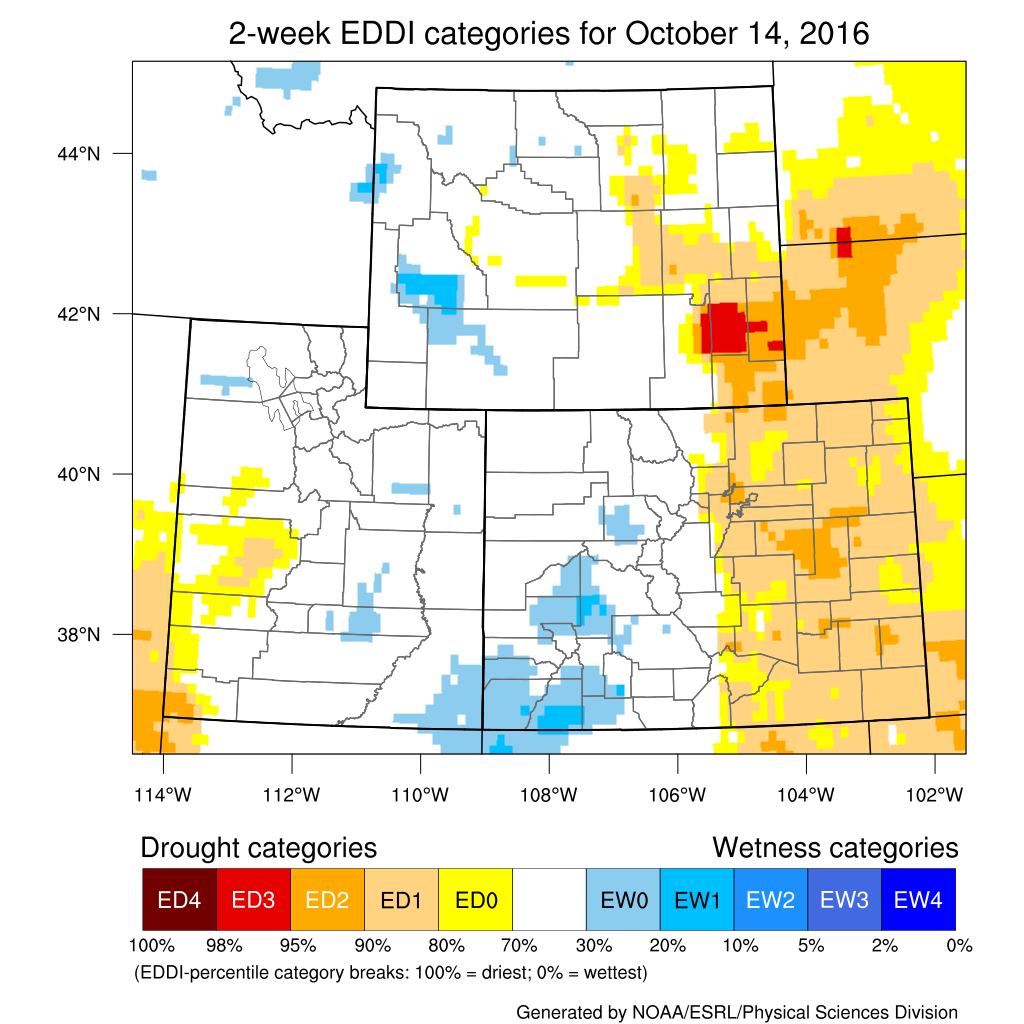
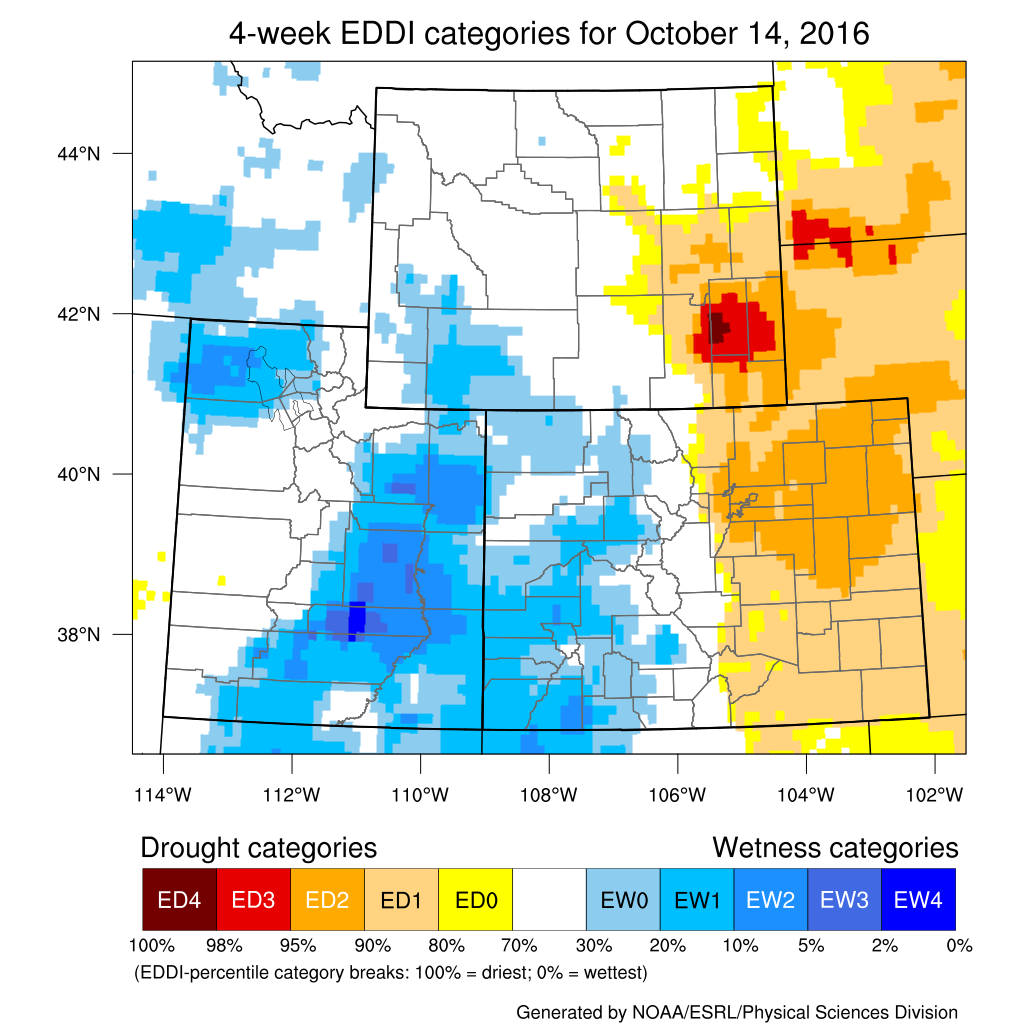
Evaporative Demand Do you have impacts to report? We need your on-the-ground reports and you can input them here: "http://droughtreporter.unl.edu/submitreport/ EDDI maps are updated on a daily basis for several timeframes. Current maps may be downloaded here: http://wwa.colorado.edu/climate/dashboard.html
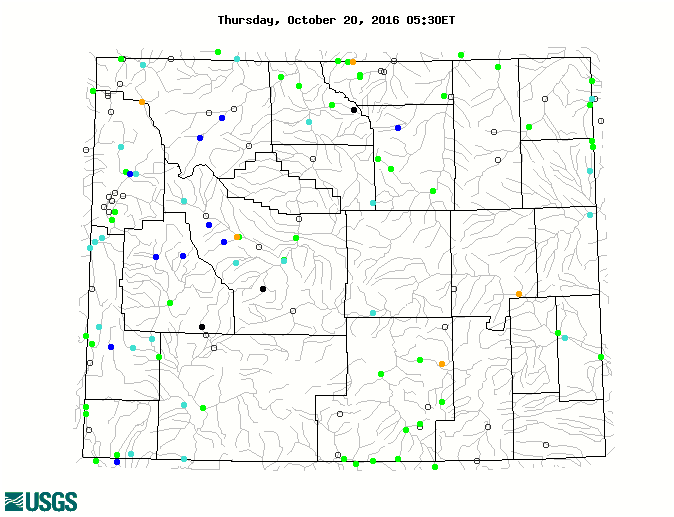
Water Resources The map below shows streamflow for October 20th compared to the historical average for this date.
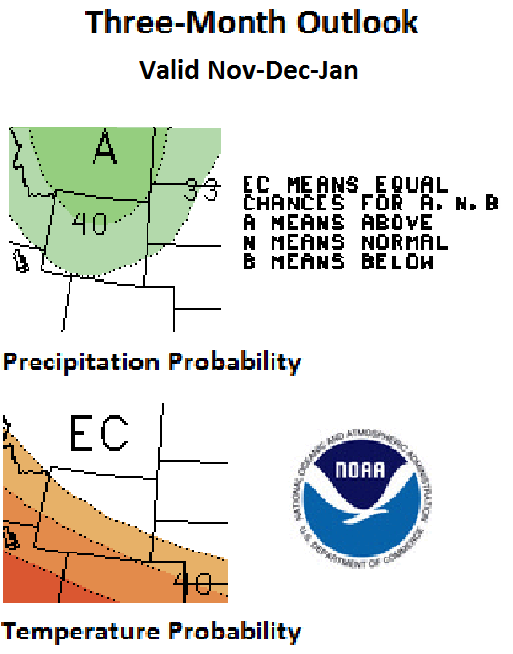
Weather and Climate Outlooks Looking further out, the Nov-Jan period has good chances for above-normal temperature for all but the northern quarter to half of the state, while precipitation is more likely to be above normal in all but the far southeast (see maps). For the Dec-Feb time span, above-normal temperatures are favored for the southwest, and it is more likely that all but the southeast will have above-normal precipitation. Although there is less certainty when looking at the first quarter of 2017, the pattern is expected to remain much the same but the above-normal temperatures are more likely in a smaller extent of the southwest. The northwestern half of Wyoming is more likely to experience above-normal precipitation. Drought conditions are expected to improve, but will likely persist in the northeast and Park County into 2017.
Summary of Conditions Precipitation for the same period has been above normal for all but Carbon, Natrona, Albany, Laramie, Goshen, Platte, Niobrara, Weston, Crook, and Converse counties. Drought conditions have improved in all parts of the state with D2 remaining in areas of Crook, Campbell and Weston counties.
Partners
Stay Tuned and In Touch Live in or around the Wind River Indian Reservation? Check out the Wind River Indian Reservation and Surrounding Area Climate and Drought Summary at: http://www.hprcc.unl.edu/pdf/Wind-River-Climate-Drought-Summary_Sep16.pdf |
||||||||||||