Water Resources Data System & State Climate Office
Water Resources Data System & State Climate Office
Water Resources Data System & State Climate Office


Station Map | WACNet Home
Week at a Glance
| Date | Tvg (F) | TMax (F) | TMin (F) | RH Max (%) | RH Min (%) | Average Windspeed (m/s) | Max Windspeed (m/s) | Precipitation (") |
| 2026-07-15 | 84.63 | 98.19 | 67.46 | 55.27 | 11.83 | 2.60 | 5.05 | 0.00 |
| 2026-07-16 | 82.76 | 96.12 | 64.92 | 59.24 | 14.99 | 1.78 | 4.55 | 0.00 |
| 2026-07-17 | 82.38 | 96.57 | 64.99 | 74.64 | 17.61 | 1.33 | 4.25 | 0.00 |
| 2026-07-18 | 83.26 | 96.73 | 66.56 | 61.40 | 16.55 | 2.07 | 6.09 | 0.00 |
| 2026-07-19 | 83.62 | 98.62 | 67.06 | 87.30 | 13.66 | 3.22 | 5.25 | 0.00 |
| 2026-07-20 | 84.31 | 98.49 | 71.22 | 46.78 | 19.84 | 1.76 | 5.48 | 0.00 |
| 2026-07-21 | 83.39 | 99.03 | 67.03 | 52.42 | 17.92 | 1.68 | 4.81 | 0.00 |
Click Image to Enlarge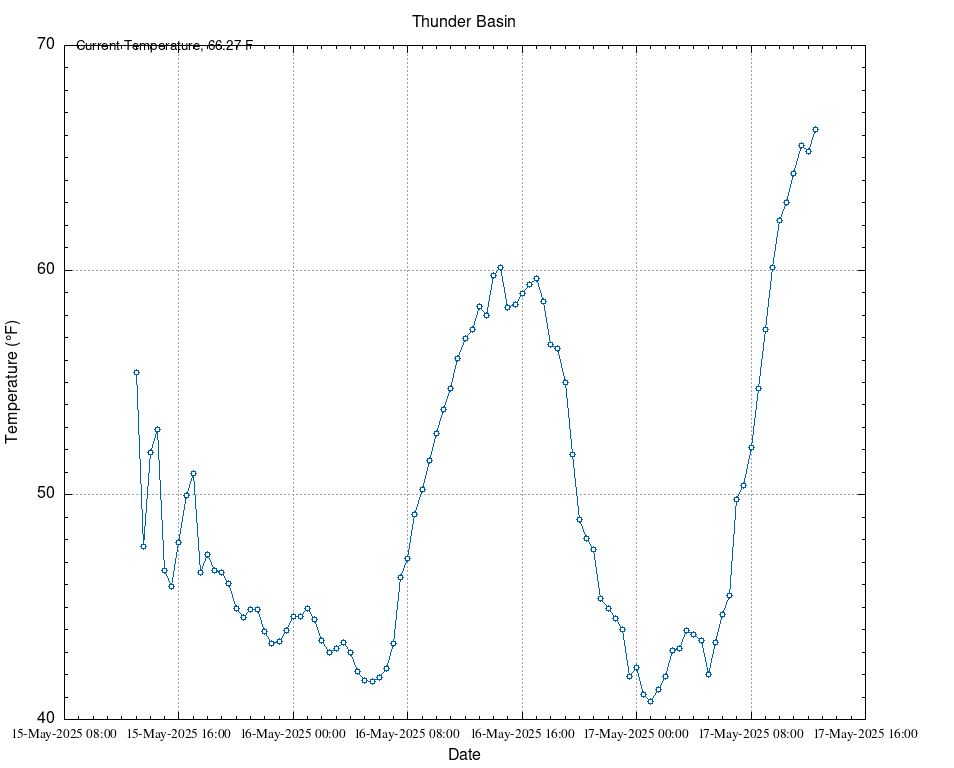 Hourly Temperature (2 Days) |
Click Image to Enlarge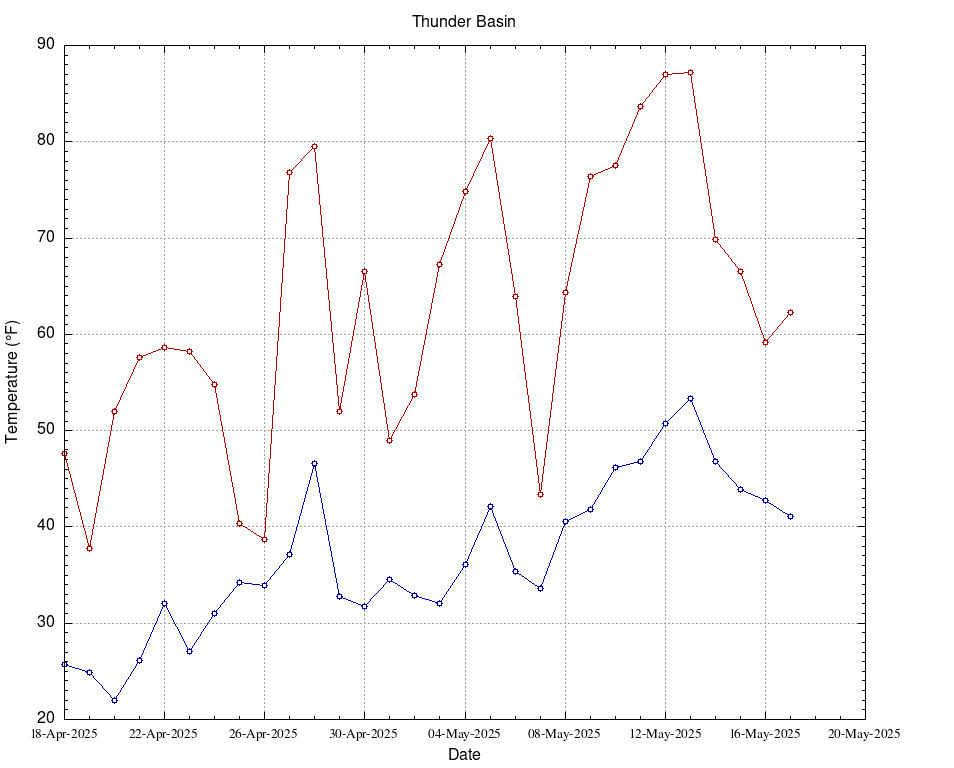 Daily Max/Min Temperature (30 Days) |