Water Resources Data System & State Climate Office
Water Resources Data System & State Climate Office
Water Resources Data System & State Climate Office


Station Map | WACNet Home
Week at a Glance
| Date | TMax (F) | TMin (F) | TAvg (F) | SoilTemp (F) | Avg Vapor Pressure (kPa) | Avg Sat Vapor Pressure (kPa) | Avg RH (%) | Solar Rad (w/m^2) | Avg Wind Spd (mph) | Precipitation (") |
| 2026-07-15 | 90.23 | 53.67 | 71.08 | 32.00 | 0.99 | 2.72 | 39 | 279.40 | 6.50 | 0.00 |
| 2026-07-16 | 82.11 | 53.31 | 67.32 | 32.00 | 1.12 | 2.35 | 49 | 228.00 | 6.58 | 0.00 |
| 2026-07-17 | 83.23 | 50.41 | 65.25 | 32.00 | 1.17 | 2.20 | 56 | 176.30 | 4.69 | 0.00 |
| 2026-07-18 | 82.36 | 49.21 | 64.31 | 32.00 | 1.24 | 2.14 | 62 | 210.90 | 4.94 | 0.00 |
| 2026-07-19 | 81.03 | 50.31 | 63.81 | 32.00 | 1.32 | 2.07 | 66 | 165.60 | 4.89 | 0.04 |
| 2026-07-20 | 81.95 | 52.54 | 68.13 | 32.00 | 1.28 | 2.43 | 57 | 233.50 | 4.02 | 0.00 |
| 2026-07-21 | 89.98 | 56.73 | 71.31 | 32.00 | 1.17 | 2.72 | 46 | 220.40 | 5.46 | 0.00 |
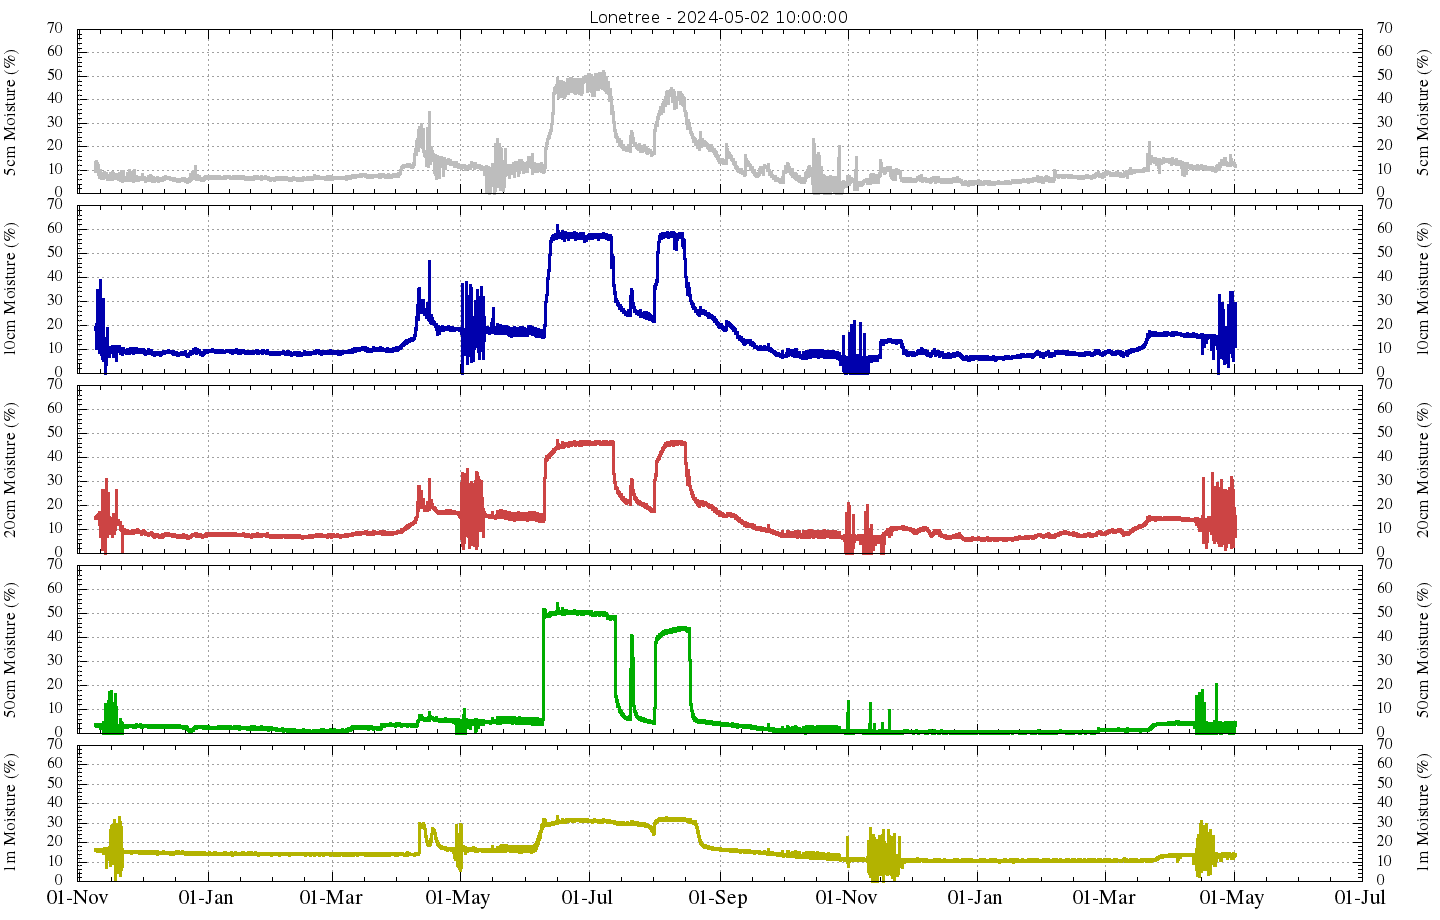
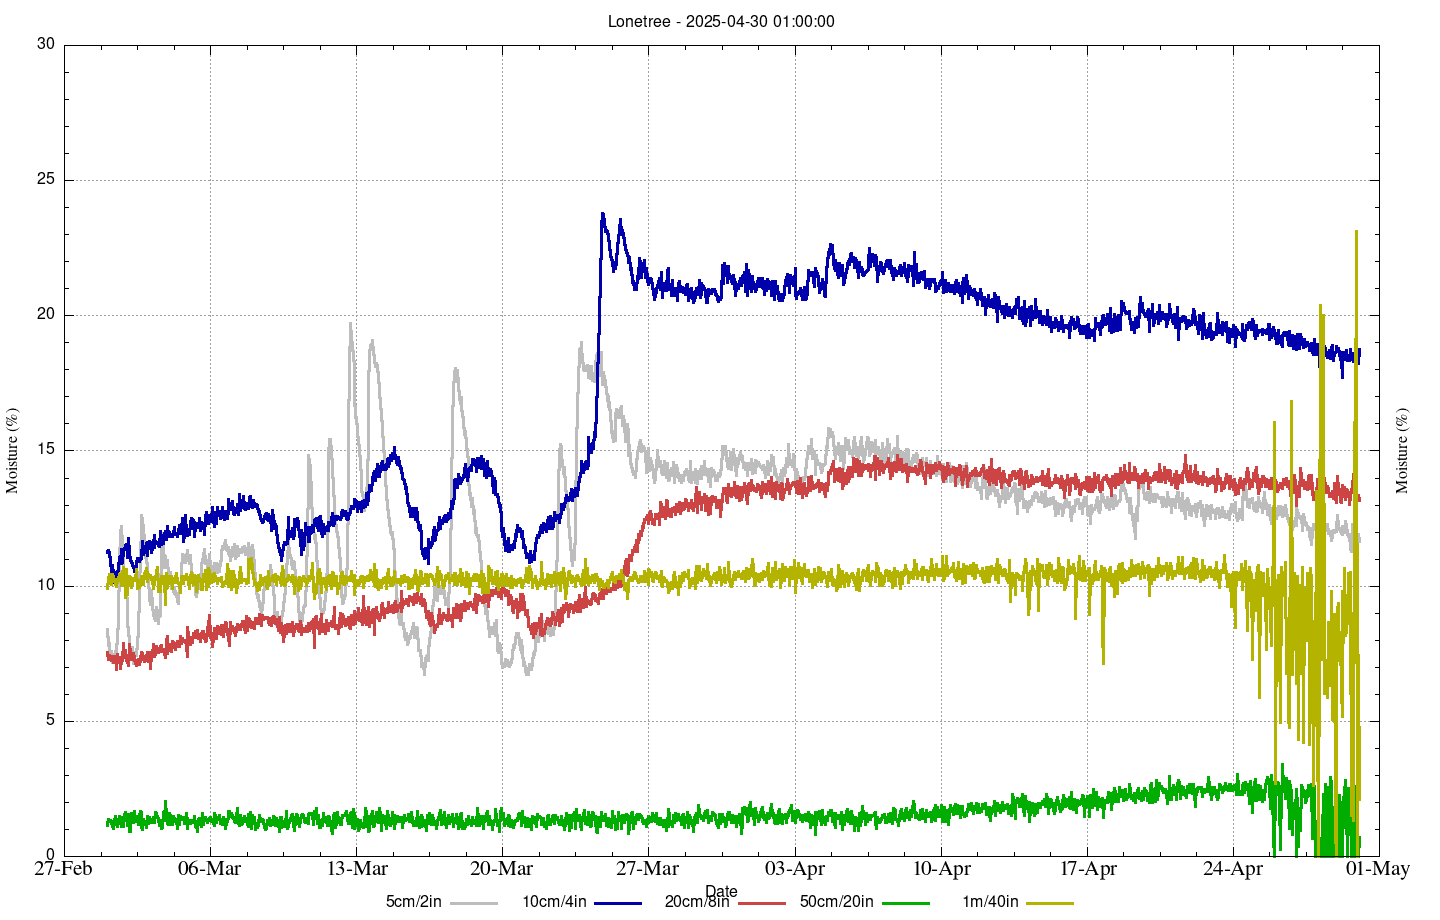
Soil Moisture
Soil Temperature
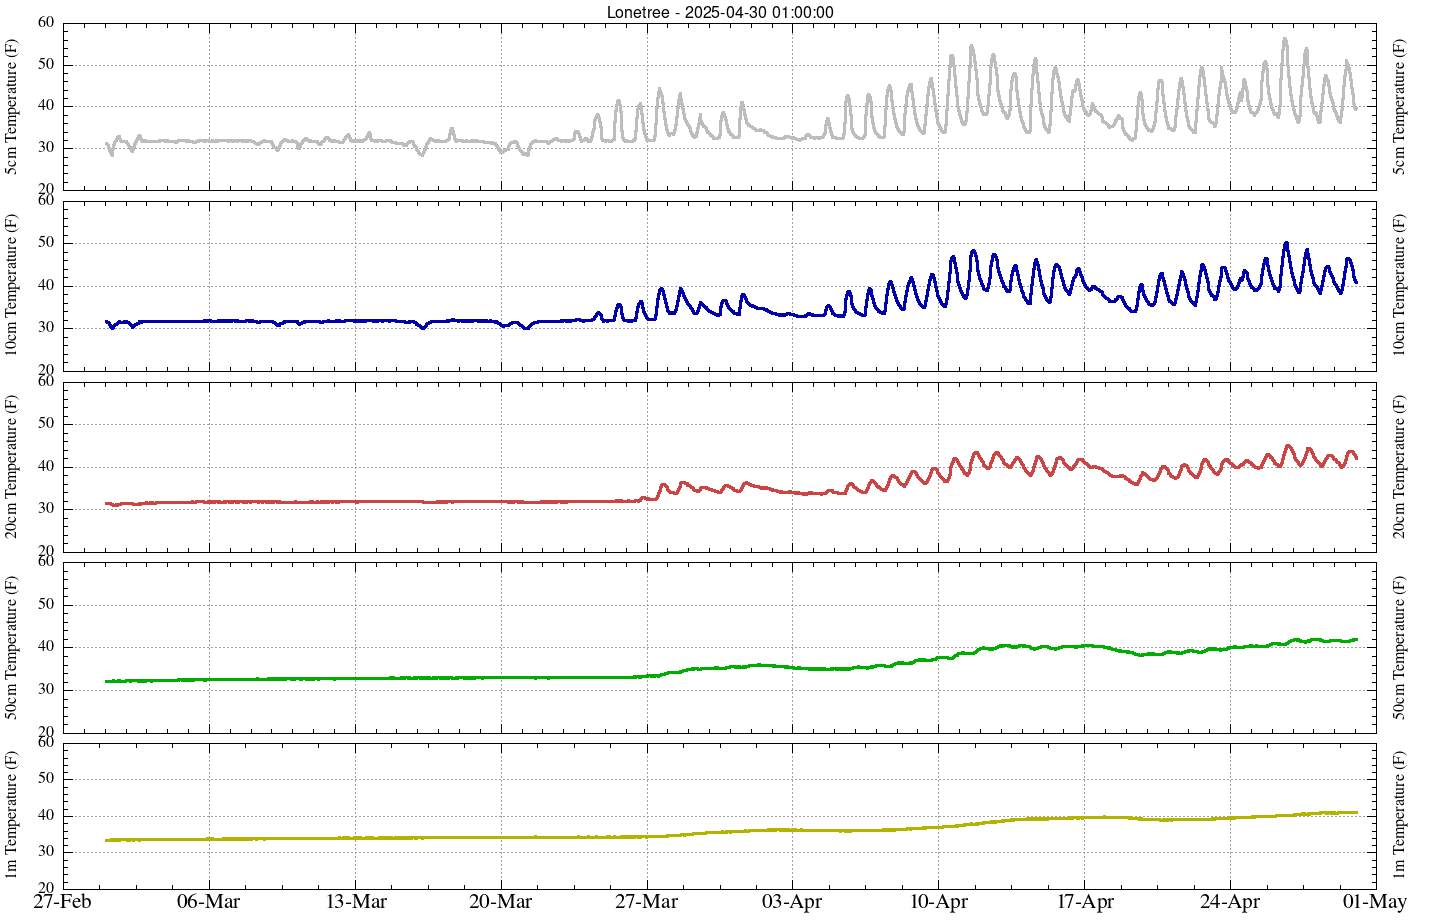
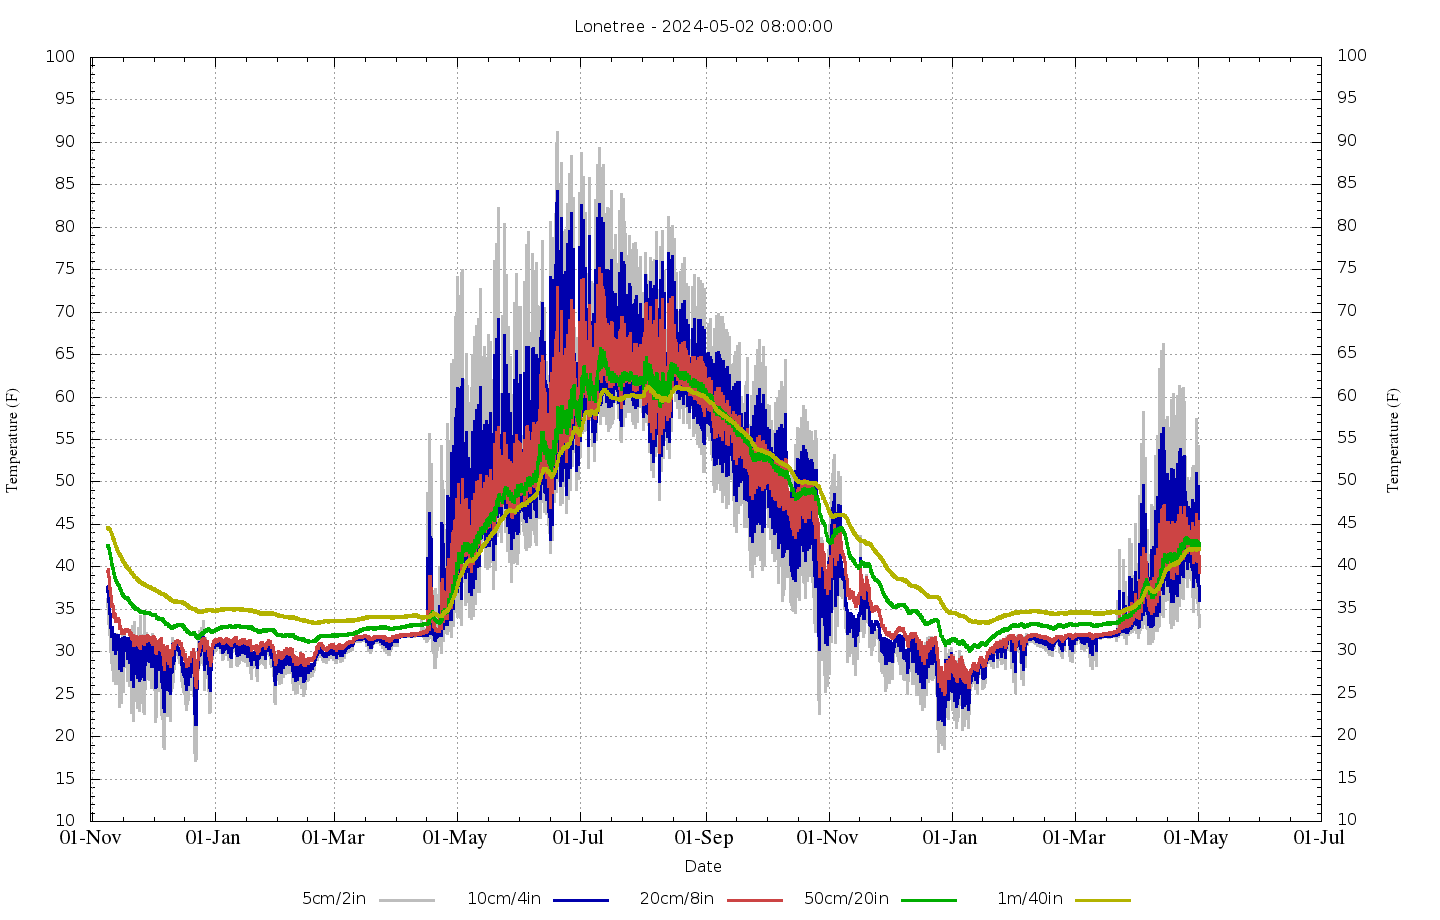
Hourly Charts for Last 30 Days | Daily Charts for Last 1000 days