Water Resources Data System & State Climate Office
Water Resources Data System & State Climate Office
Water Resources Data System & State Climate Office


Station Map | WACNet Home
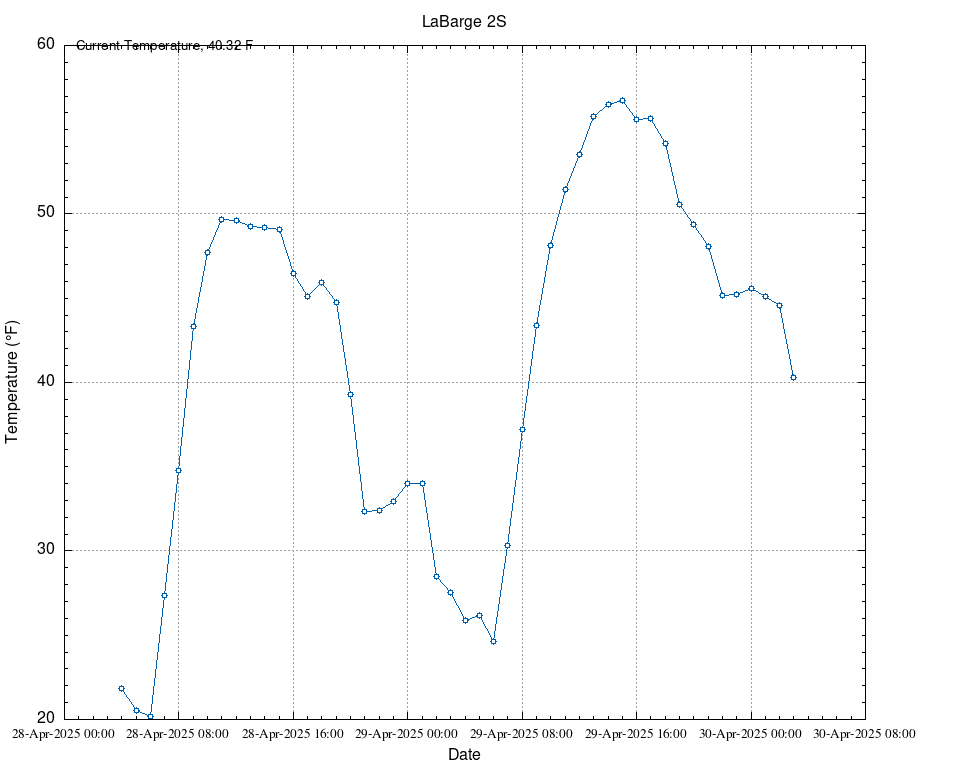
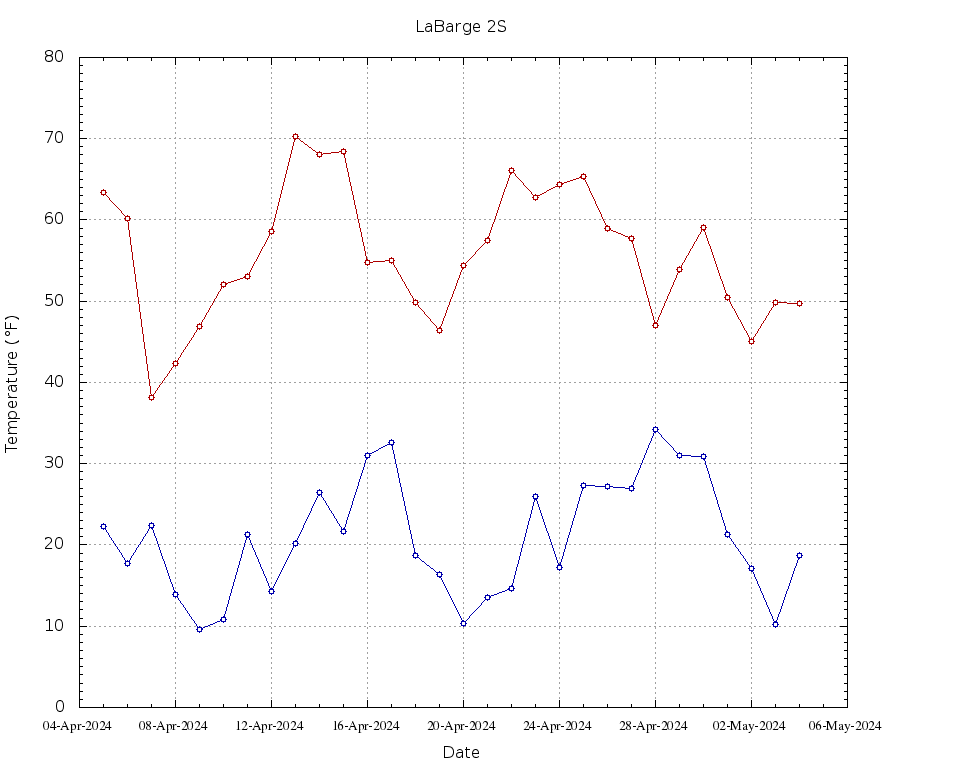
Week at a Glance
| Date | TMax (F) | TMin (F) | TAvg (F) | SoilTemp (F) | Avg Vapor Pressure (kPa) | Avg Sat Vapor Pressure (kPa) | Avg RH (%) | Solar Rad (w/m^2) | Avg Wind Spd (mph) | Precipitation (") |
| 2026-07-15 | 93.22 | 47.08 | 72.07 | 32.00 | 1.16 | 2.93 | 45 | 287.50 | 5.25 | 0.00 |
| 2026-07-16 | 88.12 | 48.65 | 71.13 | 32.00 | 1.29 | 2.73 | 50 | 239.20 | 4.15 | 0.01 |
| 2026-07-17 | 85.82 | 50.54 | 67.44 | 32.00 | 1.49 | 2.42 | 68 | 282.00 | 4.74 | 0.18 |
| 2026-07-18 | 87.53 | 57.63 | 68.70 | 32.00 | 1.55 | 2.48 | 67 | 225.20 | 4.77 | 0.04 |
| 2026-07-19 | 82.31 | 55.38 | 68.00 | 32.00 | 1.54 | 2.40 | 67 | 0.00 | 4.24 | 0.01 |
| 2026-07-20 | 89.35 | 47.75 | 68.63 | 32.00 | 1.37 | 2.59 | 62 | 299.60 | 2.90 | 0.00 |
| 2026-07-21 | 93.29 | 46.83 | 73.78 | 32.00 | 1.25 | 3.13 | 48 | 322.30 | 5.02 | 0.00 |
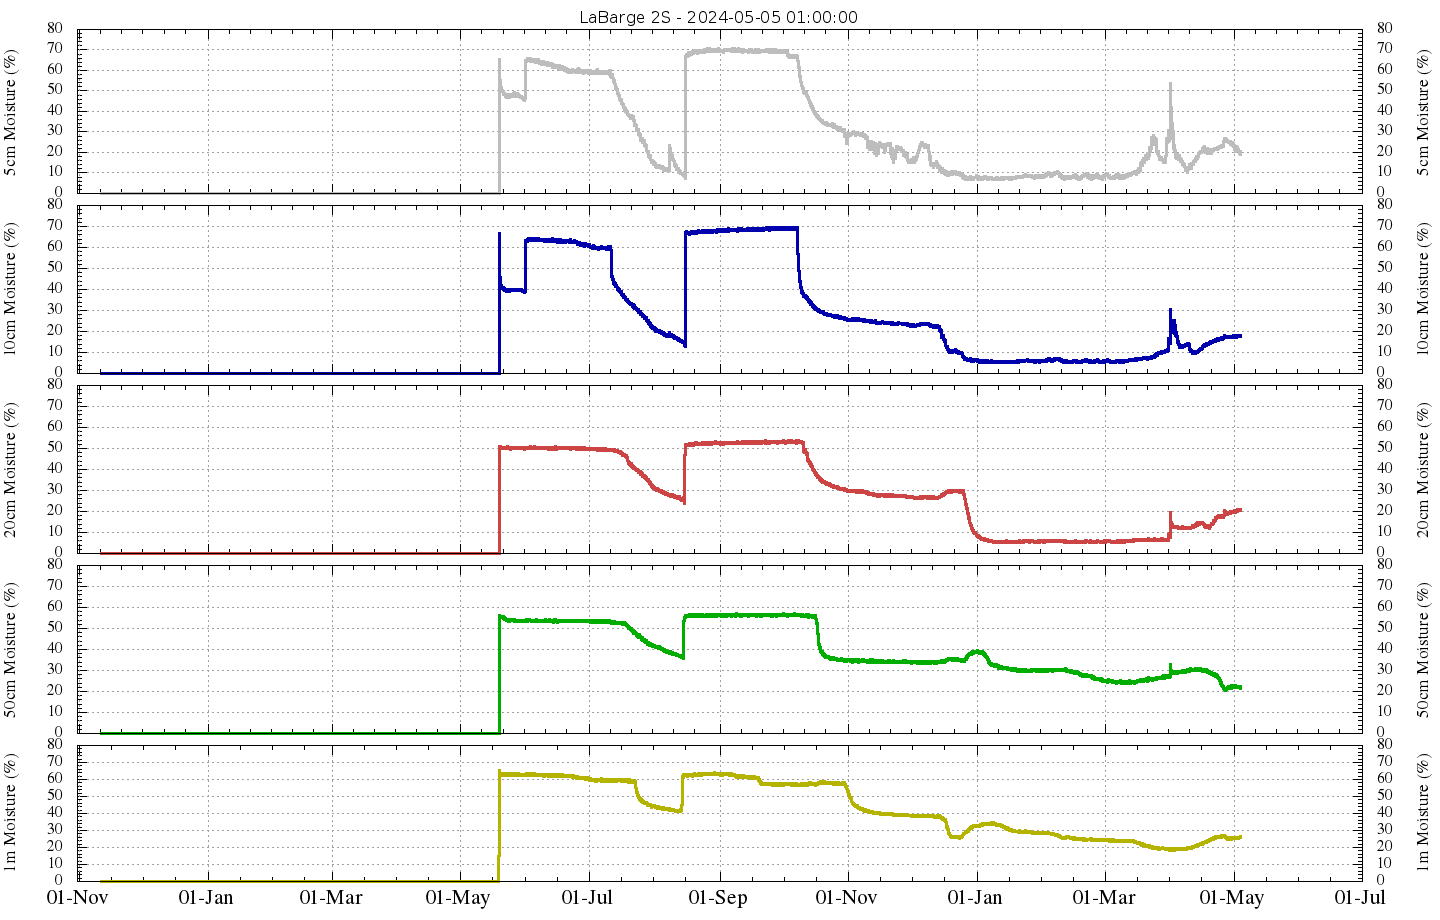
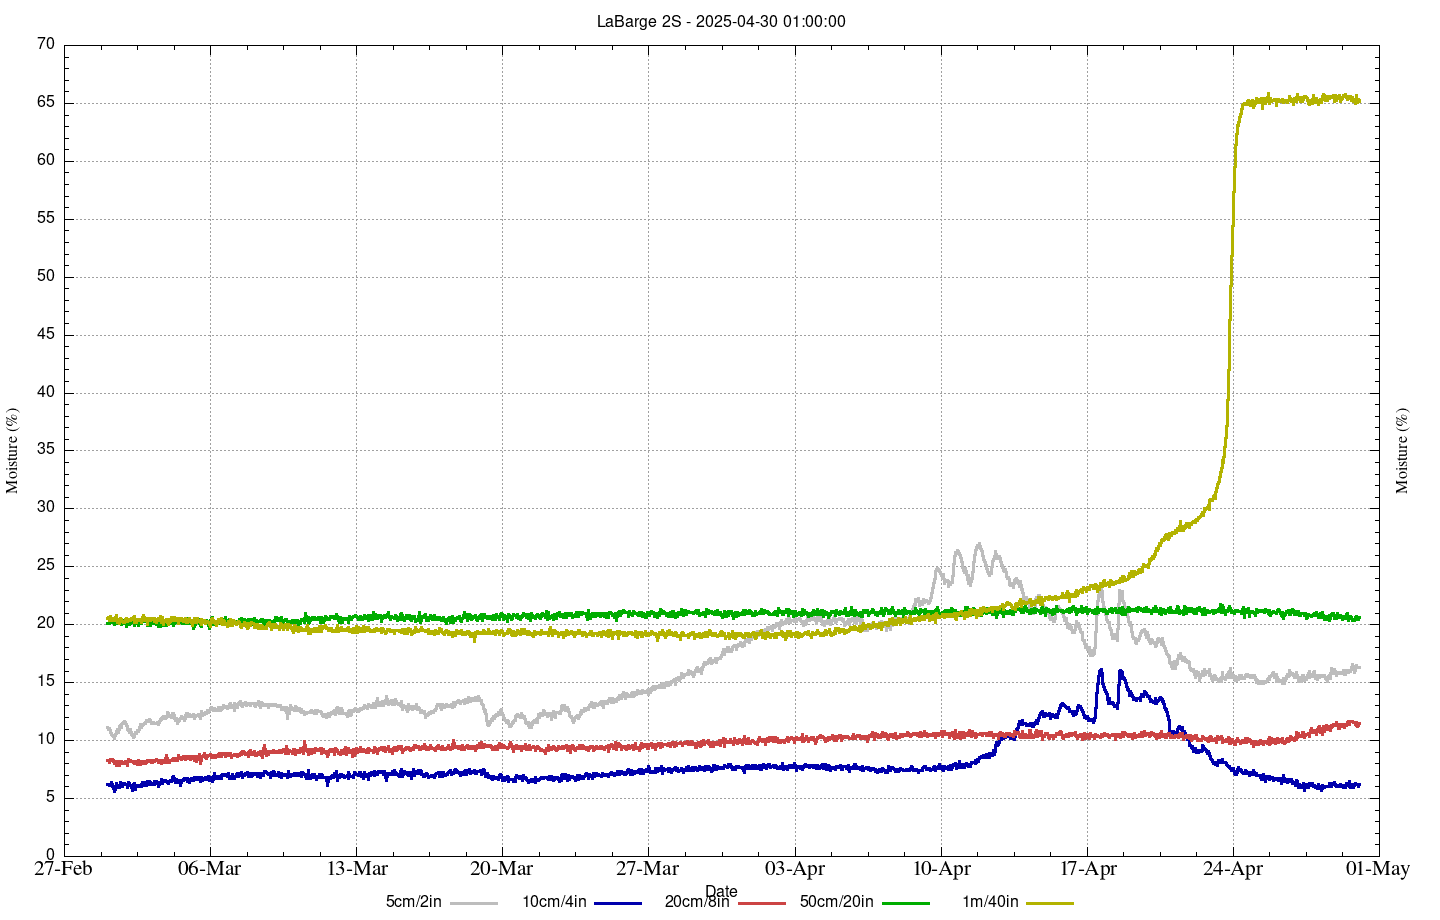
Soil Moisture
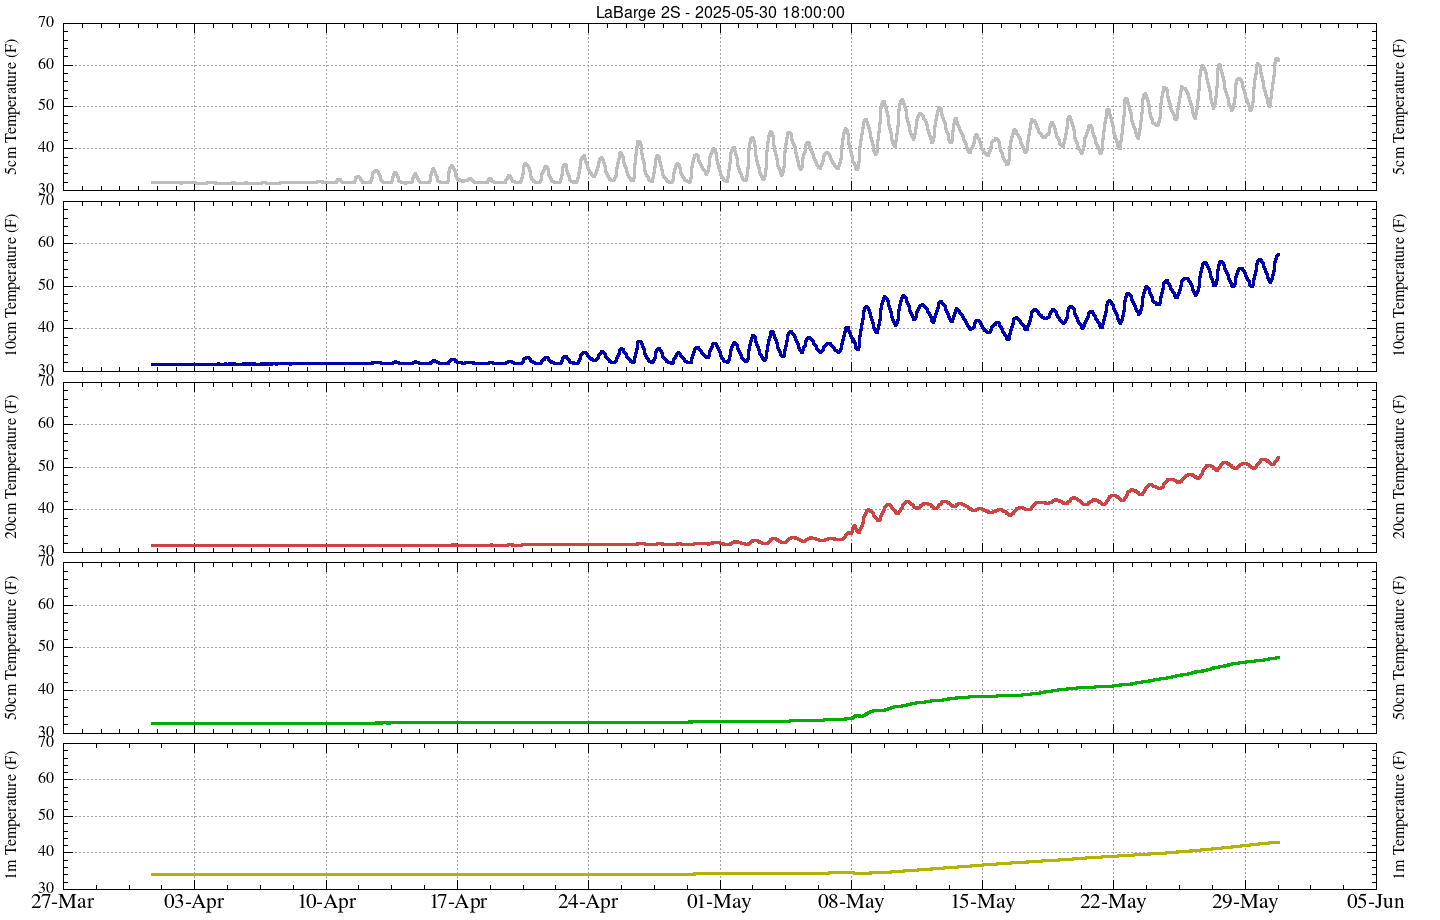
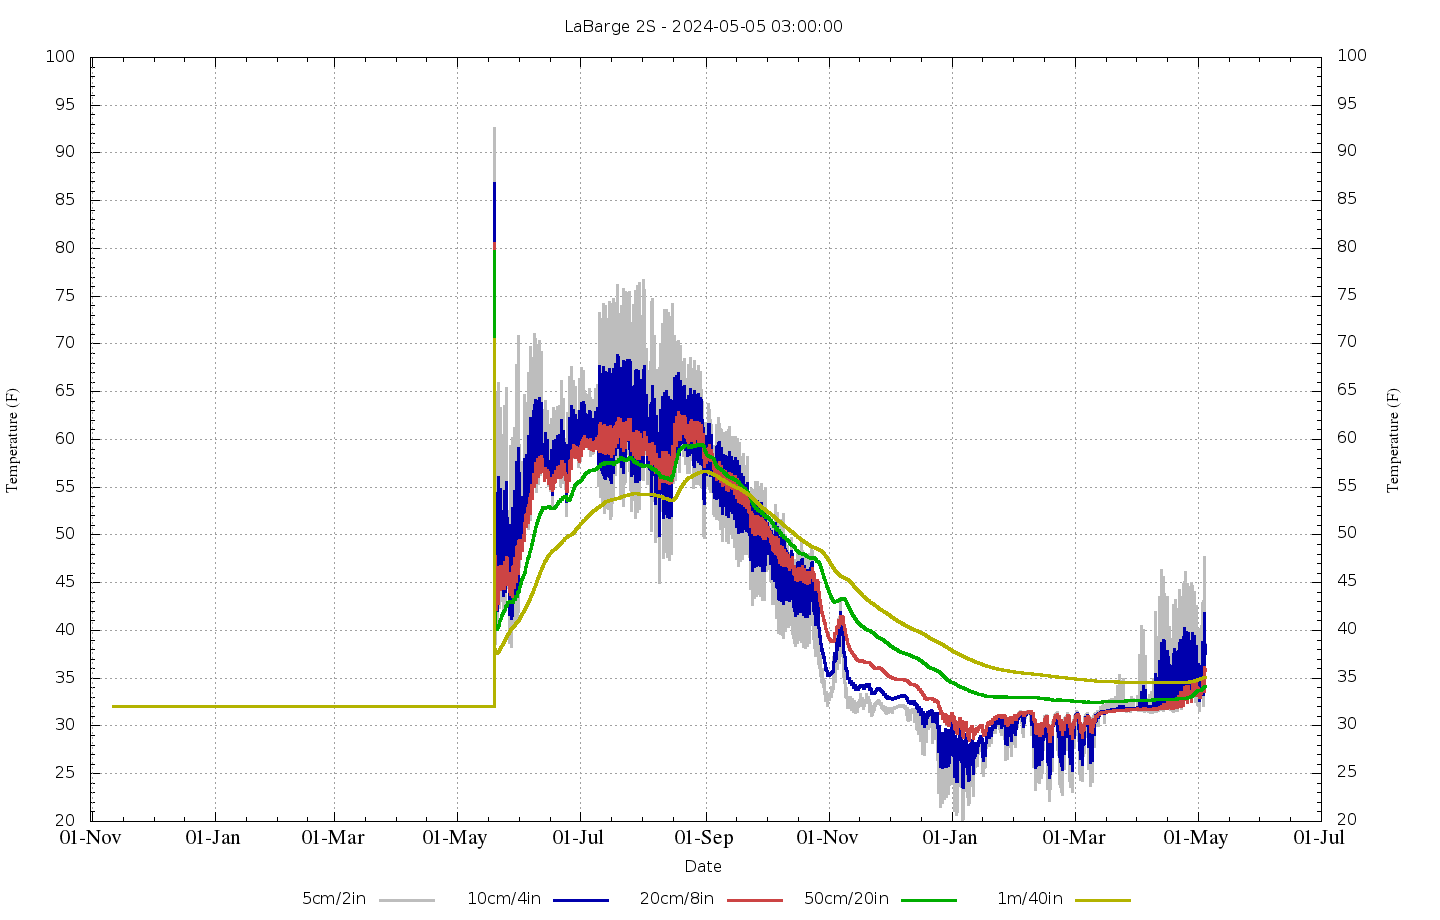
Soil Temperature
Hourly Charts for Last 30 Days | Daily Charts for Last 1000 days