Water Resources Data System & State Climate Office
Water Resources Data System & State Climate Office
Water Resources Data System & State Climate Office


Station Map | WACNet Home
Week at a Glance
| Date | TMax (F) | TMin (F) | TAvg (F) | SoilTemp (F) | Avg Vapor Pressure (kPa) | Avg Sat Vapor Pressure (kPa) | Avg RH (%) | Solar Rad (w/m^2) | Avg Wind Spd (mph) | Precipitation (") |
| 2026-07-15 | 97.95 | 51.80 | 75.16 | 32.00 | 0.90 | 3.25 | 33 | 250.30 | 5.53 | 0.00 |
| 2026-07-16 | 91.49 | 49.80 | 72.39 | 32.00 | 1.09 | 2.93 | 45 | 229.70 | 4.80 | 0.00 |
| 2026-07-17 | 92.26 | 55.42 | 71.76 | 32.00 | 1.40 | 2.80 | 56 | 274.80 | 6.14 | 0.00 |
| 2026-07-18 | 93.09 | 56.84 | 72.34 | 32.00 | 1.34 | 2.88 | 55 | 276.60 | 5.76 | 0.00 |
| 2026-07-19 | 91.67 | 53.62 | 71.46 | 32.00 | 1.33 | 2.80 | 55 | 290.50 | 4.66 | 0.00 |
| 2026-07-20 | 96.03 | 57.13 | 76.62 | 32.00 | 1.19 | 3.33 | 43 | 307.80 | 3.15 | 0.00 |
| 2026-07-21 | 99.72 | 51.44 | 76.33 | 32.00 | 1.06 | 3.41 | 39 | 267.90 | 4.63 | 0.00 |
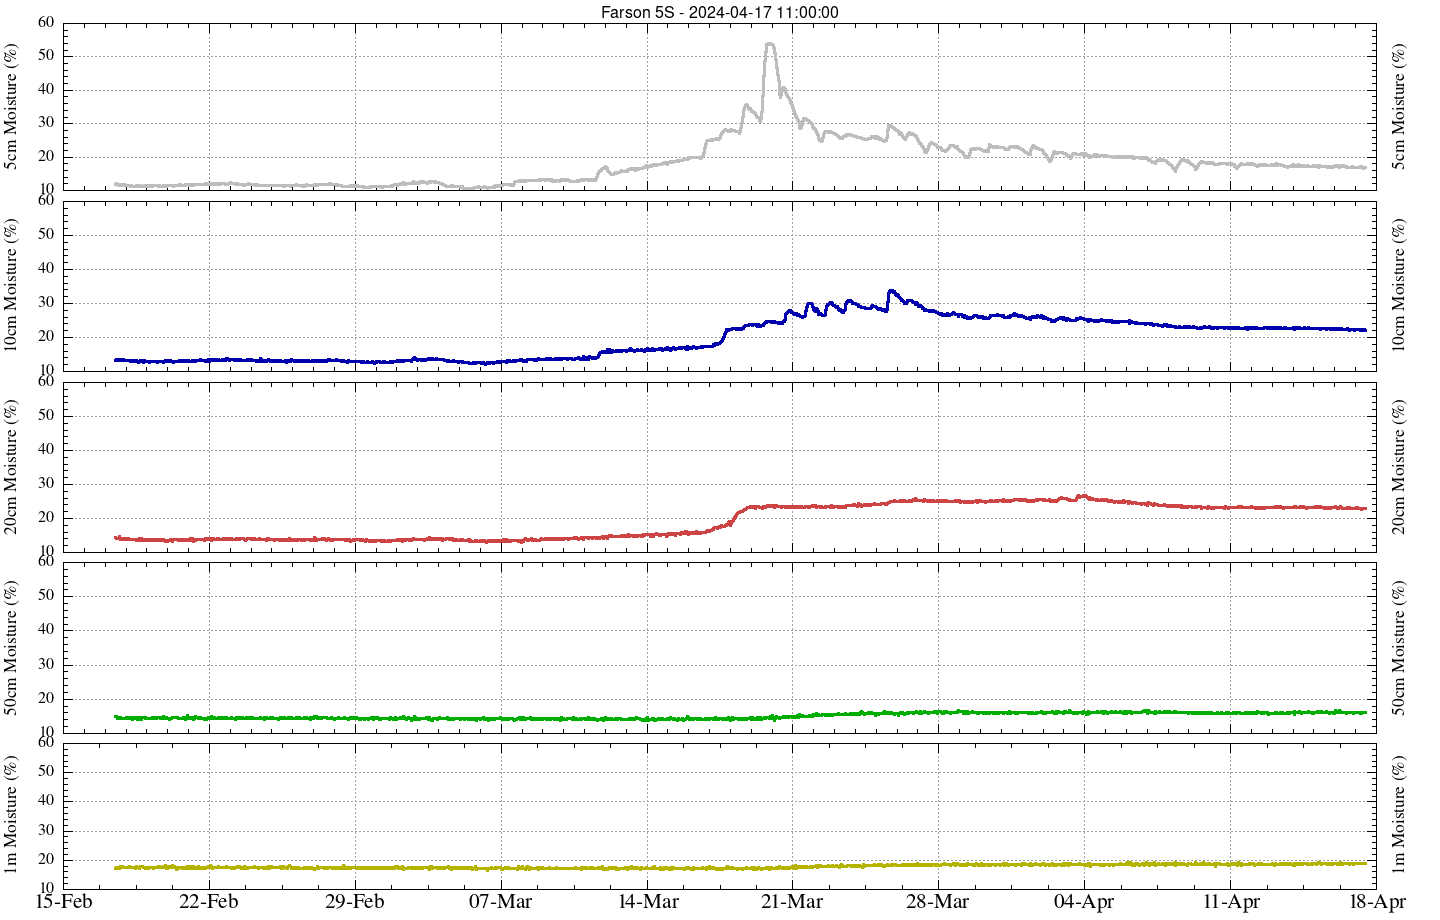
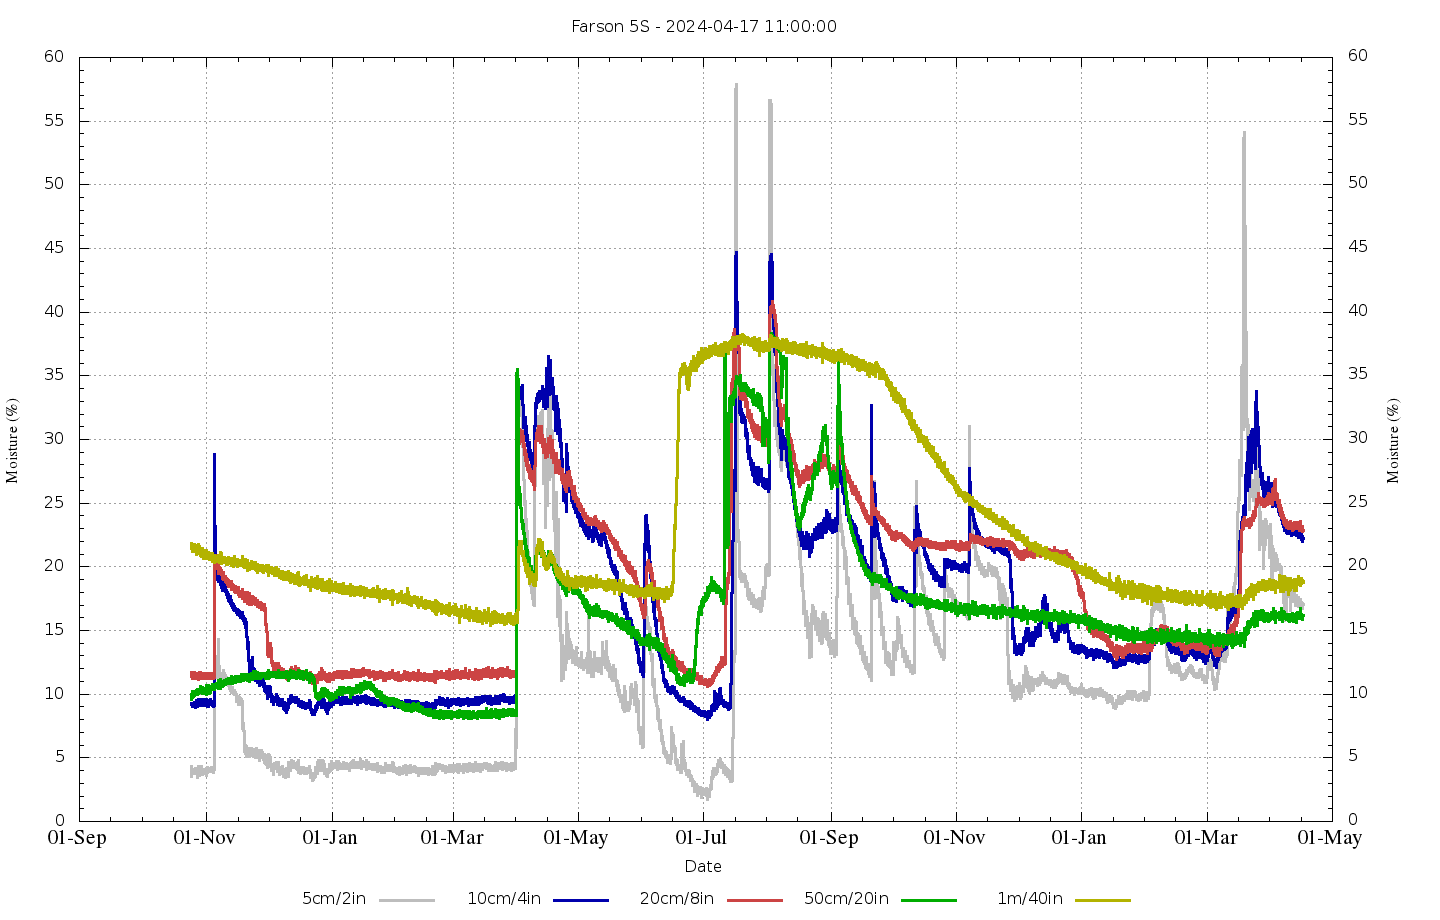
Soil Moisture
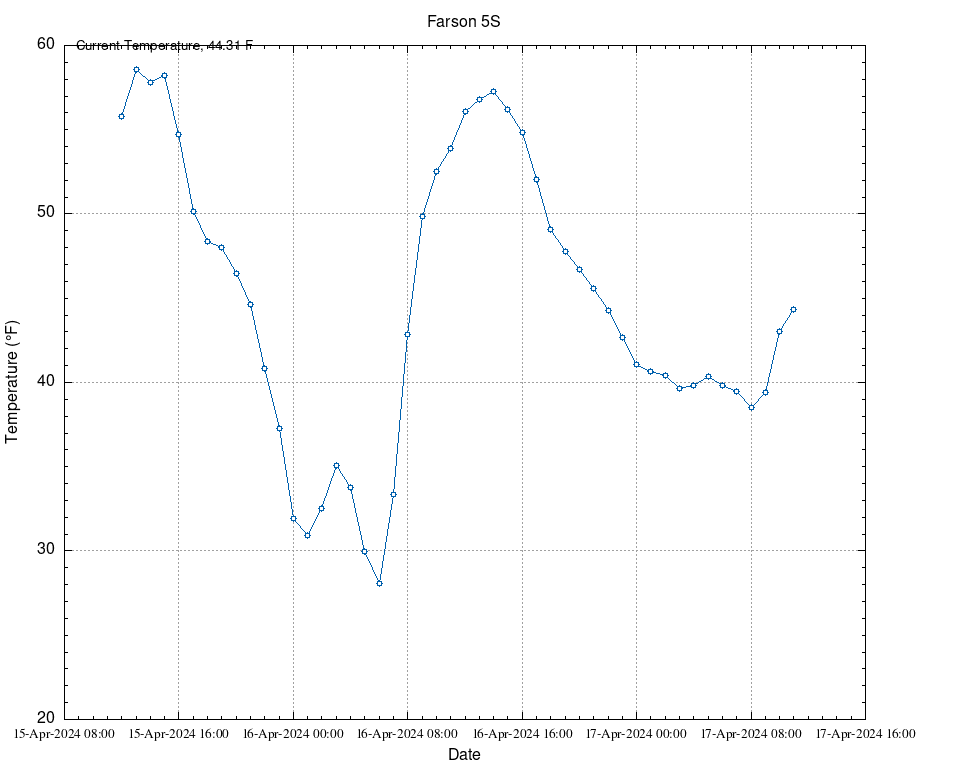
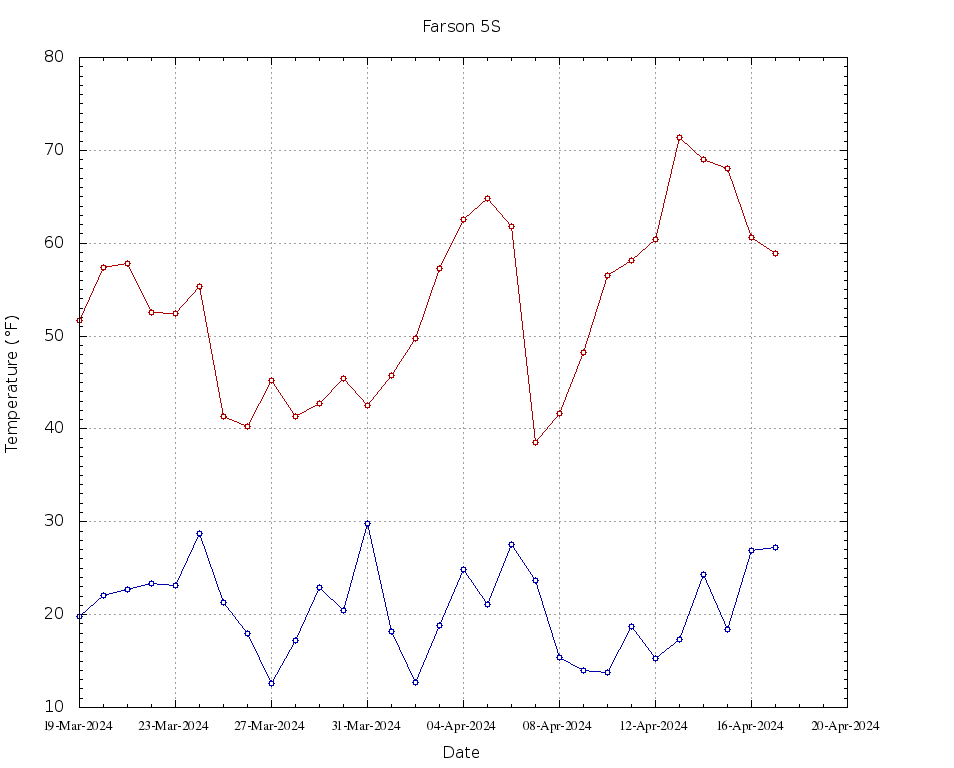
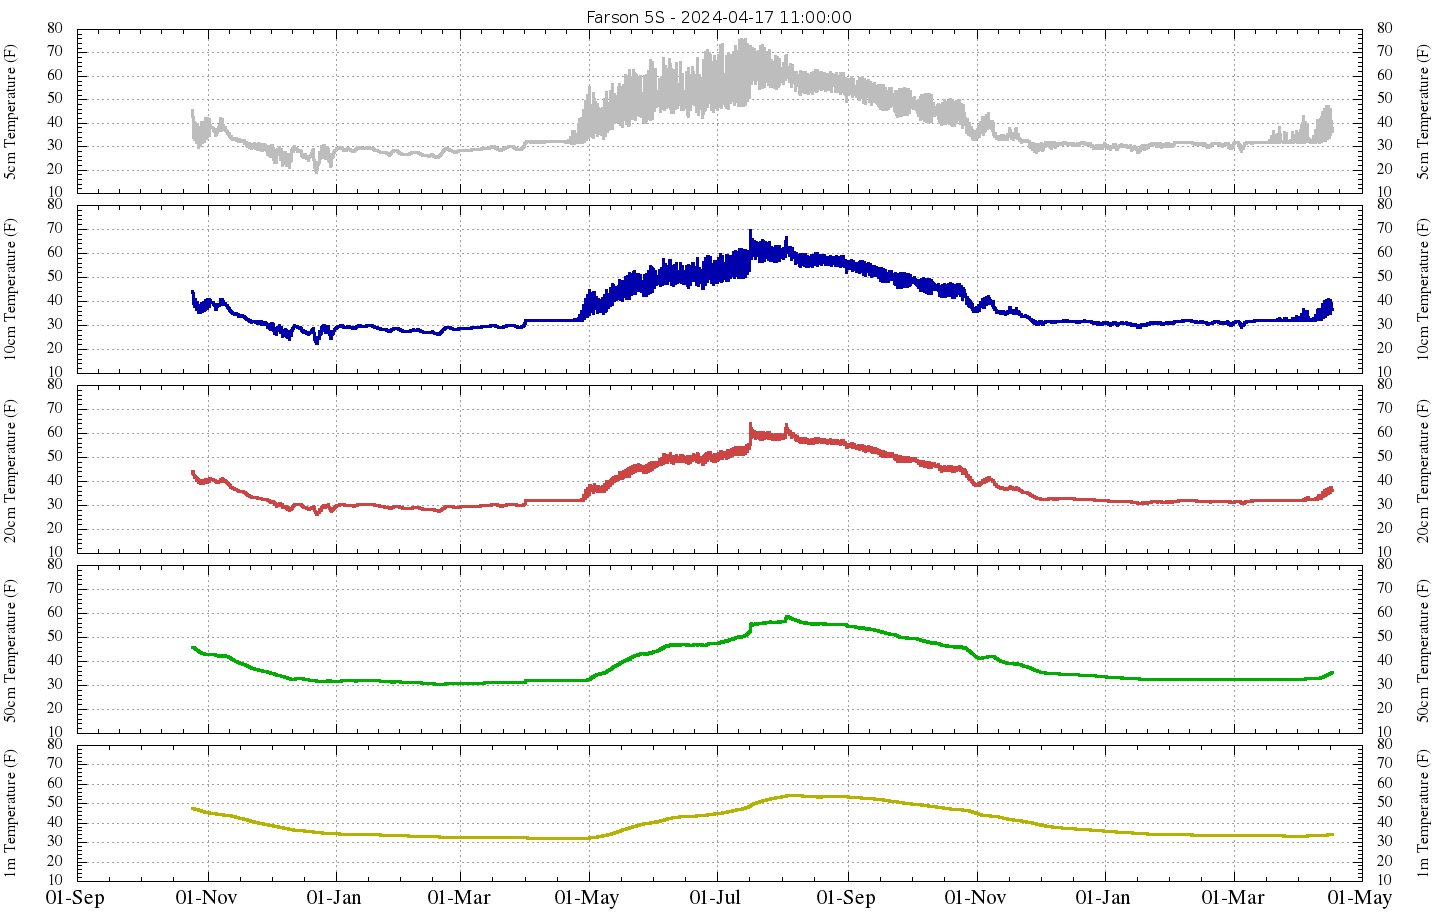
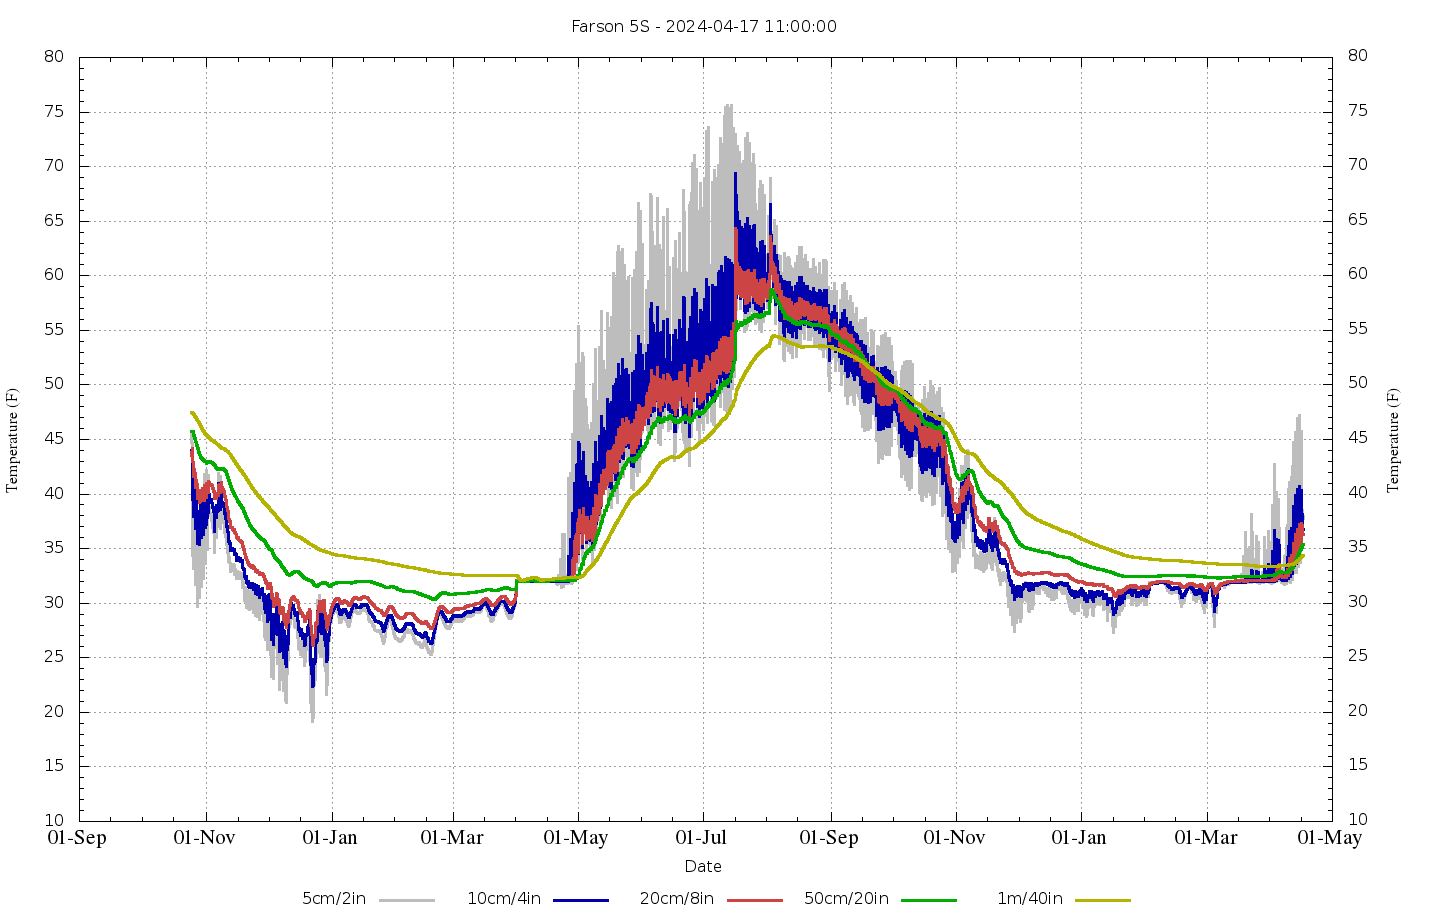
Soil Temperature
Hourly Charts for Last 30 Days | Daily Charts for Last 1000 days