Water Resources Data System & State Climate Office
Water Resources Data System & State Climate Office
Water Resources Data System & State Climate Office


Station Map | WACNet Home
Week at a Glance
| Date | TMax (F) | TMin (F) | TAvg (F) | SoilTemp (F) | Avg Vapor Pressure (kPa) | Avg Sat Vapor Pressure (kPa) | Avg RH (%) | Solar Rad (w/m^2) | Avg Wind Spd (mph) | Precipitation (") |
| 2026-07-14 | 97.92 | 54.05 | 79.66 | 0.61 | 3.75 | 21 | 348.50 | 6.46 | 0.00 | |
| 2026-07-15 | 96.28 | 55.58 | 78.98 | 0.72 | 3.60 | 23 | 328.30 | 6.30 | 0.00 | |
| 2026-07-16 | 91.67 | 54.41 | 76.30 | 0.89 | 3.29 | 31 | 295.90 | 7.24 | 0.00 | |
| 2026-07-17 | 90.30 | 56.64 | 75.78 | 1.10 | 3.18 | 40 | 285.20 | 7.63 | 0.00 | |
| 2026-07-18 | 90.86 | 59.49 | 76.12 | 1.07 | 3.21 | 37 | 304.20 | 6.32 | 0.00 | |
| 2026-07-19 | 91.98 | 59.97 | 73.62 | 1.31 | 2.97 | 49 | 301.40 | 8.69 | 0.00 | |
| 2026-07-20 | 90.55 | 57.49 | 75.99 | 1.24 | 3.24 | 45 | 285.80 | 4.38 | 0.00 |
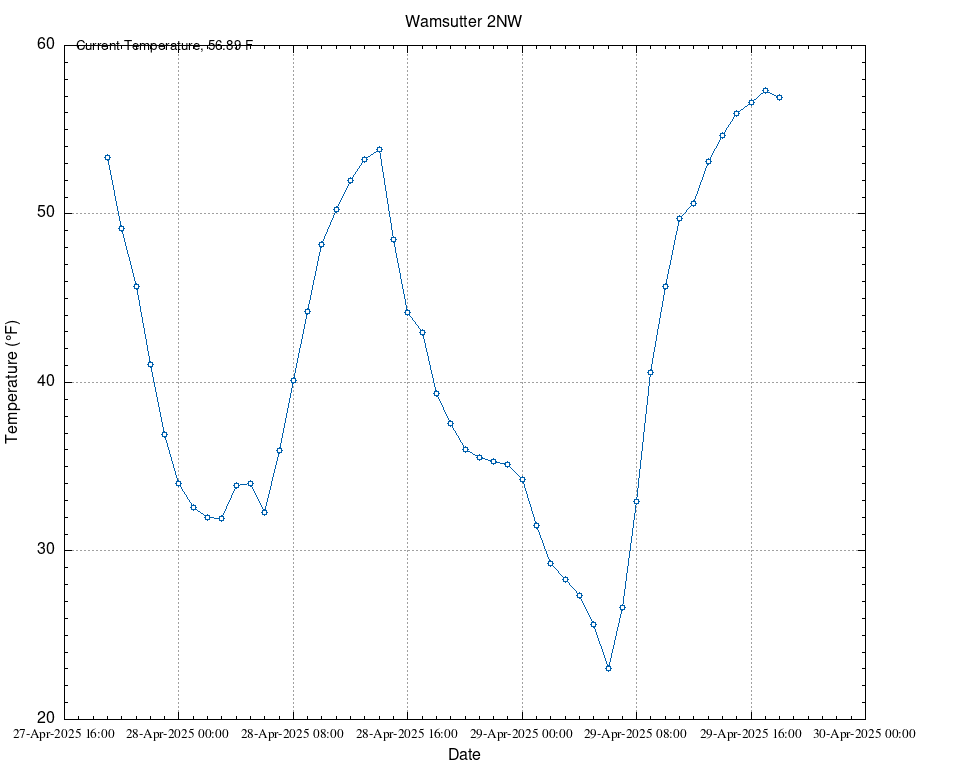
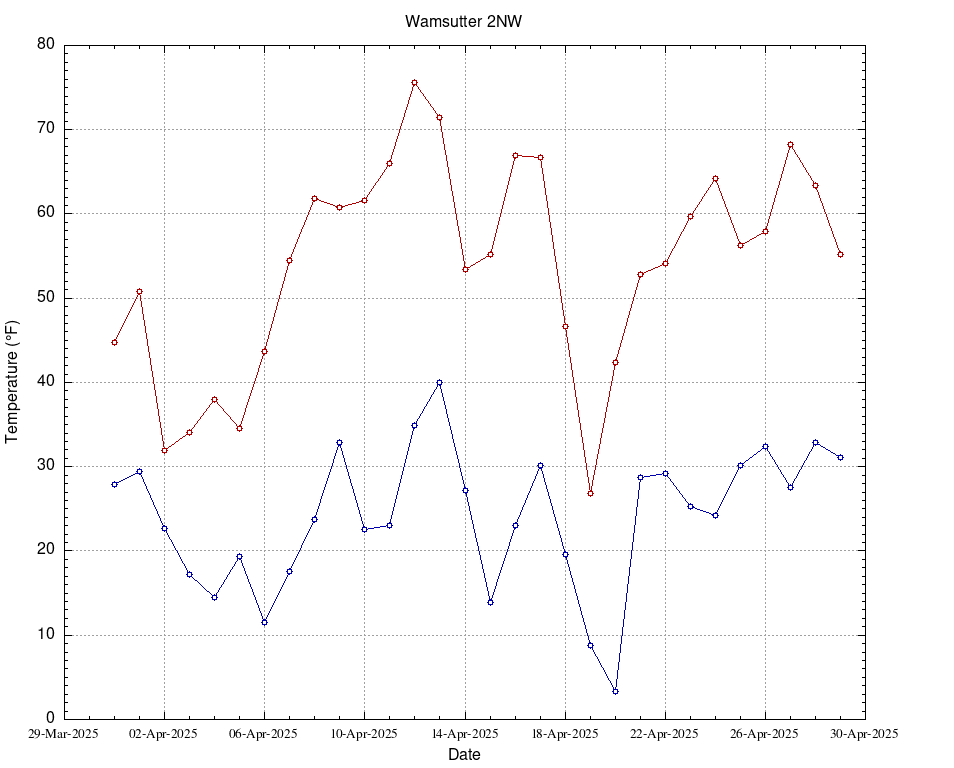
Hourly Charts for Last 30 Days | Daily Charts for Last 1000 days