Water Resources Data System & State Climate Office
Water Resources Data System & State Climate Office
Water Resources Data System & State Climate Office


Station Map | WACNet Home
Week at a Glance
| Date | TMax (F) | TMin (F) | TAvg (F) | SoilTemp (F) | Avg Vapor Pressure (kPa) | Avg Sat Vapor Pressure (kPa) | Avg RH (%) | Solar Rad (w/m^2) | Avg Wind Spd (mph) | Precipitation (") |
| 2026-07-15 | 83.48 | 53.37 | 72.03 | 55.24 | 0.84 | 2.77 | 32 | 334.60 | 6.83 | 0.00 |
| 2026-07-16 | 84.99 | 49.12 | 68.70 | 55.47 | 0.91 | 2.51 | 39 | 335.90 | 5.27 | 0.00 |
| 2026-07-17 | 80.19 | 52.88 | 68.70 | 55.78 | 0.98 | 2.47 | 41 | 306.10 | 6.57 | 0.00 |
| 2026-07-18 | 82.26 | 51.31 | 69.33 | 56.12 | 0.99 | 2.54 | 41 | 320.70 | 5.94 | 0.00 |
| 2026-07-19 | 86.40 | 56.23 | 71.56 | 56.43 | 1.08 | 2.73 | 42 | 292.10 | 4.57 | 0.00 |
| 2026-07-20 | 85.37 | 54.48 | 70.36 | 56.91 | 1.22 | 2.62 | 49 | 258.40 | 5.37 | 0.00 |
| 2026-07-21 | 90.79 | 56.30 | 73.49 | 57.13 | 1.11 | 2.94 | 41 | 276.30 | 4.08 | 0.00 |
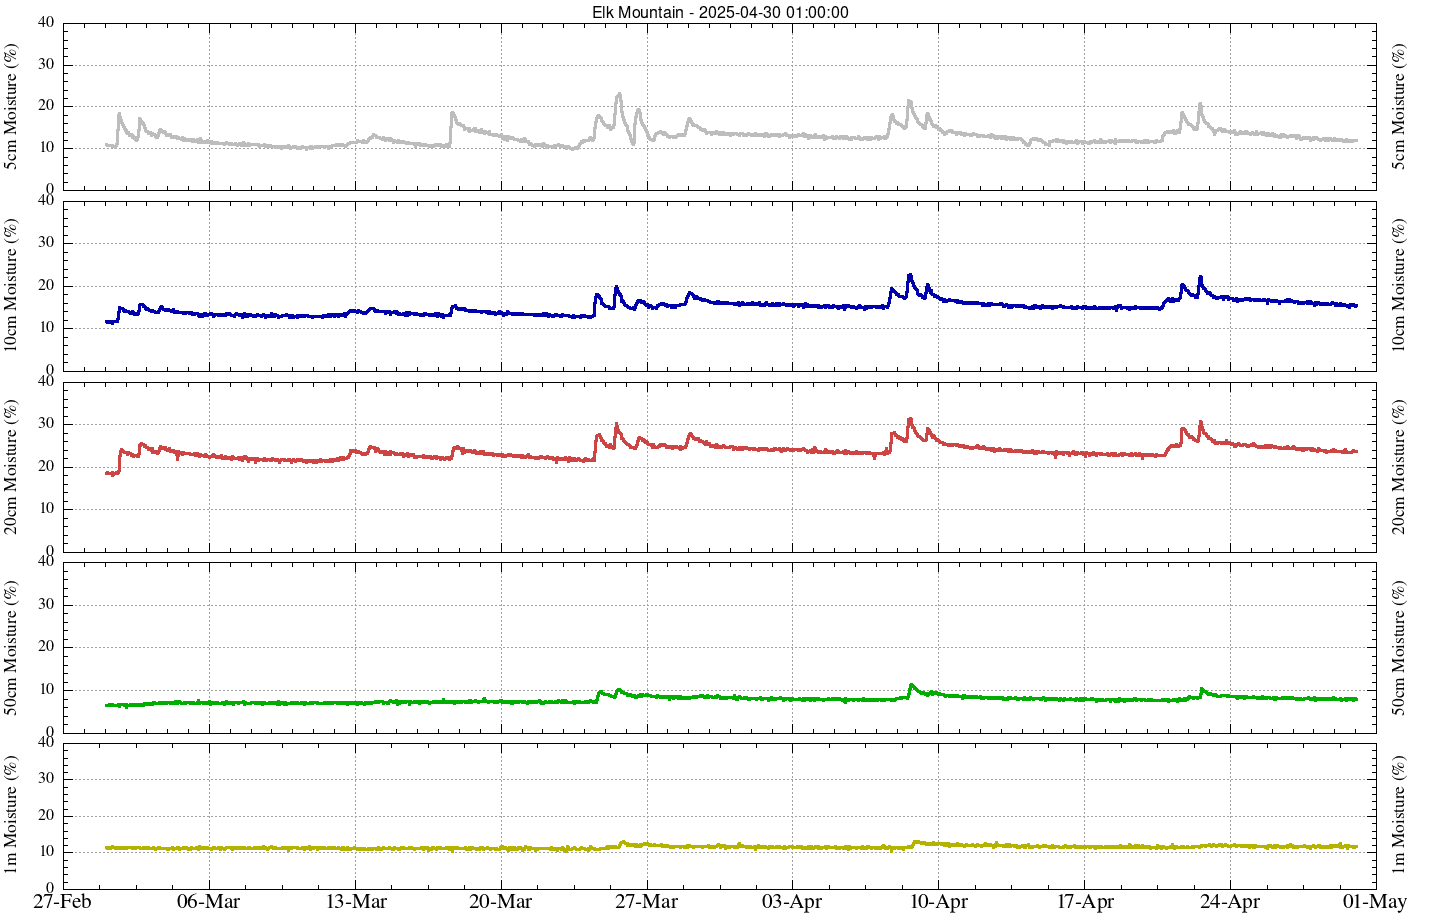
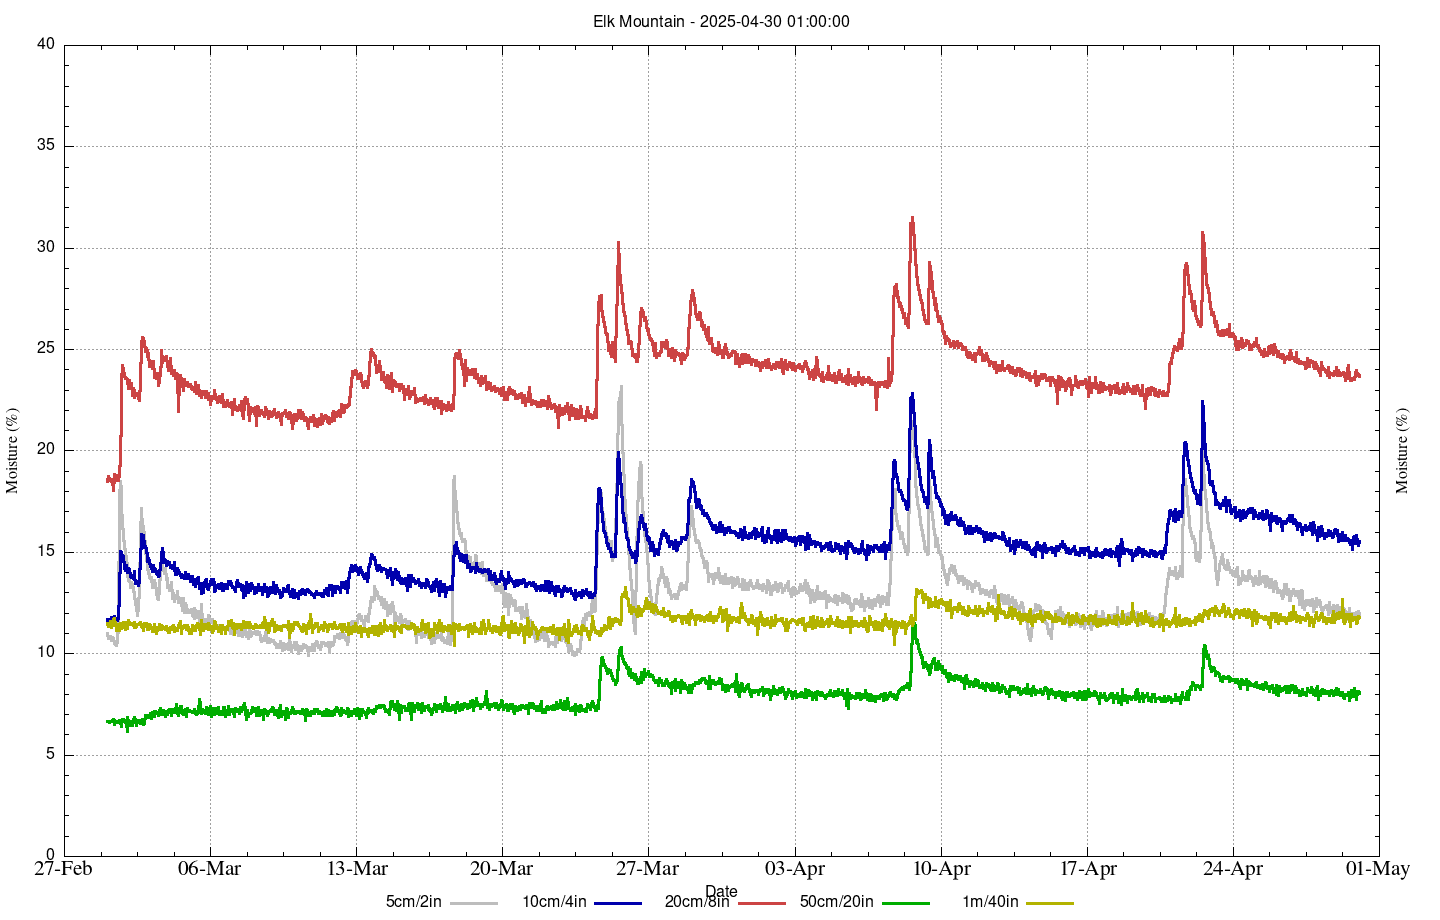
Soil Moisture
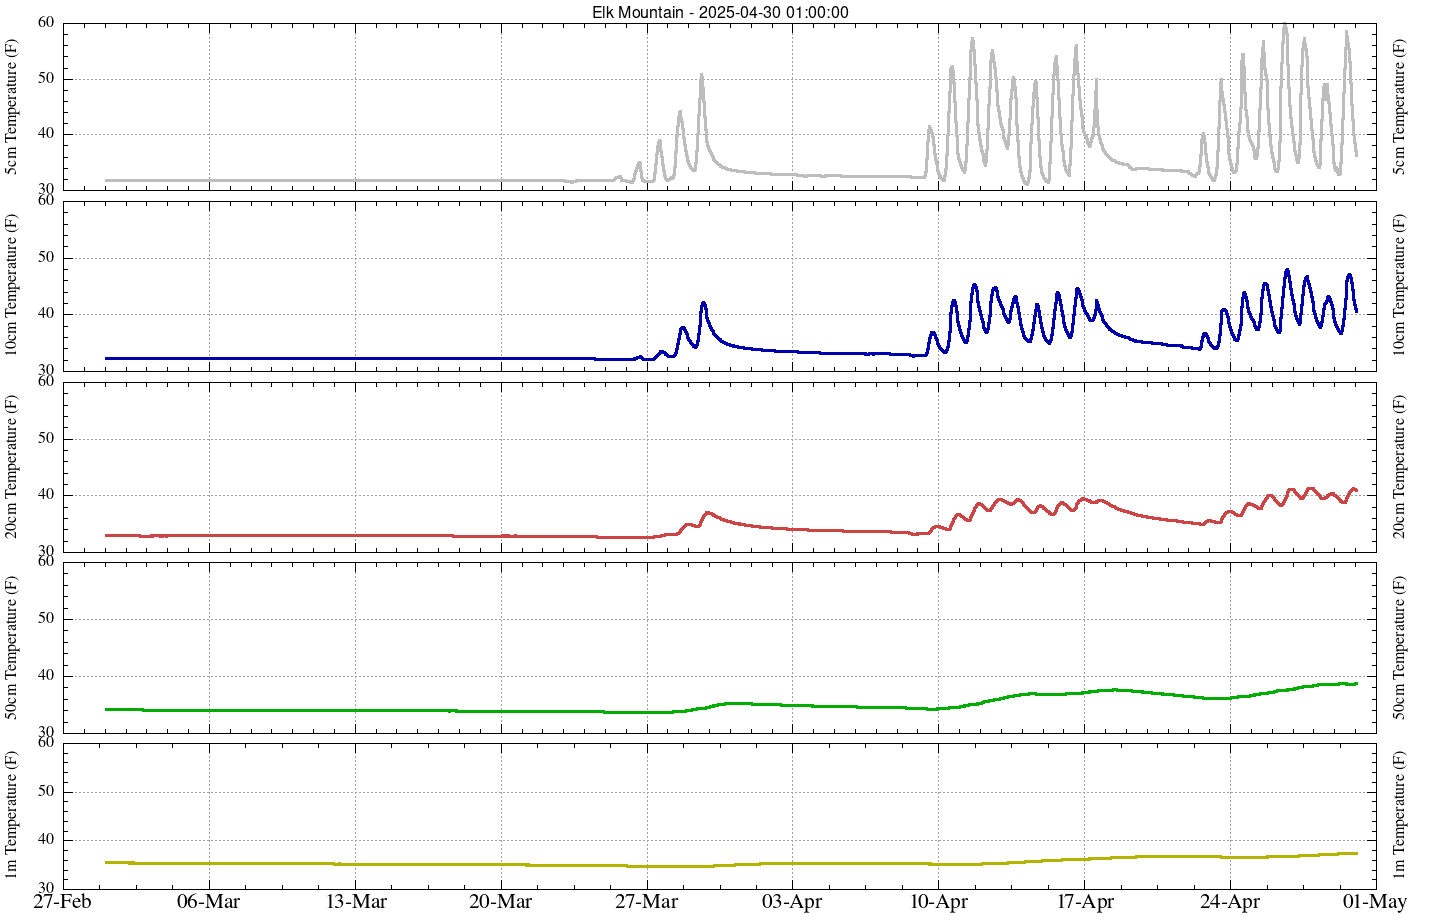
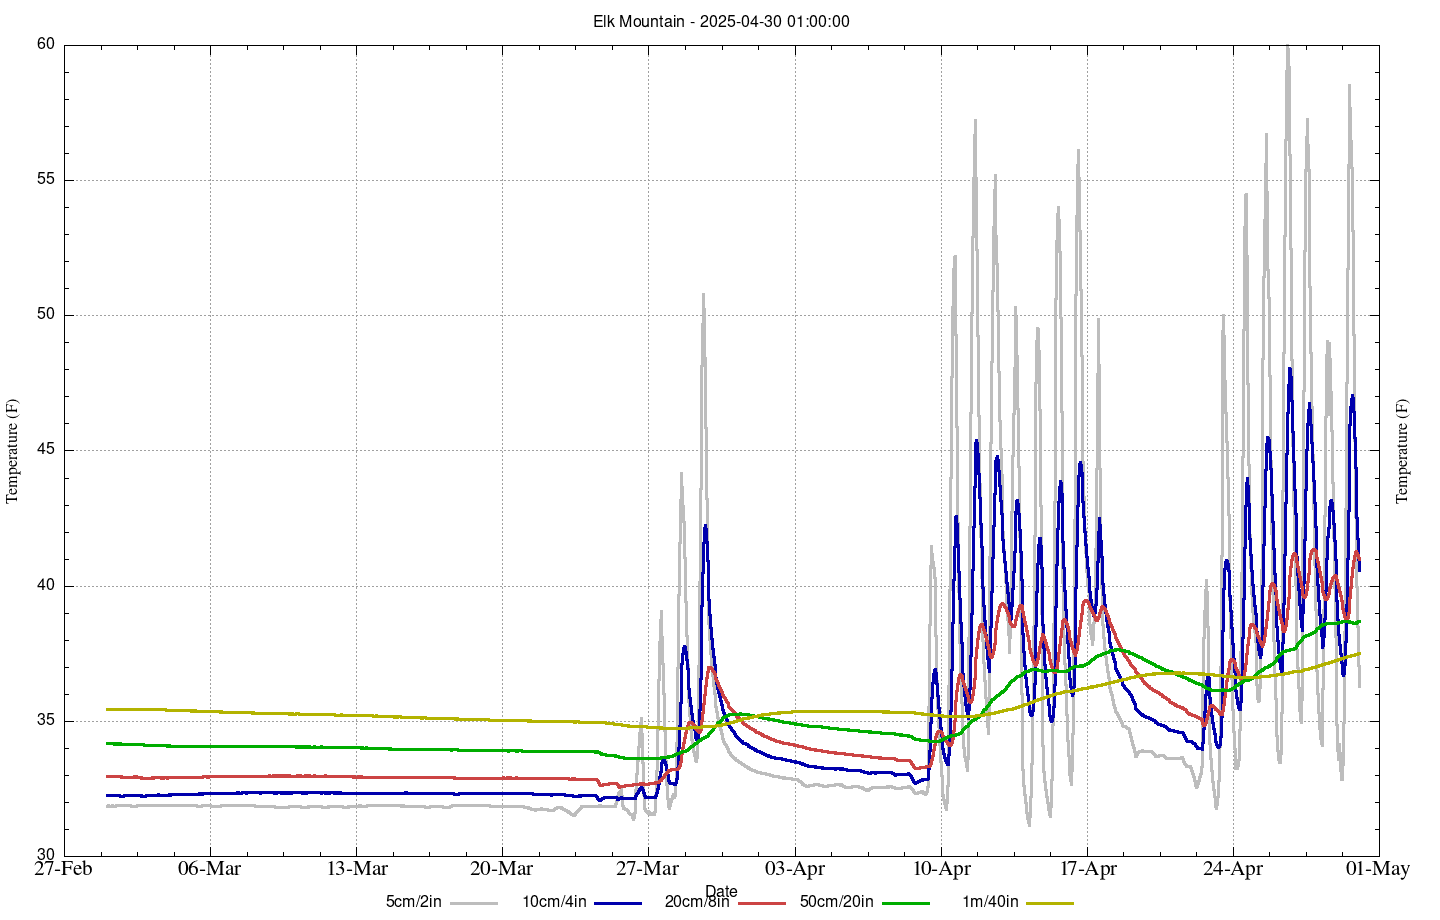
Soil Temperature
Hourly Charts for Last 30 Days | Daily Charts for Last 1000 days