Water Resources Data System & State Climate Office
Water Resources Data System & State Climate Office
Water Resources Data System & State Climate Office


Station Map | WACNet Home
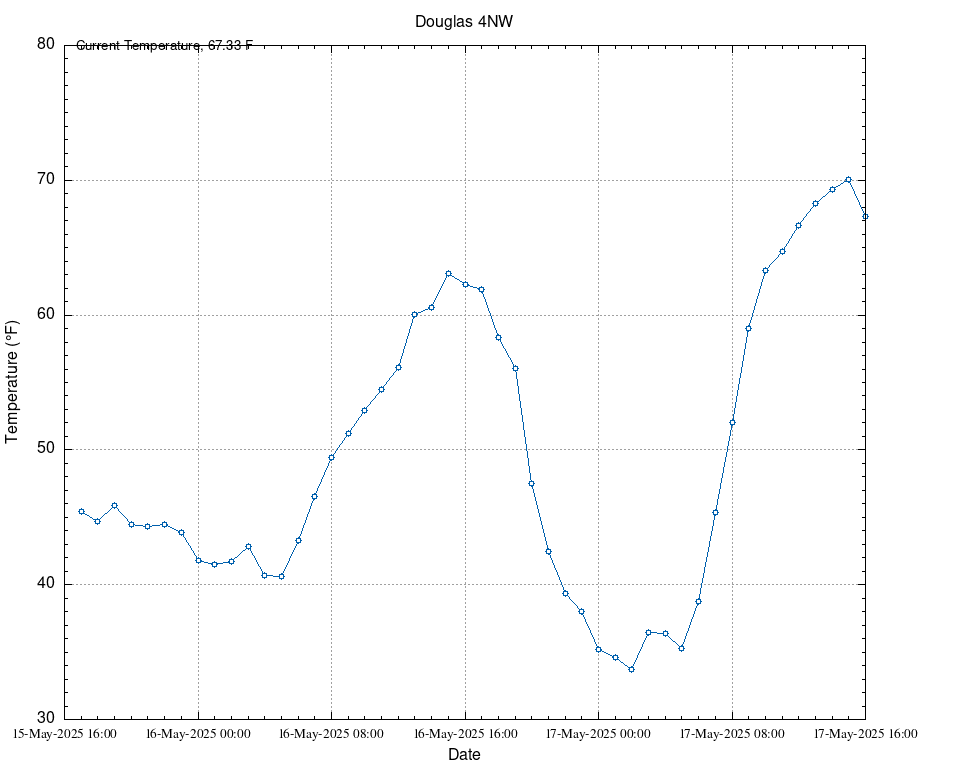
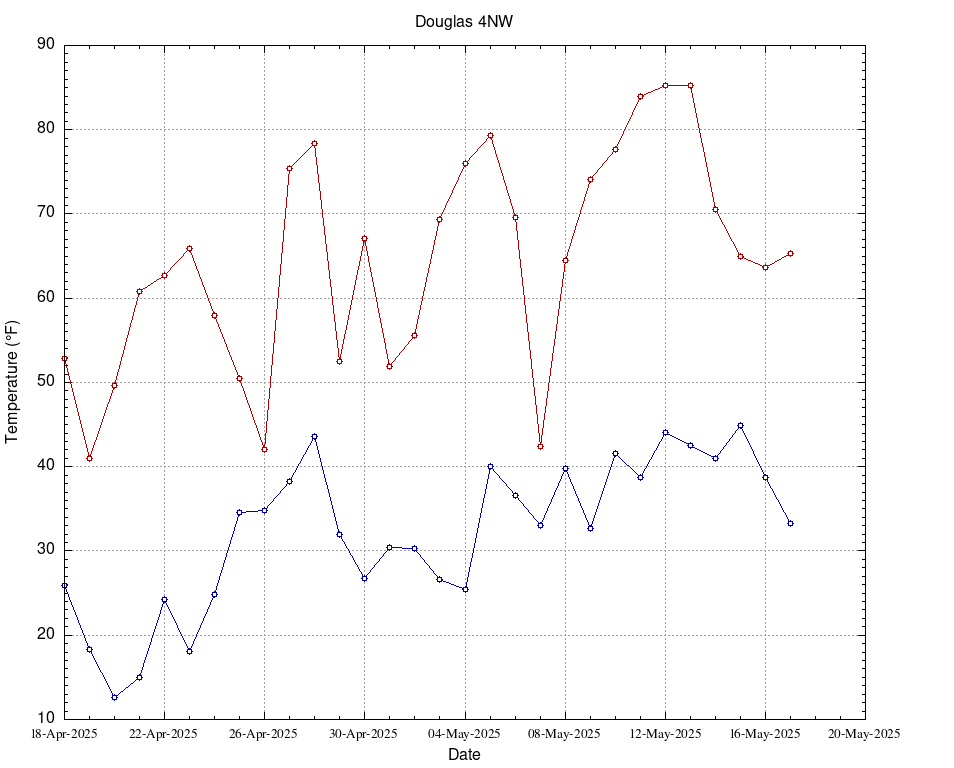
Week at a Glance
| Date | TMax (F) | TMin (F) | TAvg (F) | SoilTemp (F) | Avg Vapor Pressure (kPa) | Avg Sat Vapor Pressure (kPa) | Avg RH (%) | Solar Rad (w/m^2) | Avg Wind Spd (mph) | Precipitation (") |
| 2026-07-15 | 98.42 | 60.44 | 81.90 | 84.70 | 1.14 | 3.94 | 35 | 0.00 | 7.88 | 0.00 |
| 2026-07-16 | 95.49 | 62.10 | 79.52 | 85.10 | 1.15 | 3.63 | 36 | 344.00 | 5.63 | 0.00 |
| 2026-07-17 | 97.56 | 56.86 | 78.93 | 85.06 | 1.17 | 3.62 | 39 | 349.00 | 4.95 | 0.00 |
| 2026-07-18 | 98.67 | 54.97 | 79.34 | 85.03 | 1.09 | 3.72 | 37 | 335.50 | 4.80 | 0.00 |
| 2026-07-19 | 98.11 | 57.11 | 81.48 | 85.12 | 1.09 | 3.93 | 33 | 333.70 | 8.40 | 0.00 |
| 2026-07-20 | 101.71 | 64.24 | 81.72 | 85.01 | 1.28 | 3.89 | 36 | 251.70 | 4.31 | 0.00 |
| 2026-07-21 | 102.02 | 57.34 | 81.84 | 85.50 | 1.27 | 4.04 | 38 | 330.30 | 5.73 | 0.00 |
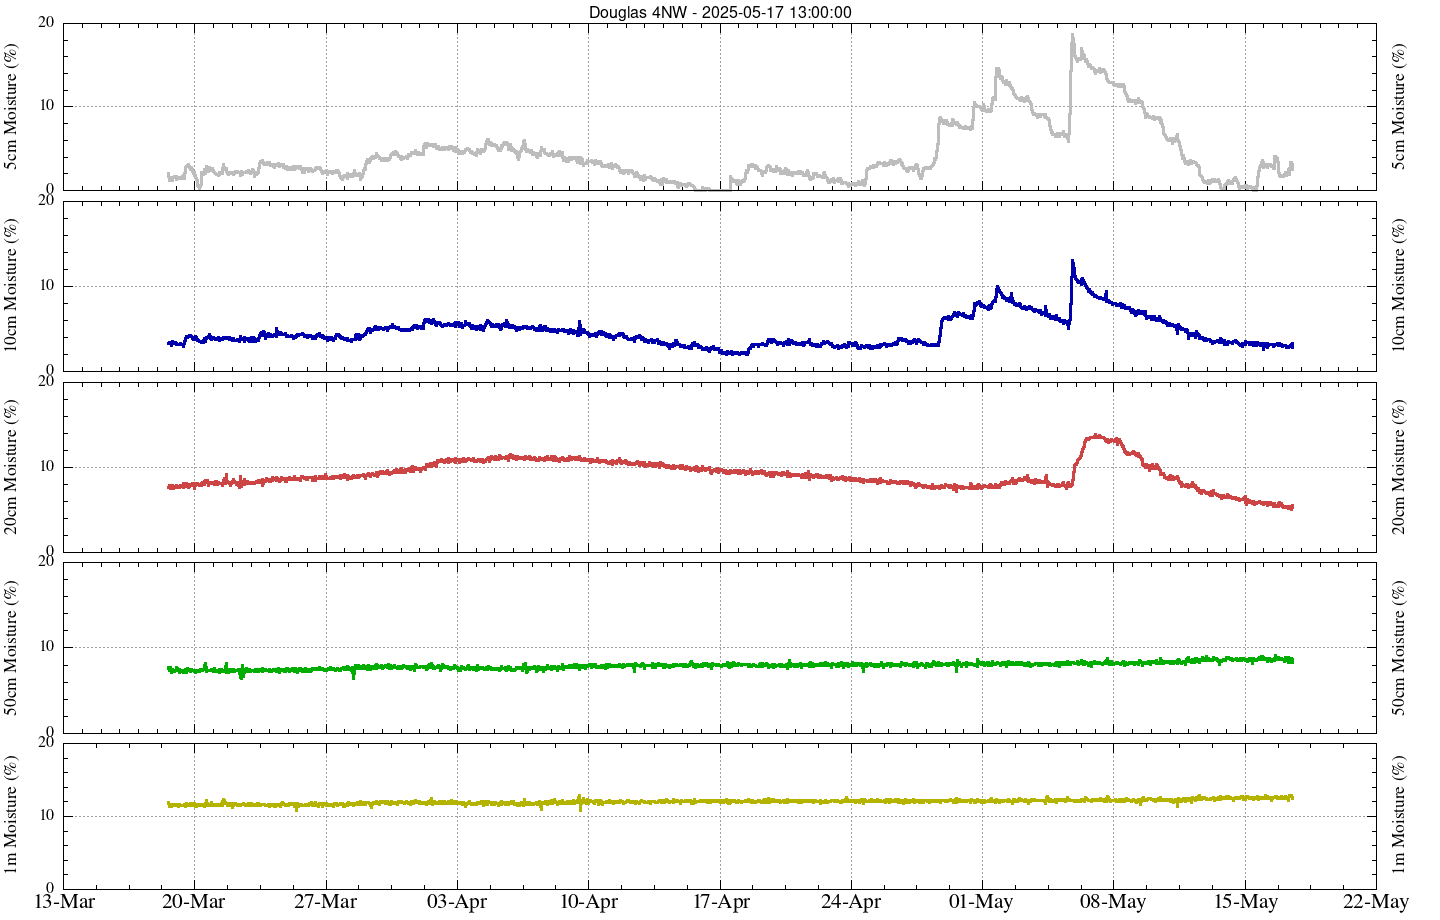
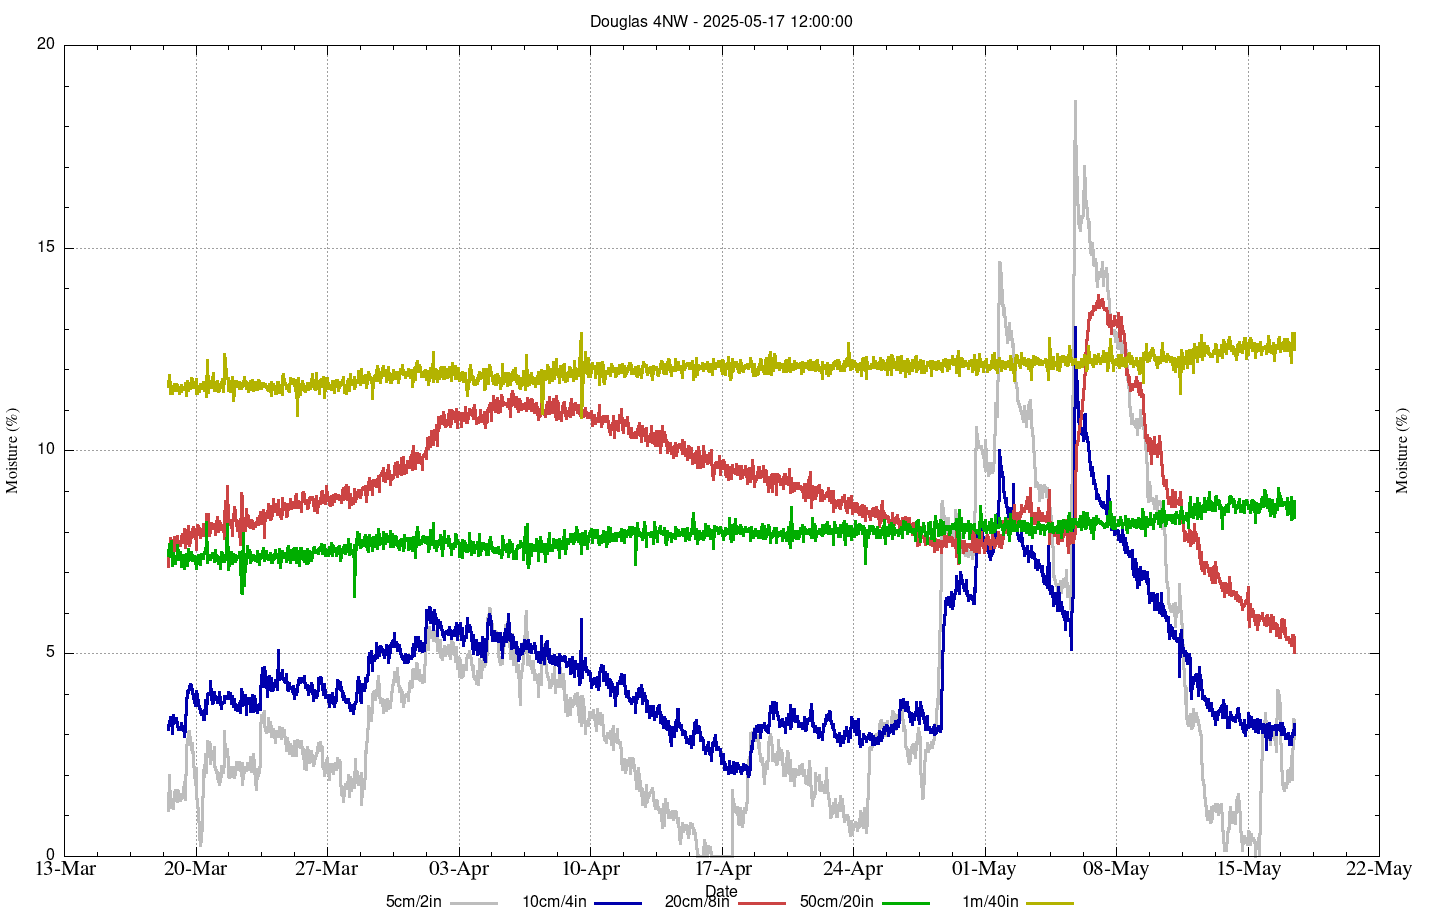
Soil Moisture
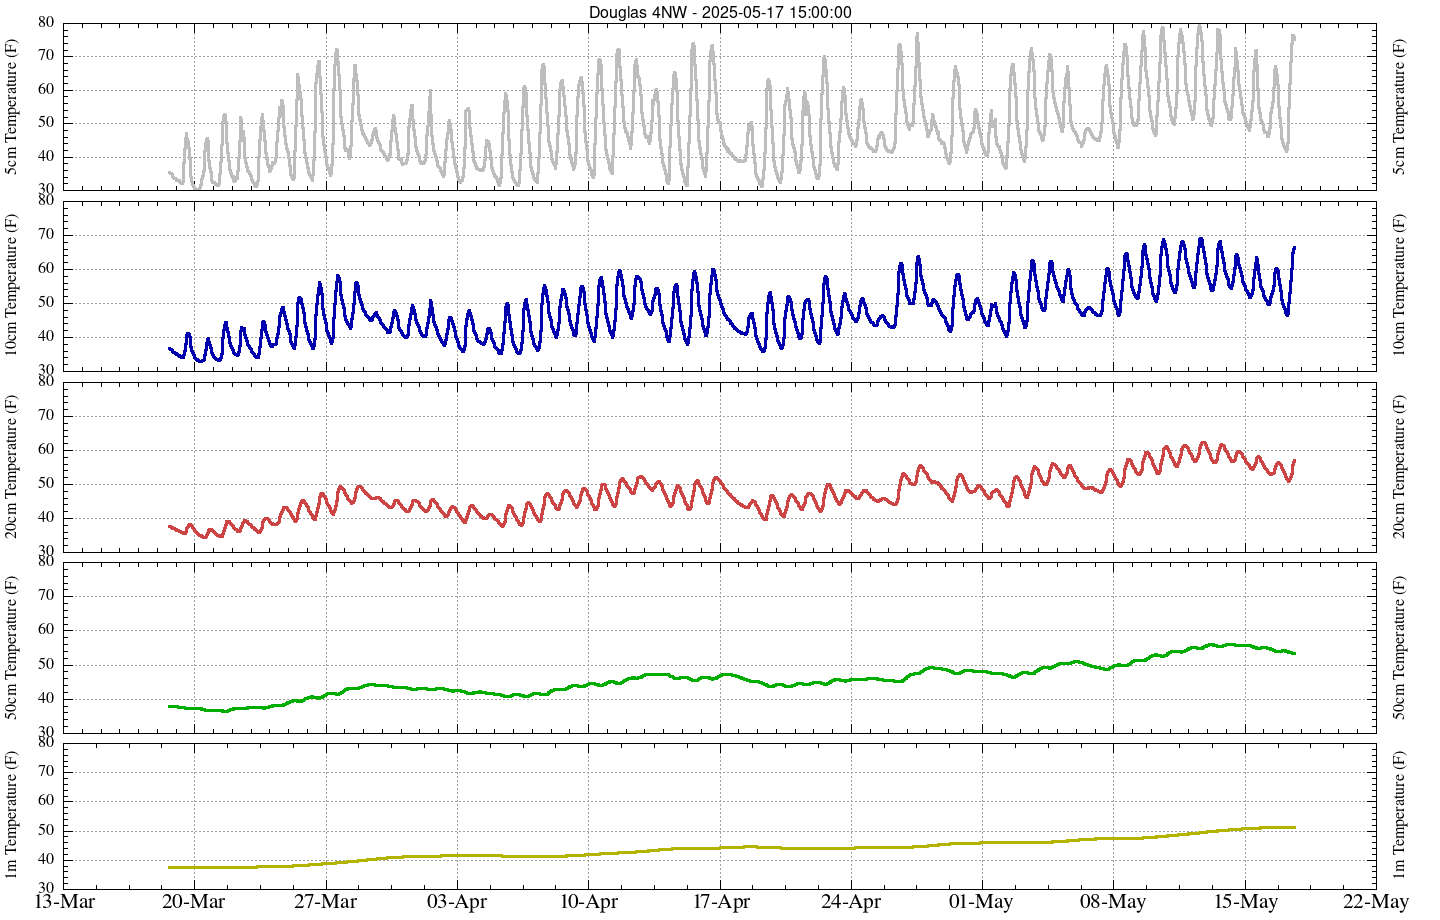
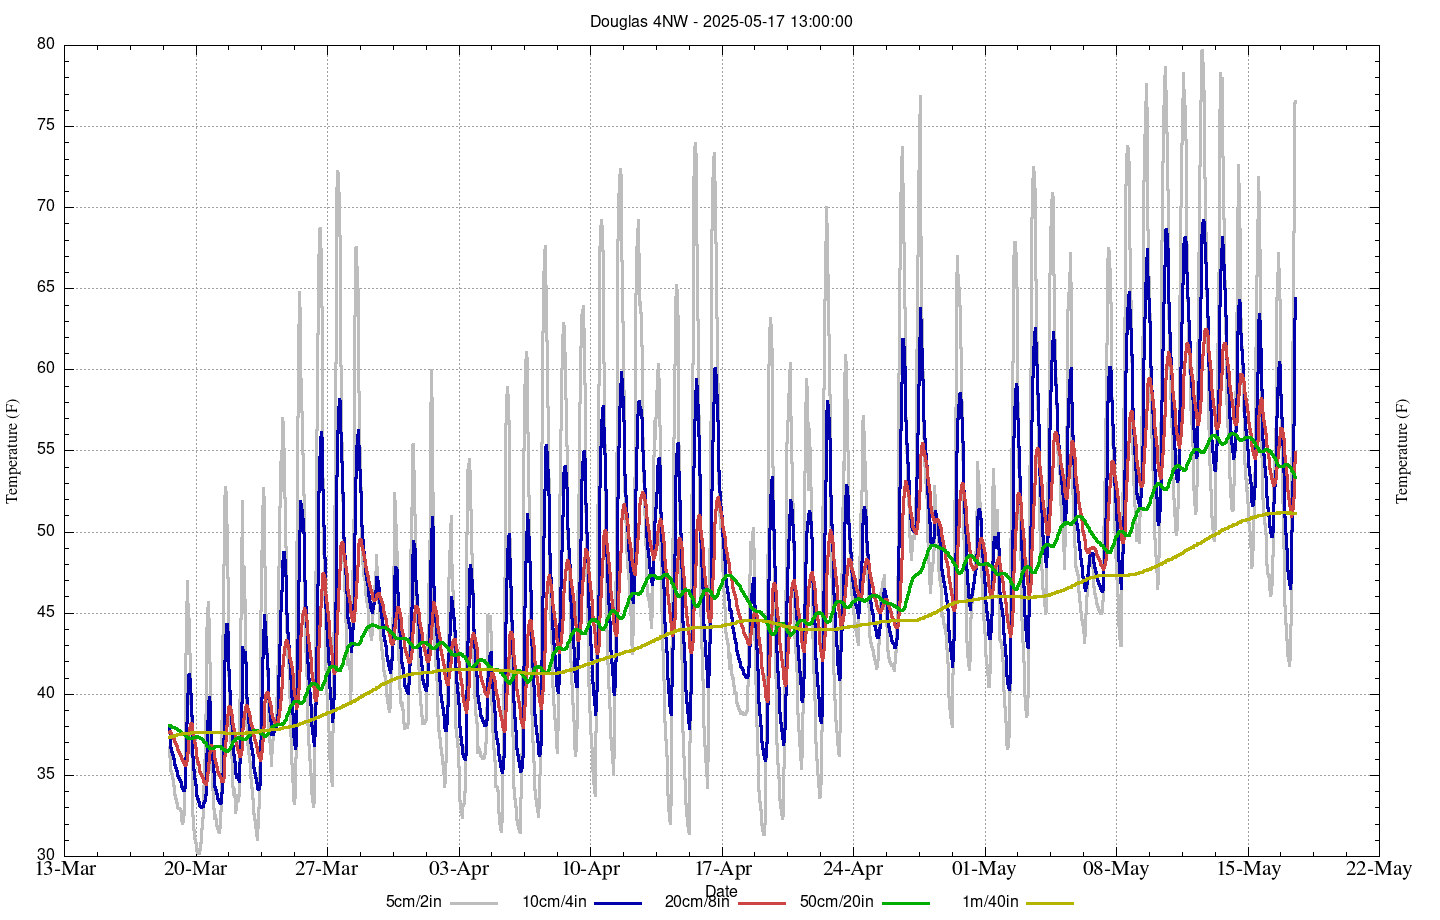
Soil Temperature
Hourly Charts for Last 30 Days | Daily Charts for Last 1000 days