Water Resources Data System & State Climate Office
Water Resources Data System & State Climate Office
Water Resources Data System & State Climate Office


Station Map | WACNet Home
Week at a Glance
| Date | TMax (F) | TMin (F) | TAvg (F) | SoilTemp (F) | Avg Vapor Pressure (kPa) | Avg Sat Vapor Pressure (kPa) | Avg RH (%) | Solar Rad (w/m^2) | Avg Wind Spd (mph) | Precipitation (") |
| 2026-07-15 | 99.03 | 54.21 | 79.54 | 82.60 | 0.80 | 3.78 | 28 | 0.00 | 5.67 | 0.00 |
| 2026-07-16 | 95.65 | 49.66 | 76.53 | 82.56 | 0.92 | 3.38 | 33 | 0.00 | 5.91 | 0.00 |
| 2026-07-17 | 94.75 | 58.68 | 77.61 | 83.28 | 1.20 | 3.42 | 43 | 0.00 | 7.28 | 0.00 |
| 2026-07-18 | 95.58 | 54.70 | 78.51 | 83.50 | 1.02 | 3.56 | 35 | 0.00 | 5.72 | 0.00 |
| 2026-07-19 | 99.39 | 57.34 | 79.03 | 84.67 | 1.23 | 3.60 | 40 | 0.00 | 5.49 | 0.00 |
| 2026-07-20 | 97.77 | 66.63 | 80.60 | 85.89 | 1.15 | 3.73 | 35 | 0.00 | 4.47 | 0.00 |
| 2026-07-21 | 99.64 | 56.50 | 80.28 | 84.92 | 1.00 | 3.79 | 31 | 0.00 | 7.19 | 0.00 |
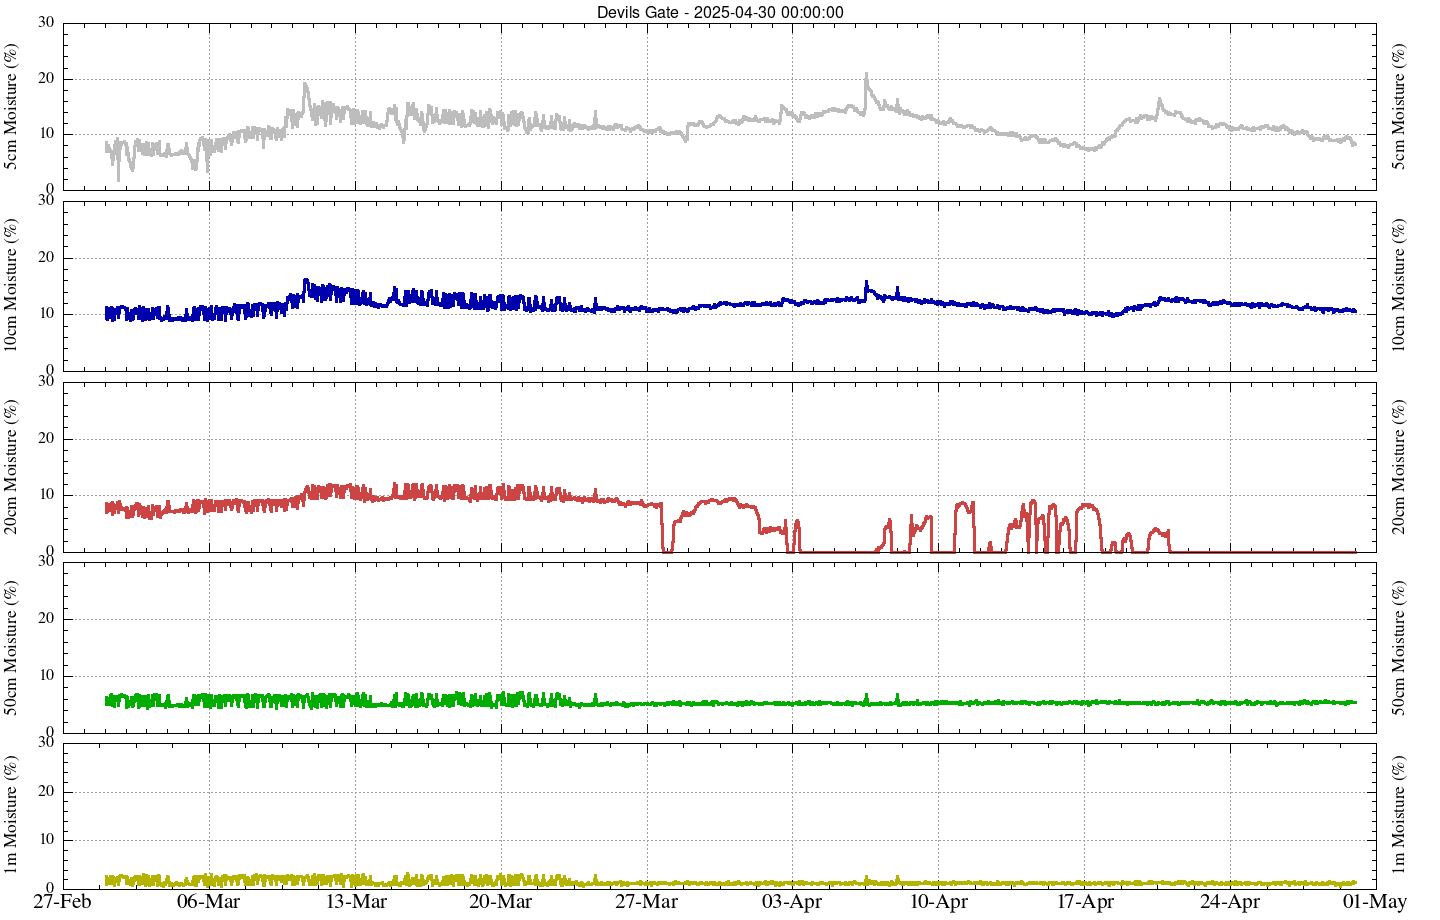
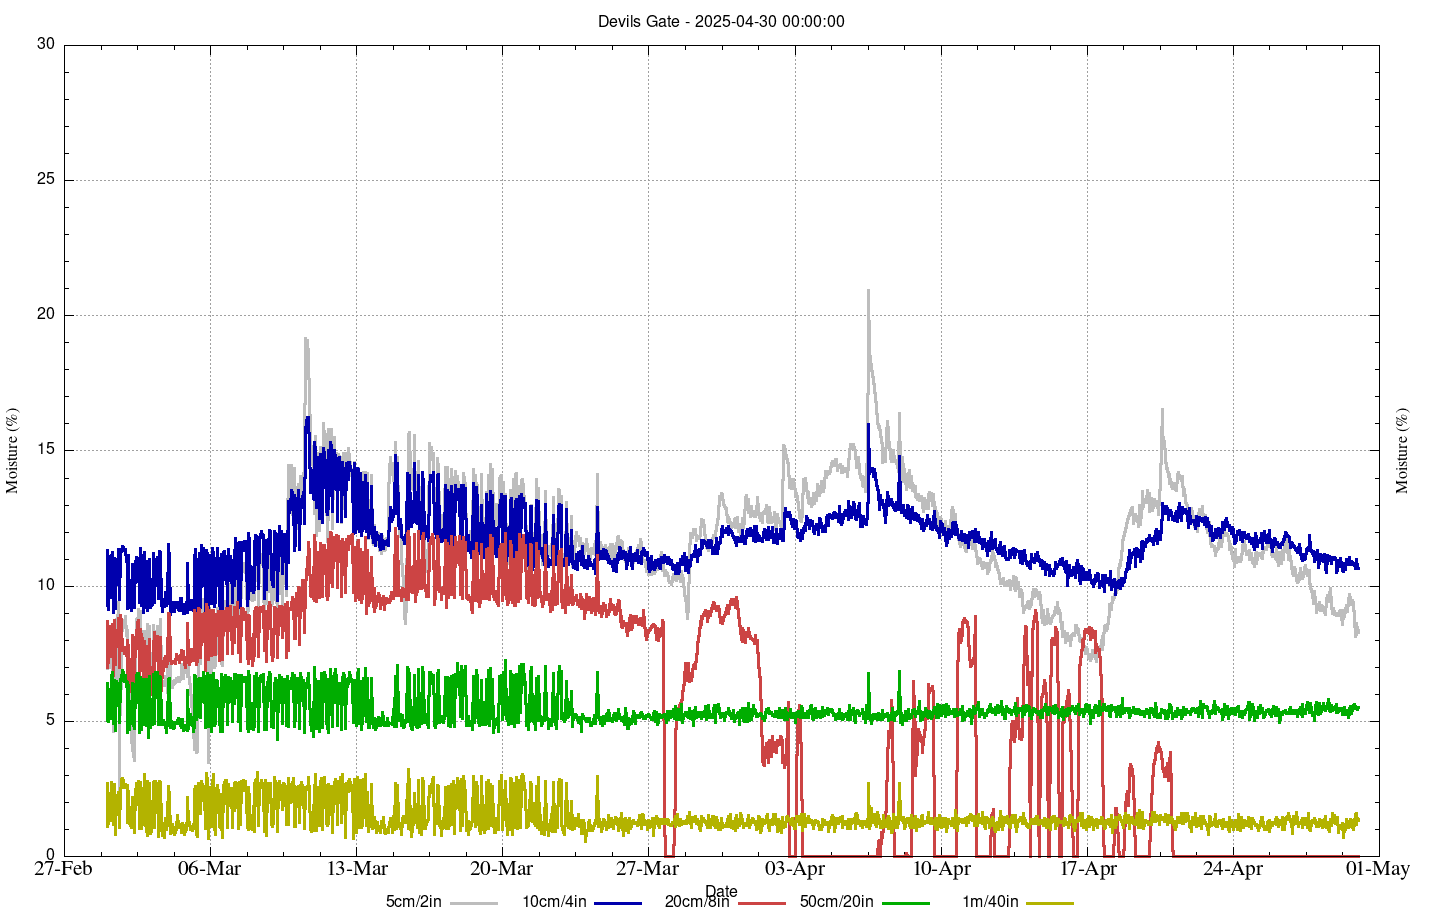
Soil Moisture
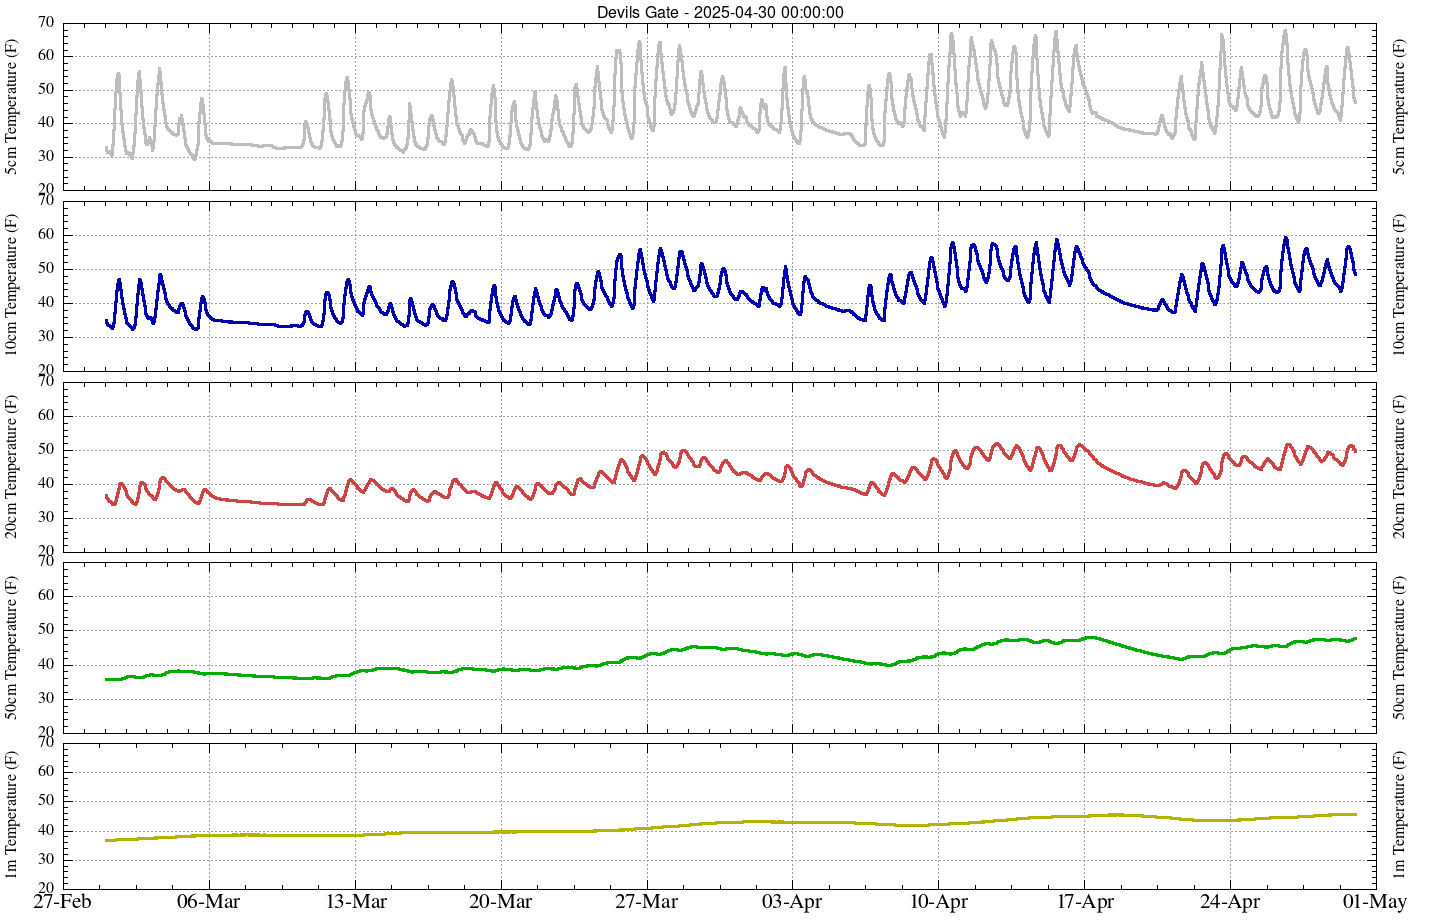
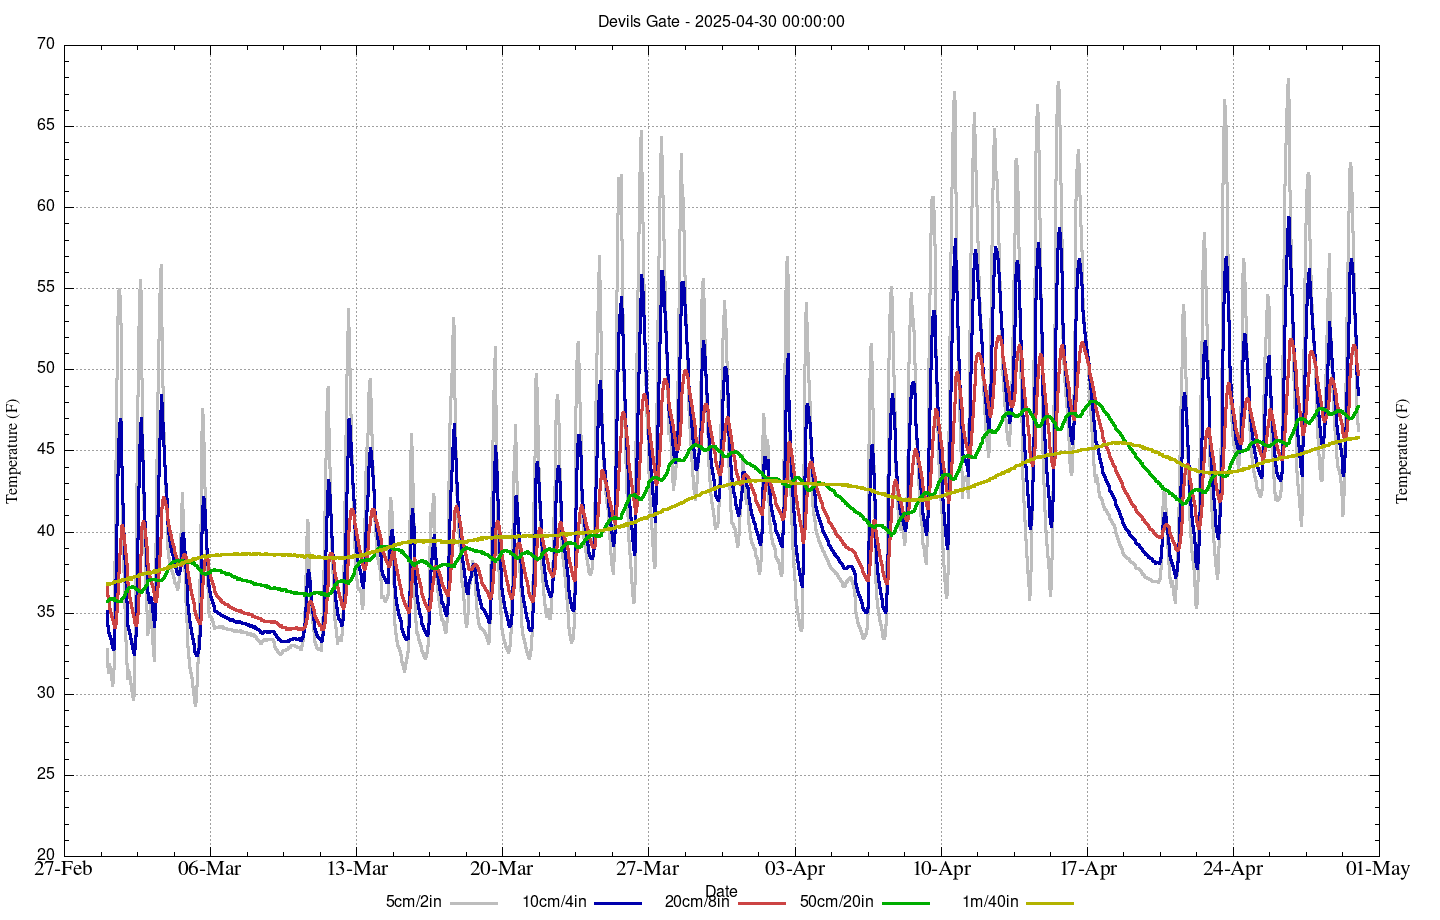
Soil Temperature
Hourly Charts for Last 30 Days | Daily Charts for Last 1000 days