Water Resources Data System & State Climate Office
Water Resources Data System & State Climate Office
Water Resources Data System & State Climate Office


Station Map | WACNet Home
Week at a Glance
| Date | TMax (F) | TMin (F) | TAvg (F) | SoilTemp (F) | Avg Vapor Pressure (kPa) | Avg Sat Vapor Pressure (kPa) | Avg RH (%) | Solar Rad (w/m^2) | Avg Wind Spd (mph) | Precipitation (") |
| 2026-07-15 | 94.98 | 50.70 | 73.62 | 32.00 | 0.92 | 3.12 | 36 | 306.80 | 4.95 | 0.00 |
| 2026-07-16 | 91.87 | 46.19 | 72.39 | 32.00 | 0.90 | 3.01 | 38 | 316.40 | 4.24 | 0.00 |
| 2026-07-17 | 90.23 | 49.68 | 72.93 | 32.00 | 1.16 | 2.93 | 44 | 278.50 | 3.66 | 0.00 |
| 2026-07-18 | 89.01 | 53.89 | 73.38 | 32.00 | 1.30 | 2.96 | 48 | 287.40 | 4.01 | 0.00 |
| 2026-07-19 | 90.37 | 55.44 | 73.99 | 32.00 | 1.37 | 2.98 | 50 | 281.10 | 4.27 | 0.00 |
| 2026-07-20 | 92.08 | 50.36 | 70.81 | 32.00 | 1.41 | 2.78 | 59 | 295.60 | 3.03 | 0.07 |
| 2026-07-21 | 95.11 | 55.98 | 74.62 | 32.00 | 1.40 | 3.15 | 51 | 306.30 | 4.11 | 0.00 |
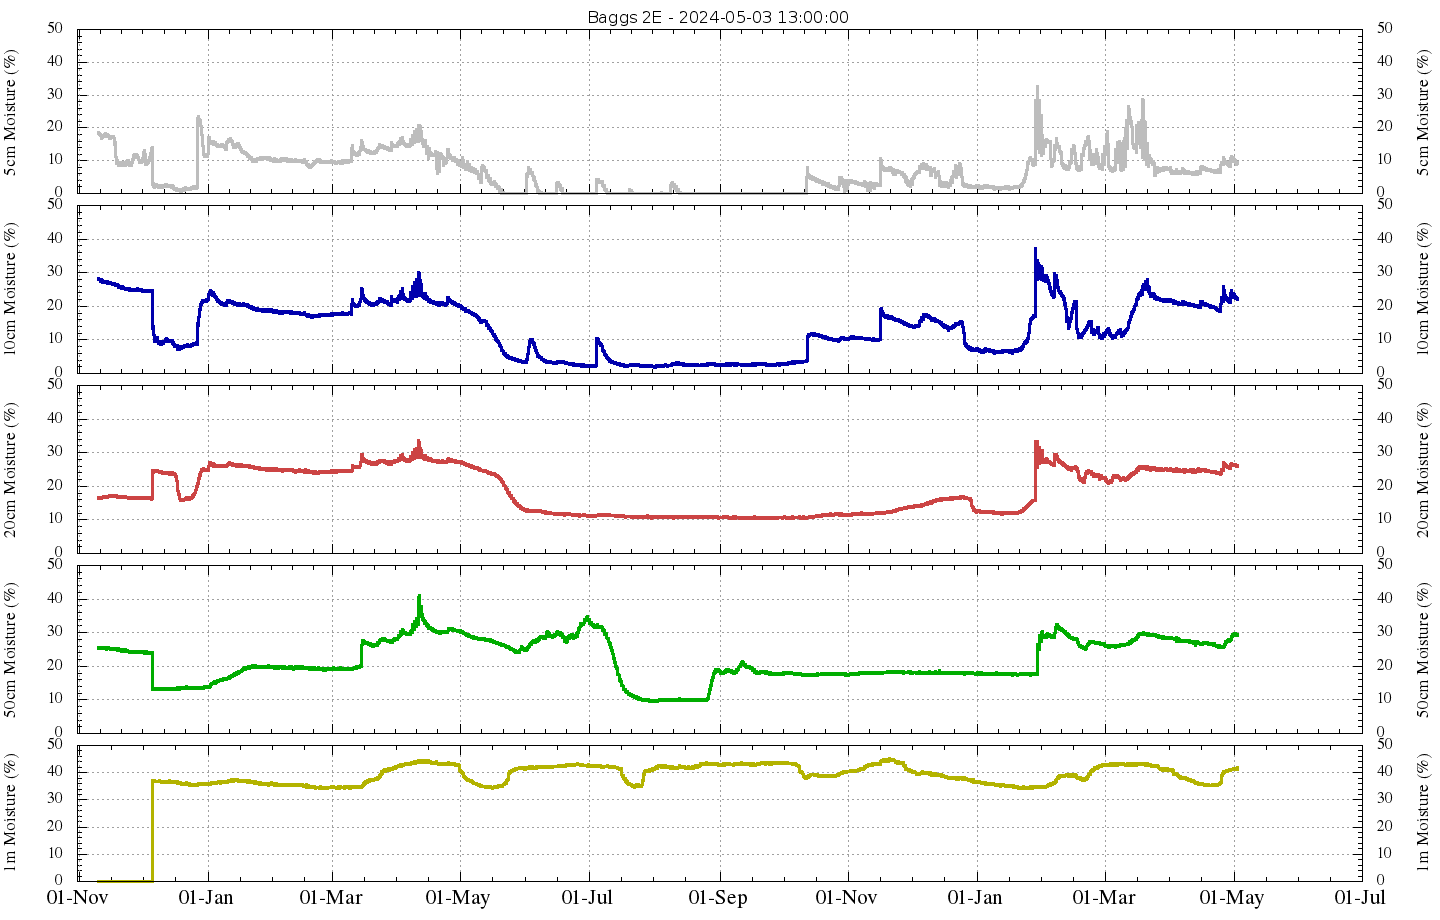
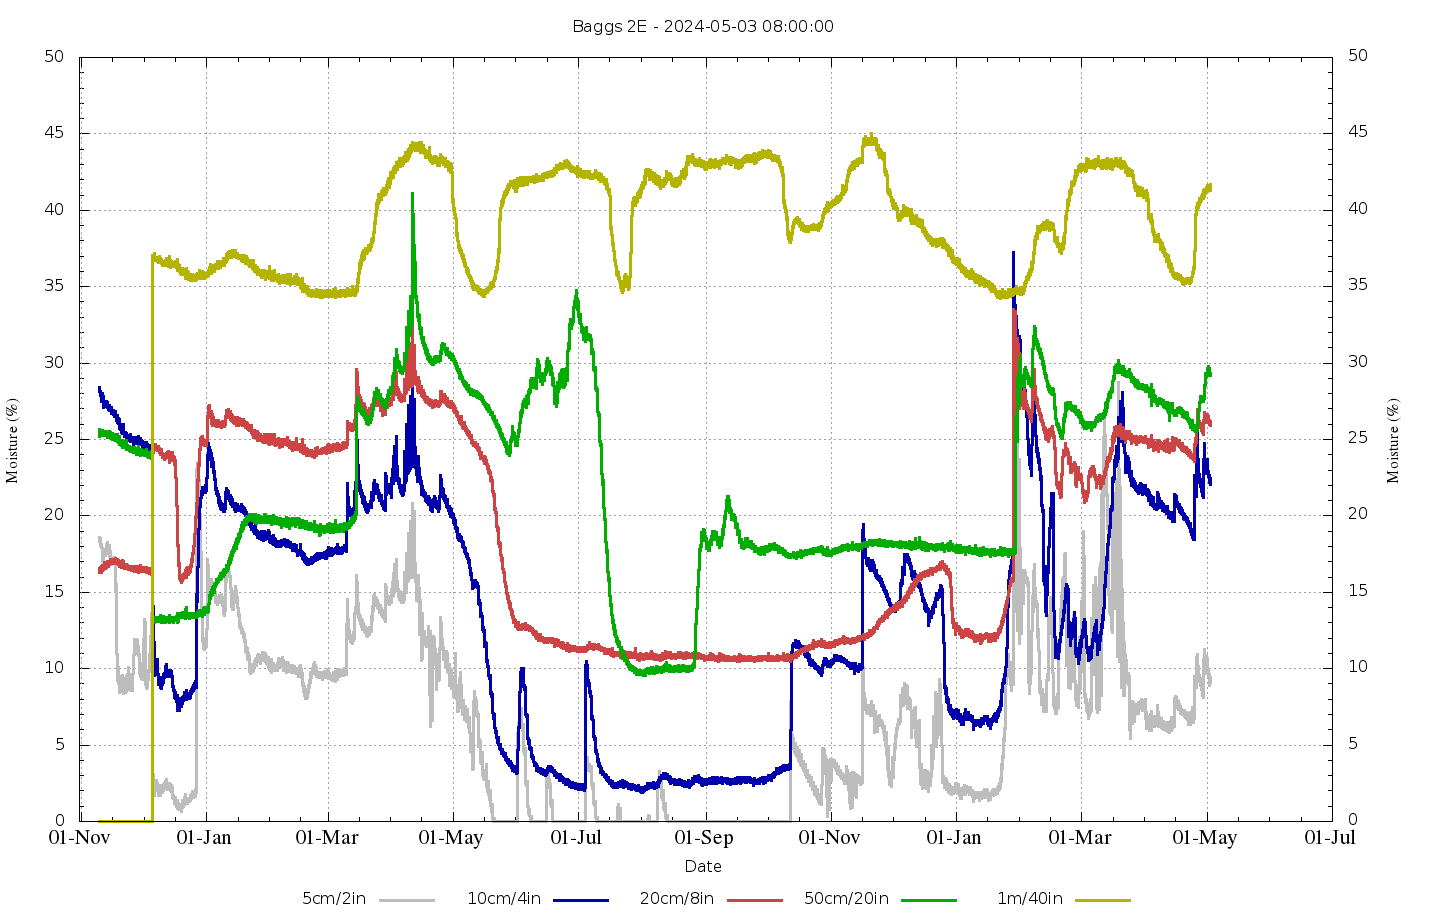
Soil Moisture
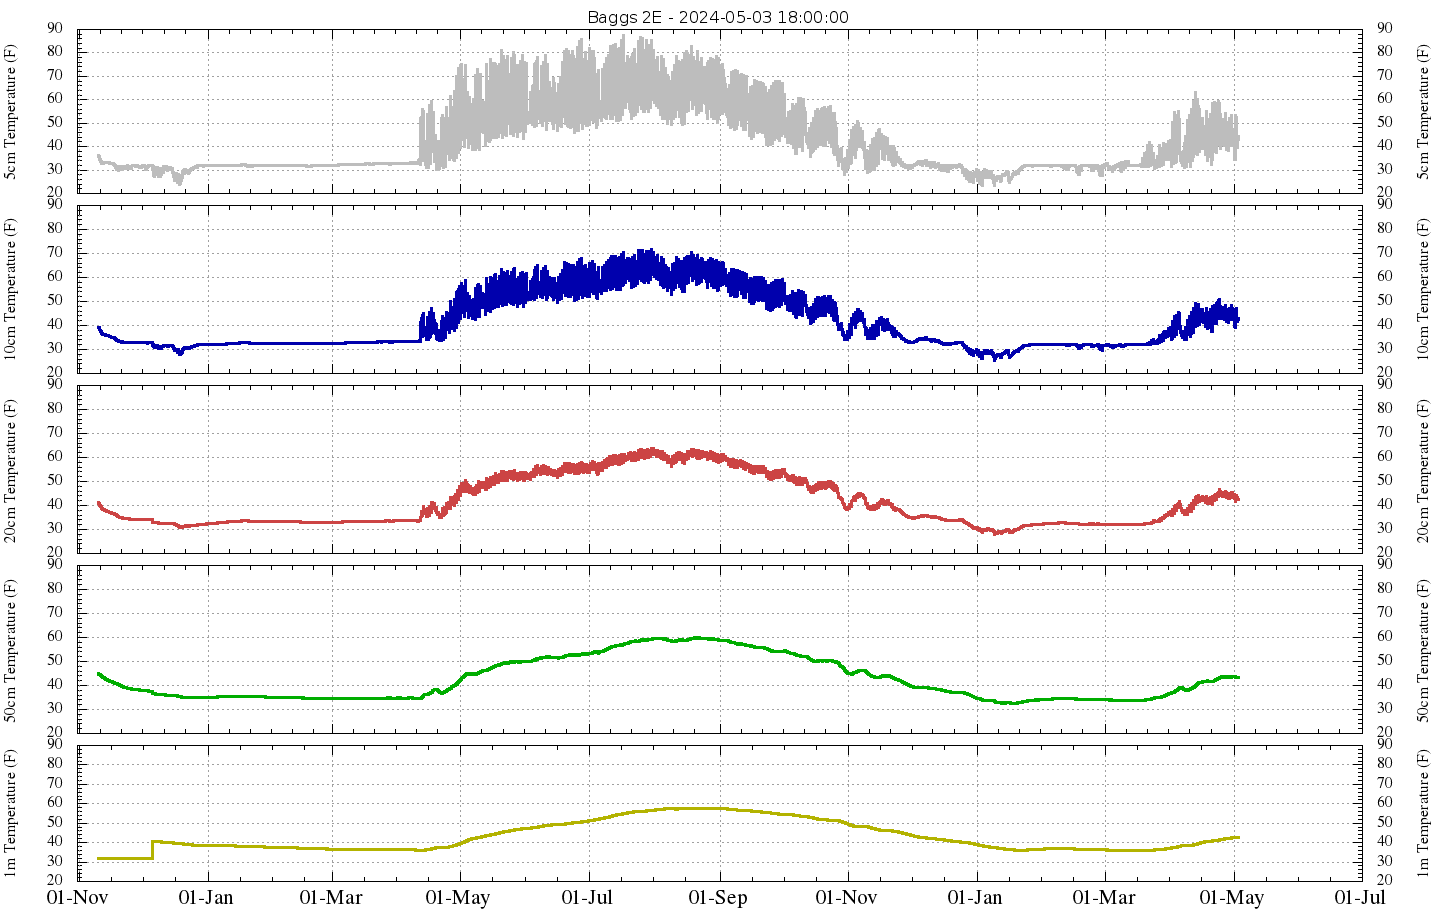
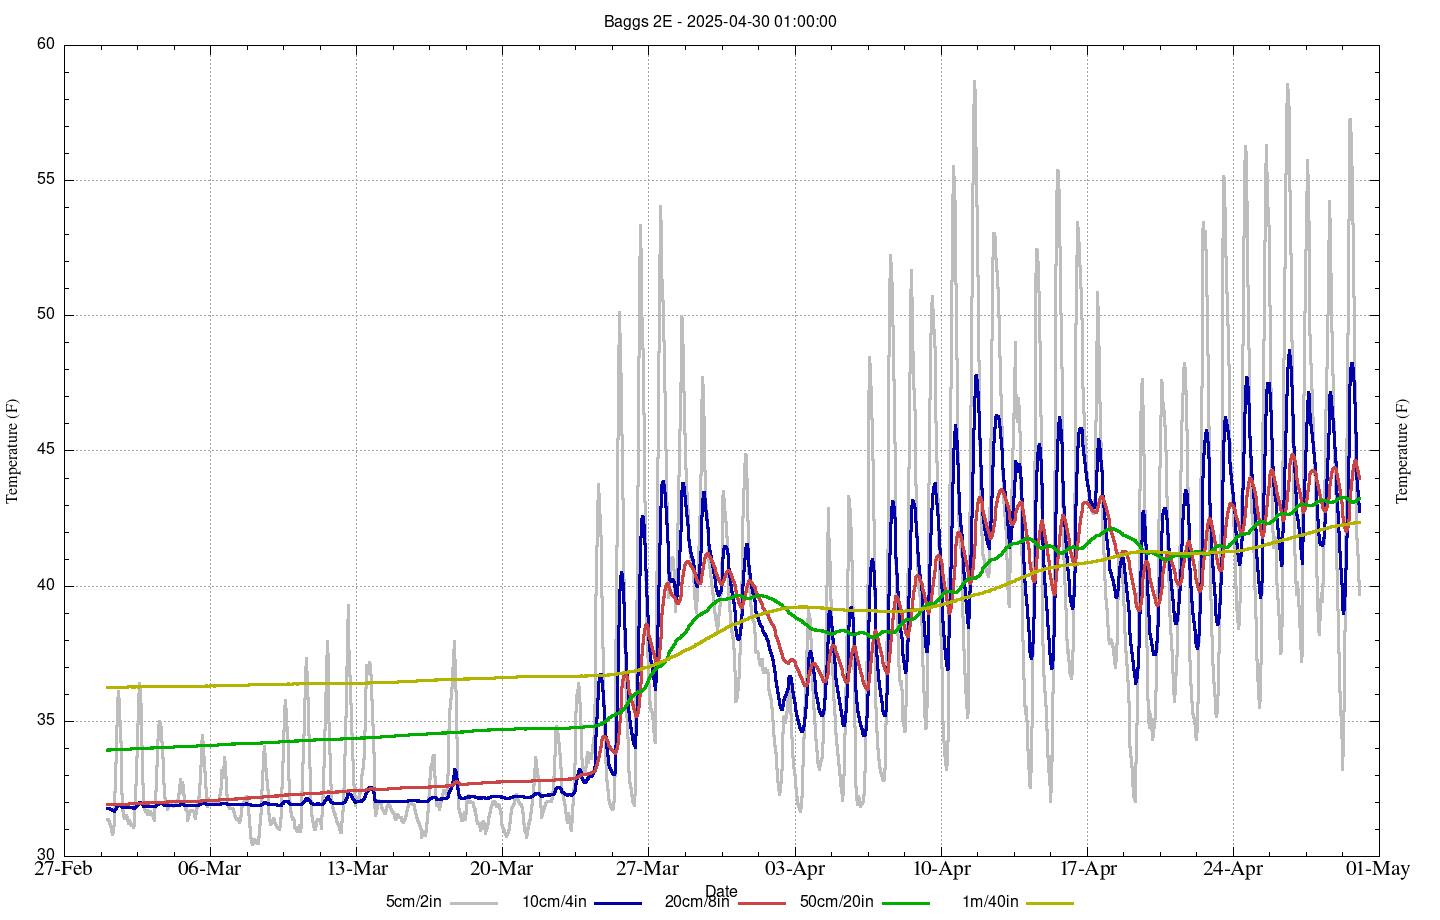
Soil Temperature
Hourly Charts for Last 30 Days | Daily Charts for Last 1000 days