 Upper Air ClimatologyUpper Air Climatology
Wyoming's upper level climate data are limited to rawinsonde (balloon soundings) taken twice daily at Riverton and by an atmospheric profiler with soundings taken at six-minute intervals at Medicine Bow. Upper air data combined with satellite sounding measurements are used in conjunction with surface weather reports to generate numerical weather forecasts. The aviation community is particularly interested in these forecasts for potential turbulence and icing conditions.
Winds aloft increase in velocity with height and are strongest in the winter and weakest in the summer. The Climate Diagnostics Center has a valuable website that allows users to input various time periods and pressure levels to create customized charts.116
Examples of annual wind vectors for various mandatory levels from 1948-2002 are shown in Figure 15.1 (1000mb), Figure 15.2 (850mb), Figure 15.3 (700mb), Figure 15.4 (500mb), and Figure 15.5 (400mb).
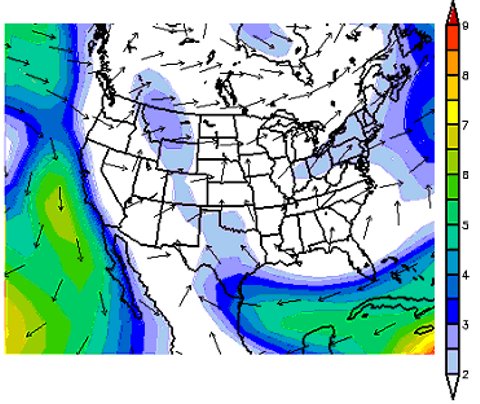
Figure 15.1. North American vector winds at 1000 mb (1948-2002) in m s-1
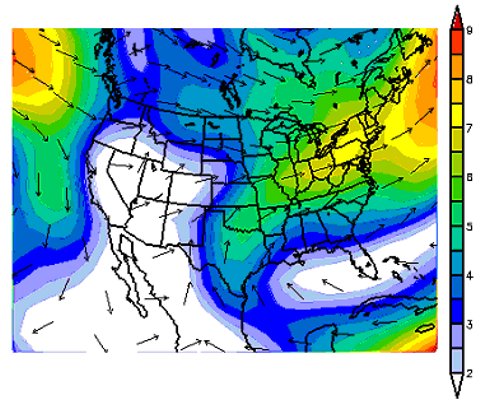
Figure 15.2. North American vector winds at 850 mb (1948-2002) in m s-1
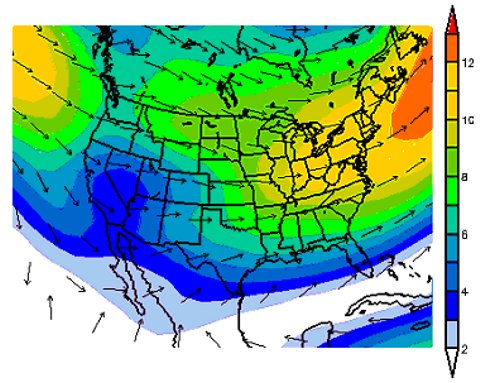
Figure 15.3. North American vector winds at 700 mb (1948-2002) in m s-1
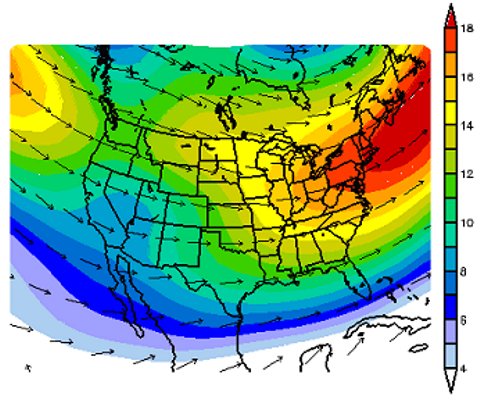
Figure 15.4. North American vector winds at 500 mb (1948-2002) in m s-1
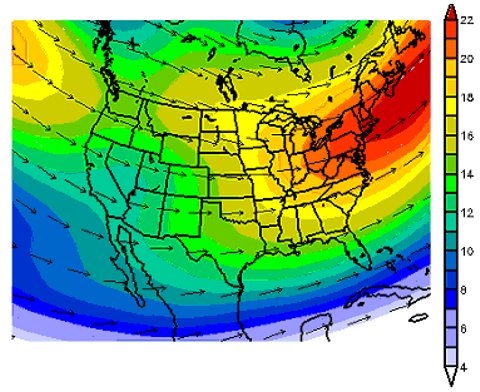
Figure 15.5. North American vector winds at 400 mb (1948-2002) in m s-1
Although Normals are not usually computed for upper air, Table 15.A. provides a summary of the average annual meteorological elements taken between 800 mb and 500 mb at 00UT and 12UT for Riverton/Lander from 1961-90 (over 21,000 reports). Note that the late afternoon values (00UT, universal time or 5PM Mountain Standard Time) reveal generally higher temperatures, lower relative humidity, slightly more westerly wind, and higher average wind speeds than the 12UT (5AM MST) soundings. The monthly averages are shown graphically in Figure 15.6, Figure 15.7, Figure 15.8, and Figure 15.9.
|
Table 15.A. Riverton/Lander upper level soundings annual averages at 00UT and 12UT (1961-1990). |
|
Pres |
Height |
Temp |
R.H. |
Tdew |
ResDir |
ResSpd |
u-vel |
v-vel |
AvgSpd |
|
mb |
m |
deg C |
Pct |
deg C |
Deg N |
ms-1 |
ms-1 |
ms-1 |
ms-1 |
|
00UT | |||||||||
|
850 |
1468.0 |
|
|
|
|
|
|
|
|
|
800 |
1975.7 |
9.5 |
36.9 |
-6.4 |
272.5 |
1.7 |
1.7 |
-0.1 |
4.3 |
|
750 |
2506.7 |
5.7 |
39.3 |
-8.9 |
276.4 |
2.6 |
2.6 |
-0.3 |
5.1 |
|
700 |
3067.9 |
1.5 |
42.8 |
-11.3 |
275.6 |
4.4 |
4.4 |
-0.4 |
6.7 |
|
650 |
3659.1 |
-3.0 |
47.0 |
-14.0 |
276.4 |
6.5 |
6.5 |
-0.7 |
8.9 |
|
600 |
4289.1 |
-7.6 |
49.2 |
-17.7 |
279.1 |
8.5 |
8.4 |
-1.3 |
11.6 |
|
550 |
4959.0 |
-12.3 |
47.4 |
-22.6 |
279.5 |
10.1 |
10.0 |
-1.7 |
13.9 |
|
500 |
5682.2 |
-17.3 |
43.8 |
-28.4 |
278.1 |
11.4 |
11.3 |
-1.6 |
15.8 |
|
12UT | |||||||||
|
850 |
1485.8 |
|
|
|
|
|
|
|
|
|
800 |
1982.1 |
5.3 |
48.5 |
-6.1 |
270.6 |
1.1 |
1.1 |
0.0 |
2.7 |
|
750 |
2506.8 |
3.0 |
47.2 |
-8.7 |
285.5 |
2.3 |
2.2 |
-0.6 |
4.3 |
|
700 |
3063.3 |
-0.3 |
47.3 |
-11.7 |
282.2 |
4.8 |
4.7 |
-1.0 |
6.9 |
|
650 |
3651.1 |
-4.2 |
48.4 |
-14.9 |
281.7 |
7.4 |
7.3 |
-1.5 |
10.0 |
|
600 |
4278.8 |
-8.3 |
47.6 |
-19.0 |
281.6 |
9.5 |
9.3 |
-1.9 |
12.8 |
|
550 |
4947.1 |
-12.8 |
45.3 |
-23.7 |
279.9 |
10.6 |
10.5 |
-1.8 |
14.6 |
|
500 |
5668.9 |
-17.9 |
42.9 |
-29.1 |
278.2 |
11.6 |
11.5 |
-1.7 |
16.1 |
ResDir = (Resultant Direction), ResSpd = (Resultant Speed), U-Vel = (Horizontal Velocity),V-Vel = (Vertical Velocity), AvgSpd = (Average Speed)
Figure 15.6. Riverton/Lander rawinsonde air temperature (celsius) climatology (1961-1990). 00UT and 12UT soundings have been averaged.
Figure 15.7. Riverton/Lander rawinsonde relative humidity (celsius) climatology (1961-1990)
Figure 15.8. Riverton/Lander rawinsonde resultant wind direction climatology (1961-1990)
Figure 15.9. Riverton/Lander rawinsonde resultant wind speed (m s-1) climatology (1961-1990)
Wyoming's only atmospheric wind profiler is located in Medicine Bow. The wind profilers in the NOAA Profiler Network (NPN) operate continuously, alternating sampling modes every 1 minute between a low or high mode, and switching beam positions (eastward, northward, or vertical) every 2 minutes. Each mode contains 36 range gates (sampling heights), spaced every 250 m in the vertical (Figure 15.10 and Figure 15.11). The low-mode samples the lower atmosphere, beginning at 500 m above ground level (AGL) and continues to 9.25 km AGL. The high mode slightly overlaps the top of the low mode, beginning at 7.5 km AGL and extends to a maximum height of 16.25 km AGL.
A comparison of winter (January) and summer (July) profiler wind direction and speed (1992-2001) shows a large difference in the frequency of occurrences. Although westerly winds predominate, there is a higher frequency of low-level westerlies in winter (Figure 15.12) than in summer (Figure 15.13). January wind speeds (Figure 15.14) are more than twice as strong as in July (Figure 15.15) and the frequency of low level winds of 30 mph is nearly three times as frequent in January. When comparing annual wind speeds118, there appears to be a measurable decrease in winds between 1992 and 2001 (Figure 15.16), although some inter-annual variability has been noted during this period. The slackening of winds may be reflecting a weakening of the thermal gradient between latitudes as the earth continues to rebound from the Little Ice Age that ended about 250 years ago.
Figure 15.10. NOAA's Atmospheric Profiler components
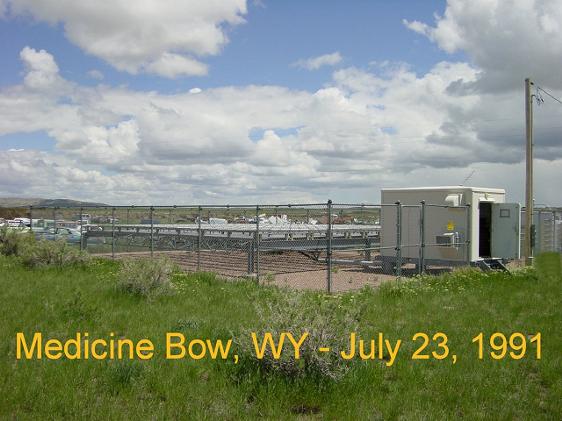
Figure 15.11. Photo of the Medicine Bow atmospheric profiler
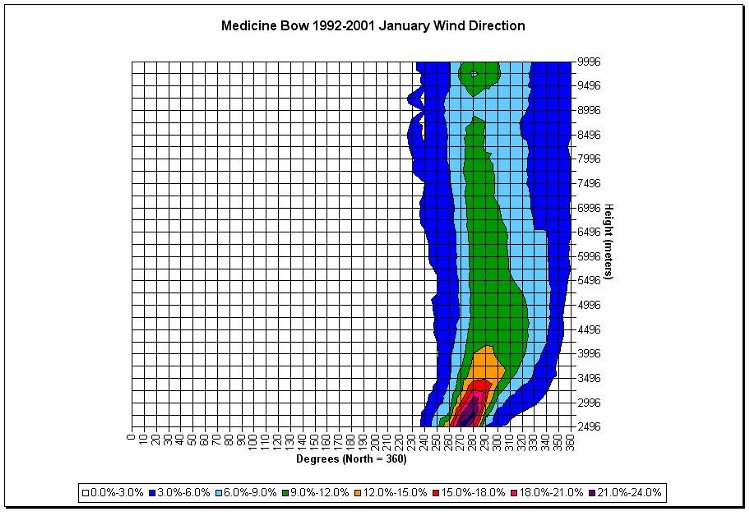
Figure 15.12. Medicine Bow wind profiler January wind direction frequency (1992-2001) based on hourly soundings
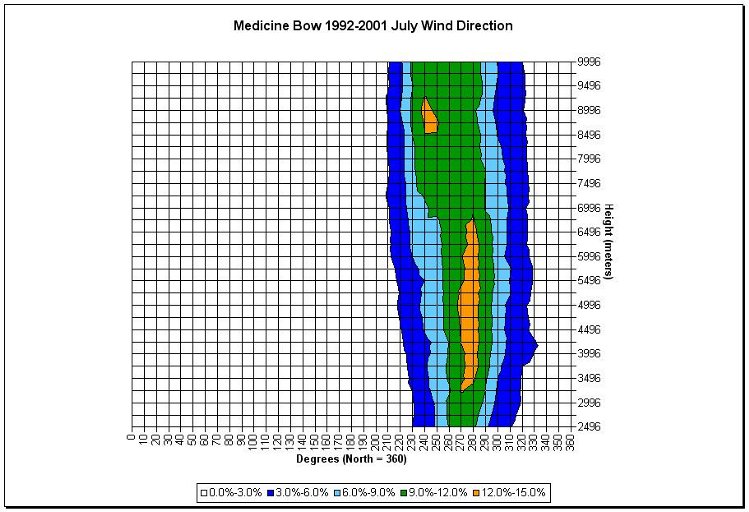
Figure 15.13. Same as Figure 15.12 except for July
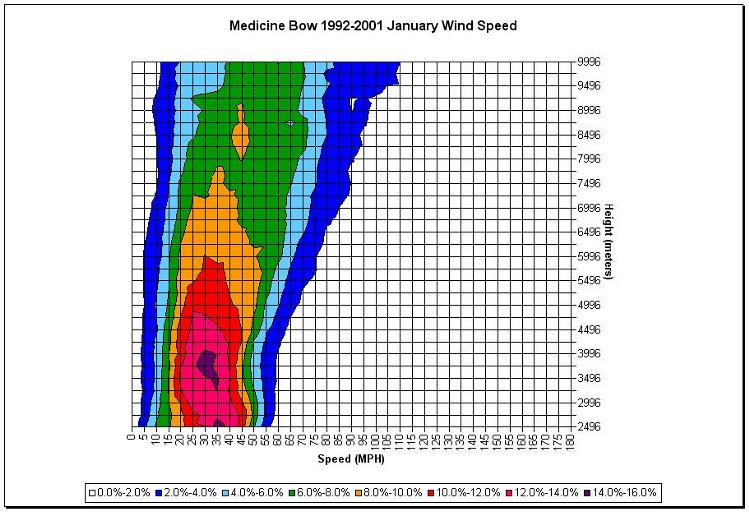
Figure 15.14. Medicine Bow wind profiler January wind speed frequency (1992-2001) based on hourly soundings
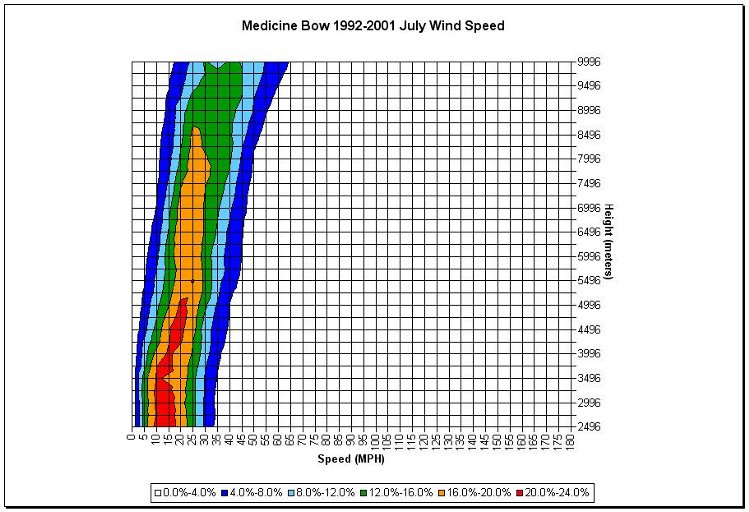
Figure 15.15. Same as Figure 15.14 except for July. Note the different frequency scale intervals.
Figure 15.16. Medicine Bow profiler annual wind speed frequency comparison based on hourly reports (1992 and 2001)
117#. http://www.profiler.noaa.gov/npn/profiler.jsp
118#. CD: upper_air, graphs, Medicine_Bow_profiler folders
| ← Previous Chapter | | Table of Contents | | Appendix → |
State Climate Office | Water Resources Data System
Last Modified: Fri, 23 May 2025