 MetadataMetadata
In Wyoming, there have been over 1,000 weather stations that have operated or changed locations during the past 120 years. These stations are listed in the Appendix D located at the back of this atlas. Generally, many weather stations have operated periodically for short or extended periods. It has been a very common occurrence for some stations to change locations by several feet or several miles and by a few to many feet in elevation. These moves usually result in some contamination in the climate record making any determination of meaningful trends problematic. Therefore, caution should be exercised when attempting to reconstruct any long term climate record from a weather station that has changed locations, no matter how small the change. Besides first and second order stations, several other types of stations comprise the weather monitoring network in Wyoming. In Figure 2.1, the network density in a 20 x 20 mile grid is shown. Note the low density of stations across much of the state, including the many gaps with no station coverage.
Routine surface weather observations are taken every 10- to 15-minutes at Wyoming's four first order stations in Casper, Cheyenne, Lander, and Sheridan, and at the 15 other stations using the Automated Surface Observing System (ASOS). ASOS began operations in 1996. With its operation came a major change in reporting weather observations. The METAR code was implemented and measurements were recorded in metric instead of English units. Slight rounding differences in temperature and dew point, as well as measuring cloud cover in octants instead of tenths were just some of the resulting differences. As a result, the 1971-2000 hourly Normal graphs, in this atlas were not produced. However, by developing the 1961-1990 hourly Normals graphs a very close approximation to the newest Normals period was achieved.12
Additionally, as of 2003, there were 28 Wyoming Department of Transportation (WYDOT) sites across the state that also provide 10- to 15-minute observations, although cloud data are not recorded. There were 41 secondary Remote Automated Weather Stations (RAWS) that are used to monitor fire potential in the western mountains and 229 Cooperative Observer (COOP) stations that mostly report daily maximums and minimums for temperature, and daily totals for precipitation and snow. About 206 stations operated under the Hydrometeorological Automated Data System13 to support flood and flash flood warnings, reporting at one to three hour intervals. There were 81 Snowpack Telemetry (SNOTEL) stations that measured the snow-water equivalent (SWE) at high altitude locations. Two agriculture sites, Torrington (Soil Climate Analysis Network, or SCAN) and Afton (Agricultural Weather Network, or AgriMet) report air and soil temperature at depth while Torrington also reports soil moisture to a depth of 40 inches. Other stations, such as Archer, WSO Casper, Gillete, Powell, and Wheatland, provide daily data to the Wyoming Climate Office after the end of each month. The state's only rawinsonde station at Riverton provides two daily upper air soundings, reaching heights in excess of 50,000 feet. The state is also home to an atmospheric profiler in Medicine Bow that has been in operation since the early 1990s. Unlike a balloon ascent that records winds, temperature, and humidity, the profiler records just wind direction, speed, and turbulence at intervals of less than 1,000 feet every six minutes. Implementation of the Community Collaborative Rain and Hail Study (CoCoRAHS)14 is expected to launch in Wyoming during the spring of 2004.
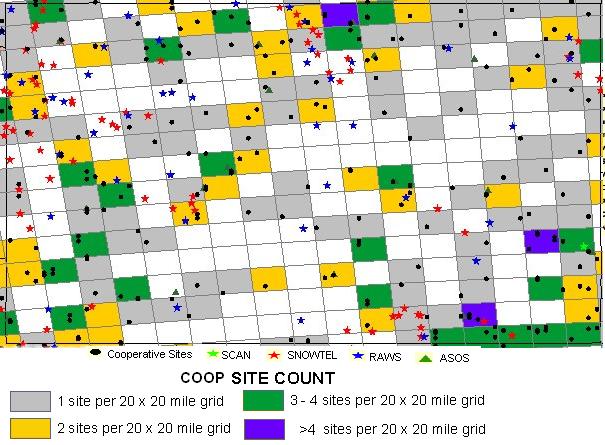
Figure 2.1. Weather station density across Wyoming. White squares indicate no COOP weather stations.15
With internet access, there is a wealth of weather and water related data that in some cases are updated continuously in the form of text and graphics.
In Table 2.A., a summary of the most important and reliable websites are identified. Some contain archived data for several days or weeks.
|
Table 2.A. Wyoming hydrometeorological networks |
|
NETWORK |
ELEMENTS |
REPORTING |
INTERNET* |
|
ASOS (20)/AWOS (4) |
most** |
hourly, |
http://www.joss.ucar.edu/
gapp/networks/images/regional/ |
|
COOP (229) |
max, min, precip, snow |
daily (Figure 2.2) |
http://tao.atmos.washington.edu/greg/
lowerrockies/states/WY/WY_map.html |
|
CWOP (10) |
most http://personal.riverusers.com/
~aprswest/javAPRS/wx.html |
3 minutes |
http://personal.riverusers.com/~aprswest/javAPRS/wx.html |
|
APRSWXNET (3) |
most, not clouds |
15 minutes |
http://www.joss.ucar.edu/ |
|
RAWS (41) |
Temperature,
humidity, wind, |
hourly |
http://www.wrcc.dri.edu/wraws/wyF.html |
|
HADS (206) |
most, not clouds or pressure |
15 minutes |
http://www.nws.noaa.gov/oh/hads/states/WY_dcps.htm |
|
AgriMet (1) |
Afton: most, not clouds, includes soil, solar |
15 minutes |
http://www.joss.ucar.edu/ |
|
AWDN (1) |
Torrington: most, no clouds |
http://www.joss.ucar.edu/ |
|
|
WYDOT (28) |
most, no clouds or pressure |
15 minutes (Figure 2.3) |
http://www.wyoroad.info/highway/roadbuddies.html |
|
BRIDGER-TETON NATIONAL FOREST (13) |
15 minutes Dec-APR |
http://www.joss.ucar.edu/ |
|
|
GLEES (1) |
most, soil, no clouds or pressure |
15 minutes |
http://www.fs.fed.us/
rm/landscapes/Locations/Glees/ |
|
NCEP PRECIP (87) |
precipitation, radar |
hourly |
http://www.joss.ucar.edu/ |
|
COOP 15-MIN PRECIPITATION (51) |
precipitation |
15 minutes see: WY Climate Atlas CD |
http://www.joss.ucar.edu/ |
|
SNOTEL (81) |
temperature, precip, snow depth (SWE) |
hourly (Figure 2.4) |
http://www.joss.ucar.edu/ |
|
WSR-88D RADAR (2) |
hourly precipitation estimates
http://www4.ncdc.noaa. |
6 minutes |
http://www.joss.ucar.edu/ |
|
UNIV OF OREGON SOLAR RADIATION (1) |
Green River: |
6 minutes |
http://www.joss.ucar.edu/ |
|
AMERIFLUX (1) |
CO2, energy flux
http://public.ornl.gov/ |
30 minutes |
http://www.joss.ucar.edu/ |
|
SCAN (1) |
Torrington: most, soil, no clouds |
hourly
http://www.wcc.nrcs. |
http://www.joss.ucar.edu/ |
|
USGS (136) |
streamflow
http://water.usgs.gov/ |
near-real time |
http://www.joss.ucar.edu/ |
|
USBR RESERVOIR (12) |
reservoir levels, inflow, outflow |
daily |
|
|
NWS RADIOSONDE (1) |
Riverton: temperature, humidity, winds, pressure levels |
12 hours |
http://www.joss.ucar.edu/ |
|
NPN (1) |
Medicine Bow: winds at 250 m resolution |
6 minutes |
http://www.joss.ucar.edu/ |
|
GPS-MET (2) |
most, no clouds |
3 minutes |
http://www.joss.ucar.edu/ |
|
fS (>80) |
precip, snow, hail |
Daily |
|
|
WYvisnet (3) |
temp, RH, winds |
15 minutes |
|
|
Schoolnet (12) |
most, no clouds |
real time |
* (highlighted) portion of the website address is substituted for the specific coverage chart. ** most of the common weather elements are available.
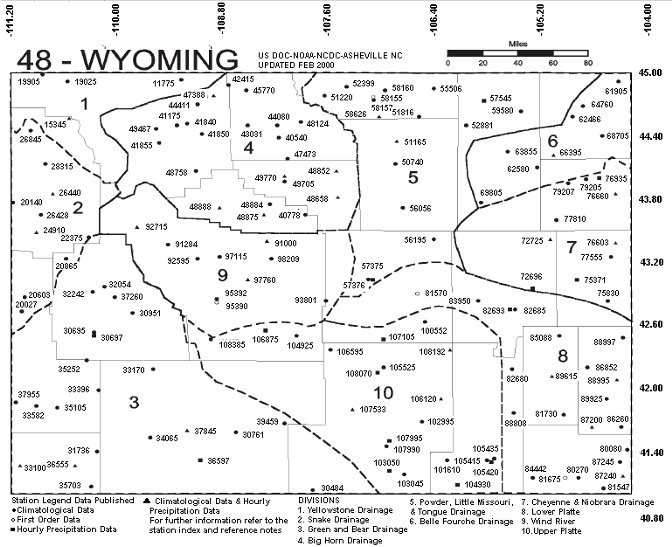
Figure 2.2. Current first order and precipitation Wyoming weather stations in operation. The boundaries of the 10 climate divisions are shown by dashed lines.
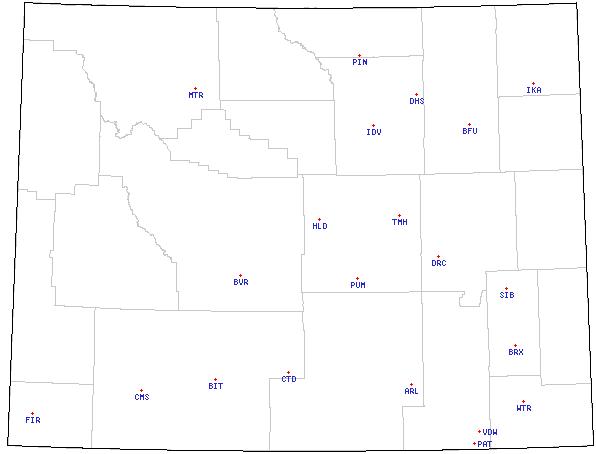
Figure 2.3. Wyoming Department of Transporation (WYDOT) roadside weather reporting stations
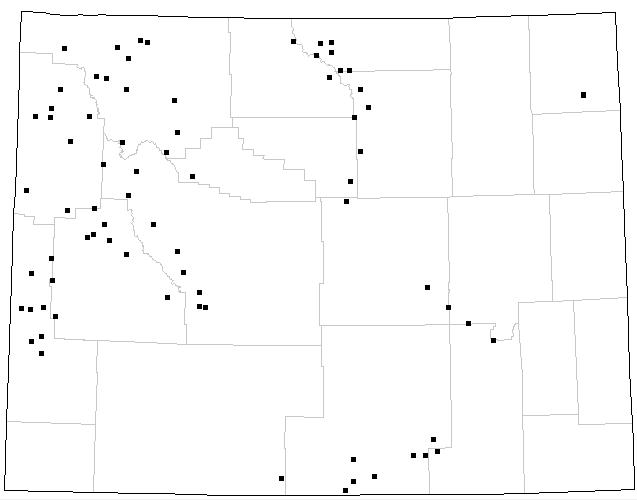
Figure 2.4. Wyoming Snow Telemetry (SNOTEL) stations
Although weather stations may have been in operation for several decades, each station will contain gaps in its climate record. In Figure 2.5, a graph of Evanston's record of observations reveals periodic gaps when data were unavailable. Caution should be exercised by not inferring that a large quantity of data means that the quality of data is high. This chart is available for any Wyoming station within the Western Region Climate Center's inventory see footnote.17
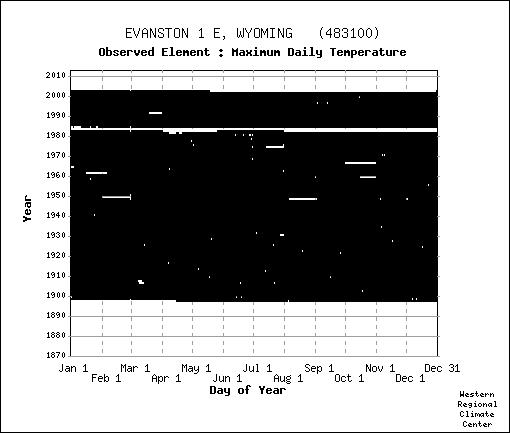
Figure 2.5. Metadata for Evanston's maximum daily temperature for the past 100+ years. White indicates no data available for specified dates.
13. http://www.nws.noaa.gov/ohd/hads/states/WY_dcps.htm
15. http://nwshqgis.nws.noaa.gov/website/coop/
16. http://www.eol.ucar.edu/projects/hydrometnet/wyoming/
17. http://www.wrcc.dri.edu/summary/climsmwy.html
| ← Previous Chapter | | Table of Contents | | Next Chapter → |
State Climate Office | Water Resources Data System
Last Modified: Fri, 23 May 2025