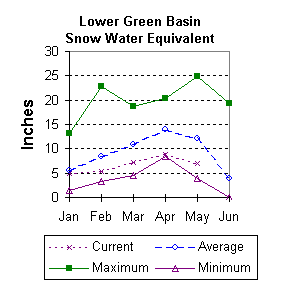
Streamflow
Expected yields vary from 37 to 72 percent of average across the
basin. The following forecast values are based on a 50 percent chance
probability for the April through July forecast period. Green River
near Green River is forecast to yield about 460,000-acre feet (51
percent of average). Blacks Fork near Robertson is forecast to yield
68,000-acre feet (72 percent of average). East Fork of Smiths Fork
near Robertson is estimated to yield 20,000 acre-feet (67 percent of
average). The estimated yield for Hams Fork near Frontier is 28,000-
acre feet (42 percent of average). Viva Naughton Reservoir inflow
will be about 33,000-acre feet (37 percent of average). Flaming Gorge
Reservoir inflow will be about 620,000-acre feet (52 percent of
average).
==================================================================================================================================
                                                     LOWER GREEN RIVER BASIN
                                               Streamflow Forecasts - May 1, 2001
==================================================================================================================================
                                              |  <<====== Drier ======  Future Conditions  =======  Wetter =====>>  |
                                              |                                                                     |
  Forecast Point                     Forecast |  ==================== Chance Of Exceeding * ======================  |
                                      Period  |    90%       70%    |  50% (Most Probable)  |      30%       10%    |  30-Yr Avg.
                                              | (1000AF)  (1000AF)  |   (1000AF)  (% AVG.)  |    (1000AF)  (1000AF) |    (1000AF)
====================================================================|=======================|=====================================
Green River nr Green River, WY       APR-JUL       277       386    |      460        51    |       534       643            899
                                                                    |                       |
Blacks Fork nr Robertson             APR-JUL        52        62    |       68        72    |        74        84             95
                                                                    |                       |
EF of Smiths Fork nr Robertson       APR-JUL      16.9      18.7    |       20        67    |        21        24             30
                                                                    |                       |
Hams Fk blw Pole Ck nr Frontier      APR-JUL      19.3        24    |       28        42    |        32        38             66
                                                                    |                       |
Hams Fk Inflow to Viva Naughton Res  APR-JUL      13.8        25    |       33        37    |        41        52             89
                                                                    |                       |
Flaming Gorge Reservoir Inflow       APR-JUL       365       517    |      620        52    |       723       875           1196
                                                                    |                       |
==================================================================================================================================
                         LOWER GREEN RIVER BASIN                        |                 LOWER GREEN RIVER BASIN
             Reservoir Storage (1000 AF) - End of April                 |        Watershed Snowpack Analysis - May 1, 2001
==================================================================================================================================
                                      Usable |  *** Usable Storage ***  |                            Number     This Year as % of
Reservoir                            Capacity|  This      Last          |   Watershed                  of       =================
                                             |  Year      Year     Avg  |                          Data Sites   Last Yr   Average
========================================================================|=========================================================
FONTENELLE                             344.8    117.2    118.6    161.8 |   HAMS FORK RIVER             4        82        50
                                                                        |
FLAMING GORGE                         3749.0   3041.2   3196.9      --- |   BLACKS FORK                 5        95        63
                                                                        |
VIVA NAUGHTON RES                               NO REPORT               |   HENRYS FORK                 3       204        88
                                                                        |
                                                                        |   GREEN above Flaming Gorge  26        93        58
                                                                        |
==================================================================================================================================
 * 90%, 70%, 30%, and 10% chances of exceeding are the probabilities that the actual volume will exceed the volumes in the table.

The average is computed for the 1961-1990 base period.

(1) - The values listed under the 10% and 90% Chance of Exceeding are actually 5% and 95% exceedance levels.
(2) - The value is natural volume - actual volume may be affected by upstream water management.


==================================================================================================================================
                                                     LOWER GREEN RIVER BASIN
                                               Streamflow Forecasts - April 1, 2001
==================================================================================================================================
                                              |  <<====== Drier ======  Future Conditions  =======  Wetter =====>>  |
                                              |                                                                     |
  Forecast Point                     Forecast |  ==================== Chance Of Exceeding * ======================  |
                                      Period  |    90%       70%    |  50% (Most Probable)  |      30%       10%    |  30-Yr Avg.
                                              | (1000AF)  (1000AF)  |   (1000AF)  (% AVG.)  |    (1000AF)  (1000AF) |    (1000AF)
====================================================================|=======================|=====================================
Green River nr Green River, WY       APR-JUL       244       373    |      460        51    |       547       676            899
                                                                    |                       |
Blacks Fork nr Robertson             APR-JUL        47        61    |       70        74    |        79        93             95
                                                                    |                       |
EF of Smiths Fork nr Robertson       APR-JUL      17.4        20    |       22        73    |        24        28             30
                                                                    |                       |
Hams Fk blw Pole Ck nr Frontier      APR-JUL      16.7        23    |       28        42    |        33        42             66
                                                                    |                       |
Hams Fk Inflow to Viva Naughton Res  APR-JUL        23        29    |       33        37    |        44        59             89
                                                                    |                       |
Flaming Gorge Reservoir Inflow       APR-JUL       319       498    |      620        52    |       742       921           1196
                                                                    |                       |
==================================================================================================================================
                         LOWER GREEN RIVER BASIN                        |                 LOWER GREEN RIVER BASIN
             Reservoir Storage (1000 AF) - End of March                 |        Watershed Snowpack Analysis - April 1, 2001
==================================================================================================================================
                                      Usable |  *** Usable Storage ***  |                            Number     This Year as % of
Reservoir                            Capacity|  This      Last          |   Watershed                  of       =================
                                             |  Year      Year     Avg  |                          Data Sites   Last Yr   Average
========================================================================|=========================================================
FONTENELLE                                      NO REPORT               |   HAMS FORK RIVER             4        71        60
                                                                        |
FLAMING GORGE                         3749.0   3025.0   3199.0      --- |   BLACKS FORK                 5        73        66
                                                                        |
VIVA NAUGHTON RES                       42.4     32.2     33.4     27.1 |   HENRYS FORK                 3        89        84
                                                                        |
                                                                        |   GREEN above Flaming Gorge  26        72        63
                                                                        |
==================================================================================================================================
 * 90%, 70%, 30%, and 10% chances of exceeding are the probabilities that the actual volume will exceed the volumes in the table.

The average is computed for the 1961-1990 base period.

(1) - The values listed under the 10% and 90% Chance of Exceeding are actually 5% and 95% exceedance levels.
(2) - The value is natural volume - actual volume may be affected by upstream water management.
 To May 2001 Basin Outlook Report Contents Page