

Streamflow
The fifty-percent chance April through July runoff in the Upper Green River
basin is forecast below average. Green River at Warren Bridge is expected
to yield about 205,000 acre-feet (77 percent of normal). Pine Creek above
Fremont Lake is expected to yield 88,000 acre-feet (85 percent of normal).
New Fork River near Big Piney is expected to yield about 310,000 acre-feet
(81 percent of normal). Fontenelle Reservoir Inflow is estimated to be
625,000 acre-feet (74 percent of average), and Big Sandy near Farson is
expected to be about 45,000 acre-feet (79 percent of normal).
==================================================================================================================================
                                                     UPPER GREEN RIVER BASIN
                                               Streamflow Forecasts - February 1, 2001
==================================================================================================================================
                                              |  <<====== Drier ======  Future Conditions  =======  Wetter =====>>  |
                                              |                                                                     |
  Forecast Point                     Forecast |  ==================== Chance Of Exceeding * ======================  |
                                      Period  |    90%       70%    |  50% (Most Probable)  |      30%       10%    |  30-Yr Avg.
                                              | (1000AF)  (1000AF)  |   (1000AF)  (% AVG.)  |    (1000AF)  (1000AF) |    (1000AF)
====================================================================|=======================|=====================================
Green River at Warren Bridge         APR-JUL       144       180    |      205        77    |       230       266            266
                                                                    |                       |
Pine Creek abv Fremont Lake          APR-JUL        70        81    |       88        85    |        95       106            104
                                                                    |                       |
New Fork River nr Big Piney          APR-JUL       186       260    |      310        81    |       360       434            385
                                                                    |                       |
Fontenelle Reservoir Inflow          APR-JUL       447       550    |      625        74    |       705       832            849
                                                                    |                       |
Big Sandy River nr Farson            APR-JUL        27        38    |       45        79    |        52        63             57
                                                                    |                       |
==================================================================================================================================
                         UPPER GREEN RIVER BASIN                        |                 UPPER GREEN RIVER BASIN
             Reservoir Storage (1000 AF) - End of January               |        Watershed Snowpack Analysis - February 1, 2001
==================================================================================================================================
                                      Usable |  *** Usable Storage ***  |                            Number     This Year as % of
Reservoir                            Capacity|  This      Last          |   Watershed                  of       =================
                                             |  Year      Year     Avg  |                          Data Sites   Last Yr   Average
========================================================================|=========================================================
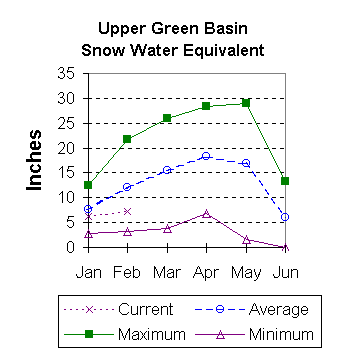
BIG SANDY                                       NO REPORT               |   GREEN above Warren Bridge   4        77        57
                                                                        |
EDEN                                            NO REPORT               |   UPPER GREEN (West Side)     7        68        57
                                                                        |
FLAMING GORGE                         3749.0   2992.0   3226.0      --- |   NEWFORK RIVER               3        98        77
                                                                        |
FONTENELLE                             344.8    120.4    167.6    196.2 |   BIG SANDY/EDEN VALLEY       2        92        64
                                                                        |
                                                                        |   GREEN above Fontenelle     14        74        60
                                                                        |
==================================================================================================================================
 * 90%, 70%, 30%, and 10% chances of exceeding are the probabilities that the actual volume will exceed the volumes in the table.

The average is computed for the 1961-1990 base period.

(1) - The values listed under the 10% and 90% Chance of Exceeding are actually 5% and 95% exceedance levels.
(2) - The value is natural volume - actual volume may be affected by upstream water management.
 To February 2001 Basin Outlook Report Contents Page