

Streamflow
Streamflow forecasts for the Black Hills are near average for this
time of year. This is for the forecast period March through July.
Deerfield Reservoir inflow is forecast to flow 5240 acre feet (107
percent of average). Pactola Reservoir inflow should flow about 22800
acre feet (109 percent of average).
==================================================================================================================================
                                              BELLE FOURCHE & CHEYENNE RIVER BASINS
                                               Streamflow Forecasts - February 1, 2001
==================================================================================================================================
                                              |  <<====== Drier ======  Future Conditions  =======  Wetter =====>>  |
                                              |                                                                     |
  Forecast Point                     Forecast |  ==================== Chance Of Exceeding * ======================  |
                                      Period  |    90%       70%    |  50% (Most Probable)  |      30%       10%    |  30-Yr Avg.
                                              | (1000AF)  (1000AF)  |   (1000AF)  (% AVG.)  |    (1000AF)  (1000AF) |    (1000AF)
====================================================================|=======================|=====================================
DEERFIELD RESERVOIR Inflow           MAR-JUL      2.26      4.04    |     5.24       107    |      6.44      8.22           4.90
                                                                    |                       |
PACTOLA RESERVOIR Inflow             MAR-JUL       9.0      15.6    |       23       109    |        30        41             21
                                                                    |                       |
==================================================================================================================================
                  BELLE FOURCHE & CHEYENNE RIVER BASINS                 |          BELLE FOURCHE & CHEYENNE RIVER BASINS
             Reservoir Storage (1000 AF) - End of January               |        Watershed Snowpack Analysis - February 1, 2001
==================================================================================================================================
                                      Usable |  *** Usable Storage ***  |                            Number     This Year as % of
Reservoir                            Capacity|  This      Last          |   Watershed                  of       =================
                                             |  Year      Year     Avg  |                          Data Sites   Last Yr   Average
========================================================================|=========================================================
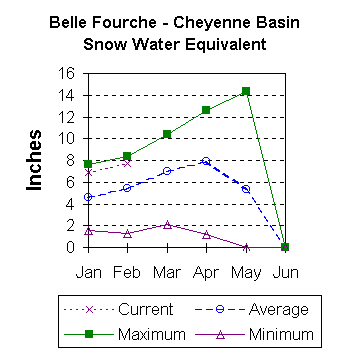
ANGOSTURA                              122.1     87.9    108.9     98.1 |   BELLE FOURCHE               6       215       143
                                                                        |
BELLE FOURCHE                          178.4    144.0    172.9    101.4 |
                                                                        |
DEERFIELD                               15.2     15.1     14.9     12.8 |
                                                                        |
KEYHOLE                                193.8    159.1    172.3     98.7 |
                                                                        |
PACTOLA                                 55.0     55.0     54.0     45.8 |
                                                                        |
SHADEHILL                               81.4     40.2     23.3     49.1 |
                                                                        |
==================================================================================================================================
 * 90%, 70%, 30%, and 10% chances of exceeding are the probabilities that the actual volume will exceed the volumes in the table.

The average is computed for the 1961-1990 base period.

(1) - The values listed under the 10% and 90% Chance of Exceeding are actually 5% and 95% exceedance levels.
(2) - The value is natural volume - actual volume may be affected by upstream water management.
 To February 2001 Basin Outlook Report Contents Page