

==================================================================================================================================
                                                       BIGHORN RIVER BASIN
                                               Streamflow Forecasts - May 1, 2000
==================================================================================================================================
                                              |  <<====== Drier ======  Future Conditions  =======  Wetter =====>>  |
                                              |                                                                     |
  Forecast Point                     Forecast |  ==================== Chance Of Exceeding * ======================  |
                                      Period  |    90%       70%    |  50% (Most Probable)  |      30%       10%    |  30-Yr Avg.
                                              | (1000AF)  (1000AF)  |   (1000AF)  (% AVG.)  |    (1000AF)  (1000AF) |    (1000AF)
====================================================================|=======================|=====================================
BOYSEN RESERVOIR Inflow (2)          MAY-SEP       271       425    |      530        70    |       635       789            758
                                                                    |                       |
GREYBULL RIVER nr Meeteetse          MAY-SEP        54        78    |       94        48    |       110       134            195
                                                                    |                       |
SHELL CREEK nr Shell                 MAY-SEP        54        60    |       64        89    |        68        75             72
                                                                    |                       |
BIGHORN RIVER at Kane (2)            MAY-SEP       353       577    |      730        70    |       883      1107           1039
                                                                    |                       |
==================================================================================================================================
                           BIGHORN RIVER BASIN                          |                   BIGHORN RIVER BASIN
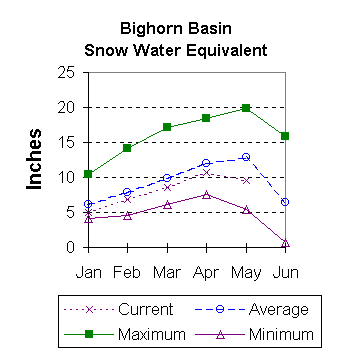
             Reservoir Storage (1000 AF) - End of April                 |        Watershed Snowpack Analysis - May 1, 2000
==================================================================================================================================
                                      Usable |  *** Usable Storage ***  |                            Number     This Year as % of
Reservoir                            Capacity|  This      Last          |   Watershed                  of       =================
                                             |  Year      Year     Avg  |                          Data Sites   Last Yr   Average
========================================================================|=========================================================
BOYSEN                                 596.0    501.4    474.8    502.6 |   NOWOOD RIVER                3        64        72
                                                                        |
BIGHORN LAKE                          1356.0    877.6    771.3    789.2 |   GREYBULL RIVER              2        33        51
                                                                        |
                                                                        |   SHELL CREEK                 4        88        90
                                                                        |
                                                                        |   BIGHORN (Boysen-Bighorn)    9        70        79
                                                                        |
==================================================================================================================================
 * 90%, 70%, 30%, and 10% chances of exceeding are the probabilities that the actual volume will exceed the volumes in the table.

The average is computed for the 1961-1990 base period.

(1) - The values listed under the 10% and 90% Chance of Exceeding are actually 5% and 95% exceedance levels.
(2) - The value is natural volume - actual volume may be affected by upstream water management.


	SHOSHONE & CLARKS FORK RIVER BASINS as of May 1, 2000
 To May 2000 Report Outlook Contents Page