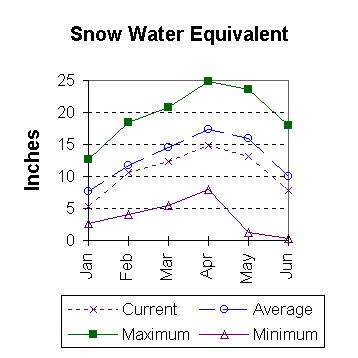
Streamflow
All the following forecasts are the 50 percent chance runoff for the June
through September runoff period. Yellowstone at Lake Outlet has is expected to
yield about 565,000 acre feet (82 percent of normal). Yellowstone at Corwin
Springs will yield about 1,300,00 acre feet (88 percent of normal). Yellowstone
near Livingston will yield about 1,515,000 acre feet (88 percent of normal).
Madison River near Grayling has a 50 percent chance of yielding about 230,000
acre feet (75 percent of normal). See the following page for detailed runoff
volumes.
==================================================================================================================================
                                             UPPER YELLOWSTONE & MADISON RIVER BASINS
                                               Streamflow Forecasts - June 1, 1998
==================================================================================================================================
                                              |  <<====== Drier ======  Future Conditions  =======  Wetter =====>>  |
                                              |                                                                     |
  Forecast Point                     Forecast |  ==================== Chance Of Exceeding * ======================  |
                                      Period  |    90%       70%    |  50% (Most Probable)  |      30%       10%    |  30-Yr Avg.
                                              | (1000AF)  (1000AF)  |   (1000AF)  (% AVG.)  |    (1000AF)  (1000AF) |    (1000AF)
====================================================================|=======================|=====================================
YELLOWSTONE at Lake Outlet           JUN-SEP       473       528    |      565        82    |       602       657            691
                                                                    |                       |
YELLOWSTONE RIVER at Corwin Springs  JUN-SEP      1139      1235    |     1300        88    |      1365      1461           1484
                                                                    |                       |
YELLOWSTONE RIVER near Livingston    JUN-SEP      1316      1434    |     1515        88    |      1596      1714           1721
                                                                    |                       |
MADISON RIVER near Grayling (2)      JUN-SEP       191       214    |      230        75    |       246       269            307
                                                                    |                       |
==================================================================================================================================
                UPPER YELLOWSTONE & MADISON RIVER BASINS                |        UPPER YELLOWSTONE & MADISON RIVER BASINS
             Reservoir Storage (1000 AF) - End of May                   |        Watershed Snowpack Analysis - June 1, 1998
==================================================================================================================================
                                      Usable |  *** Usable Storage ***  |                            Number     This Year as % of
Reservoir                            Capacity|  This      Last          |   Watershed                  of       =================
                                             |  Year      Year     Avg  |                          Data Sites   Last Yr   Average
========================================================================|=========================================================
ENNIS LAKE                              41.0     36.6     32.8     35.8 |   MADISON RIVER in WY         6        58       102
                                                                        |
HEBGEN LAKE                            377.5    351.6    330.5    309.8 |   YELLOWSTONE RIVER in WY     8        47        63
                                                                        |
==================================================================================================================================
 * 90%, 70%, 30%, and 10% chances of exceeding are the probabilities that the actual volume will exceed the volumes in the table.

The average is computed for the 1961-1990 base period.

(1) - The values listed under the 10% and 90% Chance of Exceeding are actually 5% and 95% exceedance levels.
(2) - The value is natural volume - actual volume may be affected by upstream water management.
 To June 1998 Basin Outlook Report Contents Page