Bighorn River Basin
May 1997

Snow
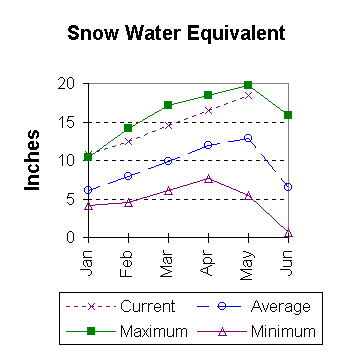
All drainage's in the basin are above average at this time. The Nowood drainage is 4 percent ahead of last year and 128 percent of average SWE for May 1. The Greybull River drainage is near last years SWE, with 138 percent of average SWE for the year. Shell Creek SWE is lower, at only 15 percent above average. The basin SWE, as a whole, is currently 123 percent of May 1 average. SWE for the entire basin is the same as May 1996 (last year). For more information see Basin Summary of Snow Courses at beginning of report.

Precipitation
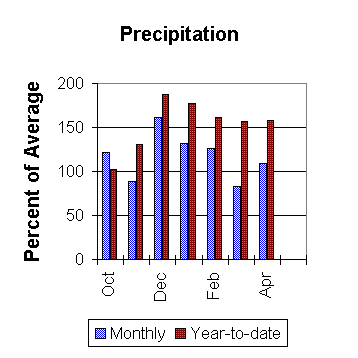
Precipitation, for the water year, has been good and is now 114 percent of average. Only 4 sites are below average. March precipitation was 109 percent of the monthly average. Beartrap Meadow was the highest reporting station at 138 percent of the March average. Kirwin is currently the highest reporting station for the year with 143 percent of average.

Reservoir
Reservoir storage is being lowered in anticipation of the potentially high runoff. Bighorn Lake is currently at 89 percent of average and Boysen at 76 percent. Boysen is currently storing 381,300 acre feet and Bighorn Lake is at 700,800. This is just slightly less than what was being stored last year at this time.

Streamflow
All forecast points are predicted to be average to well above average. The Wind River below Boysen is forecast to yield 1,120,000 acre feet (148 percent of average); the Nowood River near Ten Sleep should yield near 60,000 acre feet (125 percent of normal); the Greybull River near Meeteese should yield 265,000 acre feet (136 percent of average); Shell Creek near Shell should yield 85,000 acre feet (118 percent of average) and the Bighorn River at Kane should yield 1,585,000 acre feet (153 percent of average).

==================================================================================================================================
                                                       BIGHORN RIVER BASIN
                                               Streamflow Forecasts - May 1, 1997
==================================================================================================================================
                                              |  <<====== Drier ======  Future Conditions  =======  Wetter =====>>  |             
                                              |                                                                     |
  Forecast Point                     Forecast |  ==================== Chance Of Exceeding * ======================  |
                                      Period  |    90%       70%    |  50% (Most Probable)  |      30%       10%    |  30-Yr Avg.
                                              | (1000AF)  (1000AF)  |   (1000AF)  (% AVG.)  |    (1000AF)  (1000AF) |    (1000AF)
====================================================================|=======================|=====================================
WIND RIVER below Boysen (2)          MAY-SEP       861      1015    |     1120       148    |      1225      1379            758
                                                                    |                       |
NOWOOD RIVER near Tensleep           MAY-SEP        38        51    |       60       125    |        69        83             48
                                                                    |                       |
GREYBULL RIVER at Meeteetse          MAY-SEP       233       252    |      265       136    |       278       297            195
                                                                    |                       |
SHELL CREEK near Shell               MAY-SEP        75        81    |       85       118    |        89        95             72
                                                                    |                       |
BIGHORN RIVER at Kane (2)            MAY-SEP      1209      1433    |     1585       153    |      1737      1961           1039
                                                                    |                       |
==================================================================================================================================
                           BIGHORN RIVER BASIN                          |                   BIGHORN RIVER BASIN
             Reservoir Storage (1000 AF) - End of April                 |        Watershed Snowpack Analysis - May 1, 1997
==================================================================================================================================
                                      Usable |  *** Usable Storage ***  |                            Number     This Year as % of
Reservoir                            Capacity|  This      Last          |   Watershed                  of       =================
                                             |  Year      Year     Avg  |                          Data Sites   Last Yr   Average
========================================================================|=========================================================
BOYSEN                                 596.0    381.3    453.2    502.6 |   NOWOOD RIVER                5       104       128
                                                                        |
BIGHORN LAKE                          1356.0    700.8    767.1    789.2 |   GREYBULL RIVER              2        96       138
                                                                        |
                                                                        |   SHELL CREEK                 4        98       115
                                                                        |
                                                                        |   BIGHORN (Boysen-Bighorn)   11       100       123
                                                                        |
==================================================================================================================================
 * 90%, 70%, 30%, and 10% chances of exceeding are the probabilities that the actual volume will exceed the volumes in the table.

The average is computed for the 1961-1990 base period.

(1) - The values listed under the 10% and 90% Chance of Exceeding are actually 5% and 95% exceedance levels.                  
(2) - The value is natural volume - actual volume may be affected by upstream water management.


To May 1997 Basin Outlook Report Contents Page