Belle Fourche and Cheyenne River Basins
May 1997

Snow.
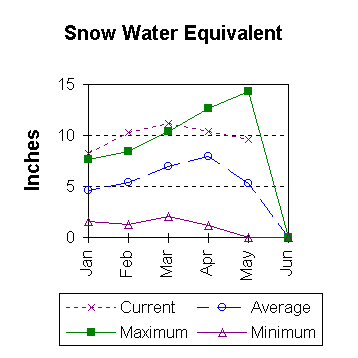
Snowpack in the Black Hills is well above average for May 1. Snow water equivalent (SWE) is 181 percent of average. This is 242 percent of what the figure was at this time last year. All reporting sites are measuring well above average, at this time. See the snow course basin summary at the beginning of this document for more details on specific sites.

Precipitation.
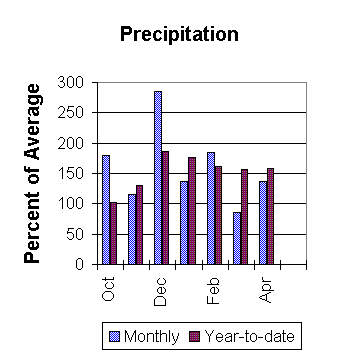
According to the 7 reporting sites, precipitation for April was 136 percent of average. Warren Peak reported in with 204 percent of average for the month. Year to date figures are also very high; the basin, as a whole, is 155 percent of average. The highest reporting site, as of April 1, is Warren Peak with 222 percent of average for the year. The lowest in the basin reporting this month is Devils Tower 2 at 128 percent of average.

Reservoir.
Reservoir storage is in good shape. Angostura is currently storing 106 percent of average (121,000 acre feet), Belle Fourche is 122 percent of average (178,400 acre feet), Deerfield is storing 108 percent of average (14,700 acre feet), Keyhole is storing 170 percent of average (186,600 acre feet), Pactola is storing 116 percent of average (55,600 acre feet), and Shadehill is storing 119 percent of average (77,600 acre feet).

Streamflow forecast.
Runoff could be above average for the Black Hills if the current trend continues. Castle Creek is forecast at 120 percent of average flow (3,600 acre feet) for the May - July season. Rapid Creek is at 116 percent of average (17,500 acre feet). Shortages of water should not be a problem this year in the basin.

==================================================================================================================================
                                              BELLE FOURCHE & CHEYENNE RIVER BASINS
                                               Streamflow Forecasts - May 1, 1997
==================================================================================================================================
                                              |  <<====== Drier ======  Future Conditions  =======  Wetter =====>>  |             
                                              |                                                                     |
  Forecast Point                     Forecast |  ==================== Chance Of Exceeding * ======================  |
                                      Period  |    90%       70%    |  50% (Most Probable)  |      30%       10%    |  30-Yr Avg.
                                              | (1000AF)  (1000AF)  |   (1000AF)  (% AVG.)  |    (1000AF)  (1000AF) |    (1000AF)
====================================================================|=======================|=====================================
CASTLE CREEK blw Deerfield Dam (2)   MAY-JUL      2.58      3.19    |     3.60       120    |      4.01      4.62           3.00
                                                                    |                       |
RAPID CREEK blw Pactola Dam (2)      MAY-JUL      11.1      14.9    |     17.5       116    |        20        24           15.1
                                                                    |                       |
==================================================================================================================================
                  BELLE FOURCHE & CHEYENNE RIVER BASINS                 |          BELLE FOURCHE & CHEYENNE RIVER BASINS
             Reservoir Storage (1000 AF) - End of April                 |        Watershed Snowpack Analysis - May 1, 1997
==================================================================================================================================
                                      Usable |  *** Usable Storage ***  |                            Number     This Year as % of
Reservoir                            Capacity|  This      Last          |   Watershed                  of       =================
                                             |  Year      Year     Avg  |                          Data Sites   Last Yr   Average
========================================================================|=========================================================
ANGOSTURA                              122.1    121.0    120.7    113.7 |   BELLE FOURCHE               4       242       181
                                                                        |
BELLE FOURCHE                          178.4    178.4    179.8    145.7 |
                                                                        |
DEERFIELD                               15.2     14.7     15.0     13.6 |
                                                                        |
KEYHOLE                                193.8    186.6    149.2    109.6 |
                                                                        |
PACTOLA                                 55.0     55.6     54.8     47.9 |
                                                                        |
SHADEHILL                               81.4     77.6     63.6     65.2 |
                                                                        |
==================================================================================================================================
 * 90%, 70%, 30%, and 10% chances of exceeding are the probabilities that the actual volume will exceed the volumes in the table.

The average is computed for the 1961-1990 base period.

(1) - The values listed under the 10% and 90% Chance of Exceeding are actually 5% and 95% exceedance levels.                  
(2) - The value is natural volume - actual volume may be affected by upstream water management.


To May 1997 Basin Outlook Report Contents Page