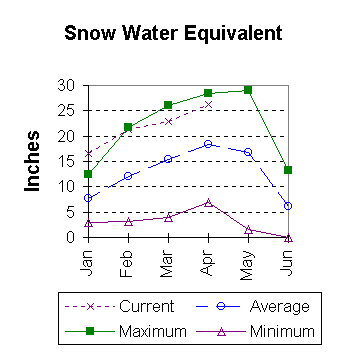
Streamflow
The fifty percent chance April through July runoff, in the basin,
is forecast above average to much above average. Green River
at Warren Bridge is expected to yield about 340,000 acre feet
(28 percent more than normal). Pine Creek above Fremont Lake
is expected to yield 130,000 acre feet ( 25 percent more than
normal). New Fork River near Big Piney is expected to yield
about 550,000 acre feet or 43 percent more than normal. The 50
percent chance inflow to Fontenelle Reservoir is about 1,250,000
acre feet, which is about 47 percent more than normal. Big
Sandy near Farson is expected to be about 80,000 acre feet (40
percent more than normal).
==================================================================================================================================
                                                     UPPER GREEN RIVER BASIN
                                               Streamflow Forecasts - April 1, 1997
==================================================================================================================================
                                              |  <<====== Drier ======  Future Conditions  =======  Wetter =====>>  |
                                              |                                                                     |
  Forecast Point                     Forecast |  ==================== Chance Of Exceeding * ======================  |
                                      Period  |    90%       70%    |  50% (Most Probable)  |      30%       10%    |  30-Yr Avg.
                                              | (1000AF)  (1000AF)  |   (1000AF)  (% AVG.)  |    (1000AF)  (1000AF) |    (1000AF)
====================================================================|=======================|=====================================
GREEN R at Warren Bridge             APR-JUL       295       321    |      340       128    |       359       386            266
                                                                    |                       |
PINE CK abv Fremont Lake             APR-JUL       114       126    |      130       125    |       134       146            104
                                                                    |                       |
NEW FORK R nr Big Piney              APR-JUL       435       527    |      550       143    |       574       666            385
                                                                    |                       |
FONTENELLE RESERVOIR INFLOW          APR-JUL      1087      1192    |     1250       147    |      1308      1409            849
                                                                    |                       |
BIG SANDY R nr Farson                APR-JUL        66        74    |       80       140    |        86        94             57
                                                                    |                       |
==================================================================================================================================
                         UPPER GREEN RIVER BASIN                        |                 UPPER GREEN RIVER BASIN
             Reservoir Storage (1000 AF) - End of March                 |        Watershed Snowpack Analysis - April 1, 1997
==================================================================================================================================
                                      Usable |  *** Usable Storage ***  |                            Number     This Year as % of
Reservoir                            Capacity|  This      Last          |   Watershed                  of       =================
                                             |  Year      Year     Avg  |                          Data Sites   Last Yr   Average
========================================================================|=========================================================
BIG SANDY                               38.3     26.7      ---     19.9 |   GREEN above Warren Bridge   4       117       150
                                                                        |
EDEN                                    11.8      6.1      6.1      4.7 |   UPPER GREEN (West Side)     7       110       139
                                                                        |
FLAMING GORGE                         3749.0   3184.9   3151.0      --- |   NEWFORK RIVER               3       122       138
                                                                        |
FONTENELLE                             344.8    120.8     97.4    157.9 |   BIG SANDY/EDEN VALLEY       2       134       145
                                                                        |
                                                                        |   GREEN above Fontenelle     14       113       141
                                                                        |
==================================================================================================================================
 * 90%, 70%, 30%, and 10% chances of exceeding are the probabilities that the actual flow will exceed the volumes in the table.

The average is computed for the 1961-1990 base period.

(1) - The values listed under the 10% and 90% Chance of Exceeding are actually 5% and 95% exceedance levels.
(2) - The value is natural flow - actual flow may be affected by upstream water management.
 To April 1997 Basin Outlook Report Contents Page