 HumidityHumidity
Wyoming's annual average relative humidity (RH) is quite low (Figure 9.1) and is particularly low in summer. During the warmer part of the summer days, the humidity drops to about 25 to 30% and on a few occasions it will be as low as five to 10%. Late at night, when the temperature is lowest, the humidity will generally rise to 65 or 75%. This results in an average diurnal variation of about 40 to 45% during the summer, but in the winter the variation is much less. Low RH, high percentage of sunshine, and rather high average winds all contribute to a high rate of evaporation. Similarly, with dew point temperatures generally in the upper 40s during the summer, Wyoming offers its residents and visitors a break from the sweating and discomfort. Lower dew point temperatures assure cool summer nights (Figure 9.2). For average annual dew points, see Figure 9.2a.
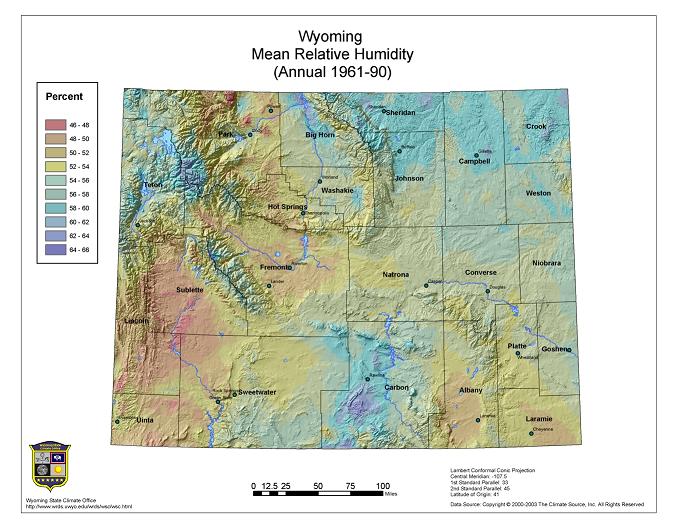
Figure 9.1. Annual average relative humidity (%) (PRISM, 1961-90)
Since RH is a function of temperature (assuming there is no additional change in the initial amount of water vapor in the air), outside air heated indoors will reduce RH to values well below 10% in winter, especially on the coldest nights. The use of a humidifier is the easiest way for adding moisture and thus increasing comfort to the otherwise drying effects on our skin and respiratory system. While static electricity is a common annoyance with these very low RH values, it can also be a potentially dangerous problem for those working in coalbed methane mines, where static discharge from clothing could set off an explosion. These conditions, while uncommon, do occur over lower elevations across the state in the summer.
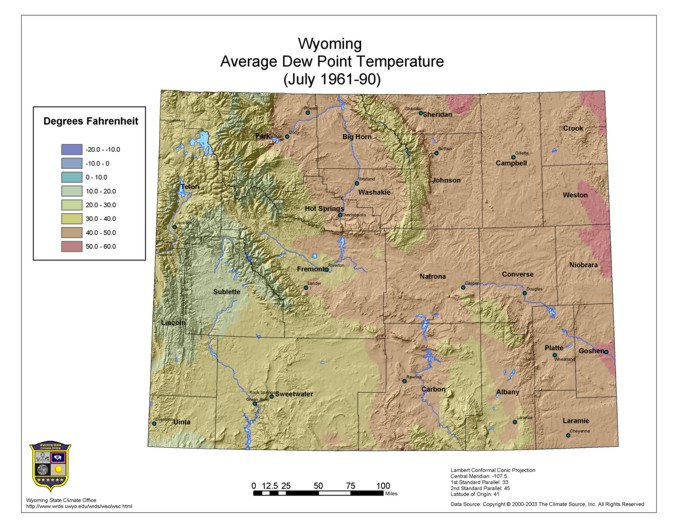
Figure 9.2. July average dew point temperature (oF) (PRISM, 1961-90)
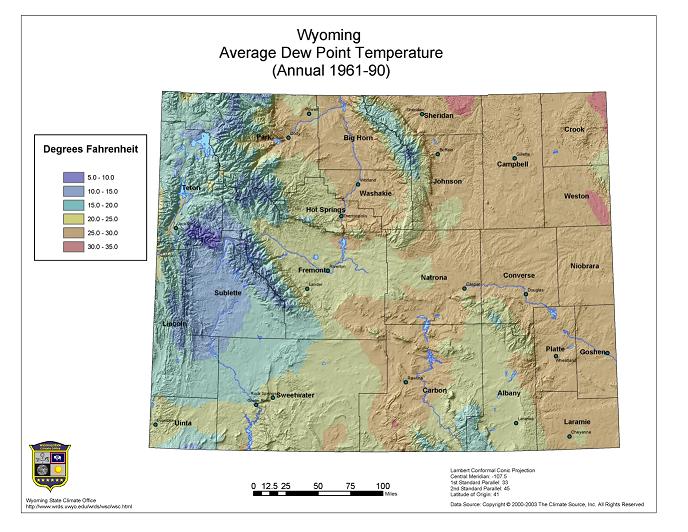
Figure 9.2a. Annual average dew point temperature (oF) (PRISM, 1961-90)
In Figure 9.3, Figure 9.4, Figure 9.5, and Figure 9.6, mean hourly RH by month for Casper, Cheyenne, Lander, and Sheridan from 1961-90 reveals that Cheyenne and Sheridan have similar periods of minimum and maximum. Minimum occurs in the afternoon during mid-summer and the maximum occurs in the early morning hours of mid-spring. Casper and Lander also show typical RH minimums in the summer but differ on their period of maximum RH.
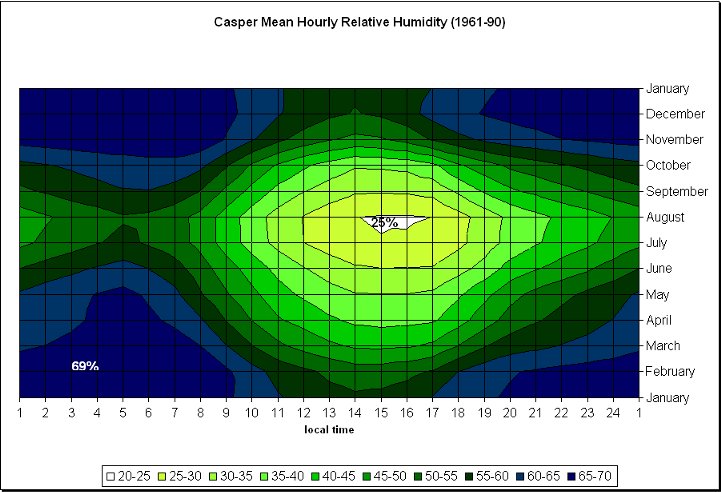
Figure 9.3. Casper mean hourly RH (%) based on observations from 1961-1990. Annual minimum and maximum values are depicted.
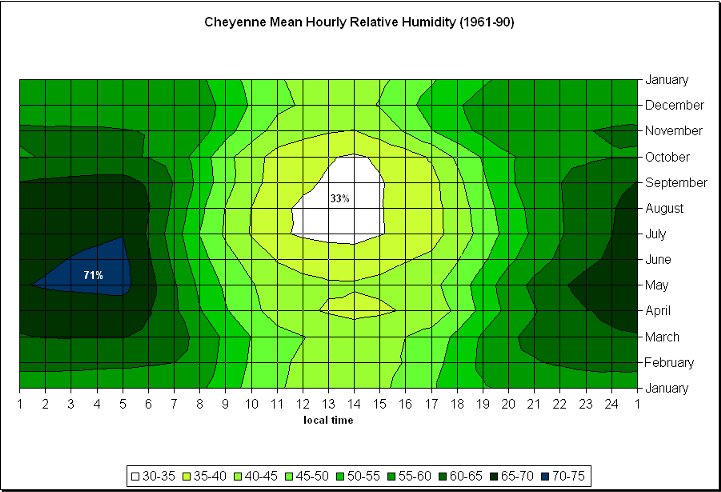
Figure 9.4. Same as Figure 9.3 except for Cheyenne
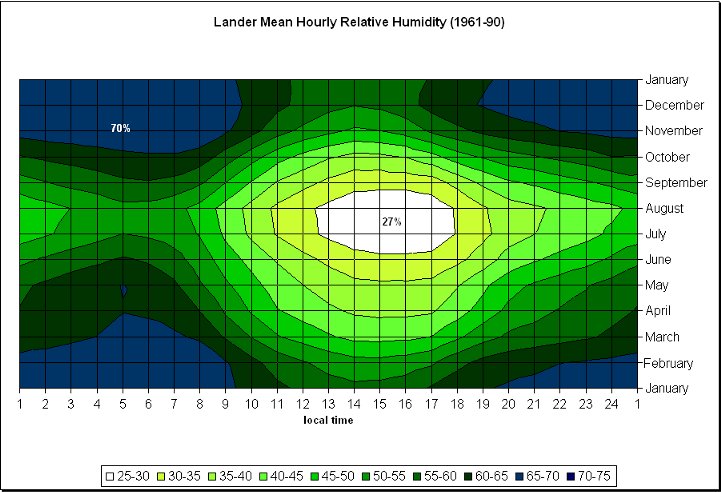
Figure 9.5. Same as Figure 9.3 except for Lander
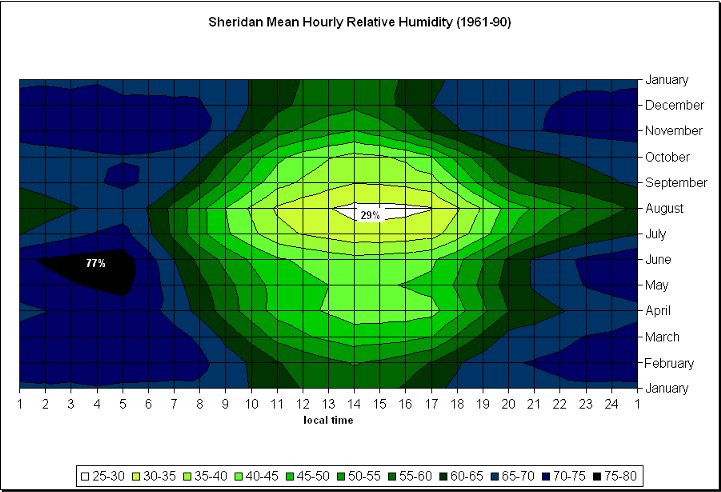
Figure 9.6. Same as Figure 9.3 except for Sheridan
In Figure 9.7, Figure 9.8, Figure 9.9, and Figure 9.10, RH frequencies by month for Casper, Cheyenne, Lander, and Sheridan are shown based on daily average observations from 1950-1996. Generally, the highest frequencies of occurrence are winter (70% RH) and summer (40% RH) with the exception of Cheyenne where the highest frequency occurs generally between an RH of 45 to 65% throughout the year.
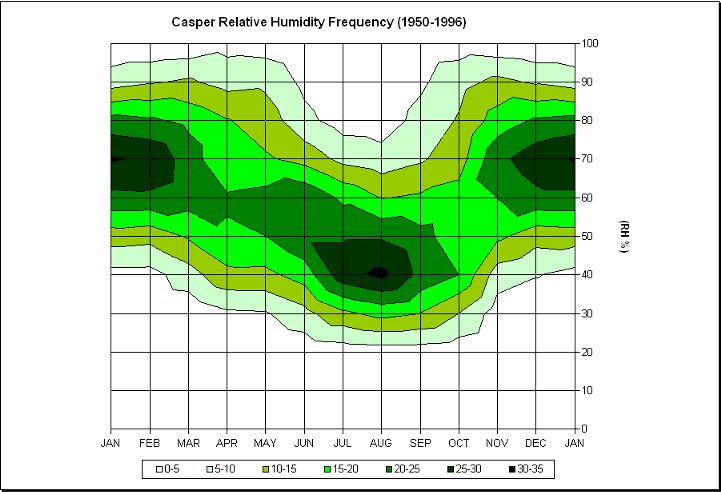
Figure 9.7. Casper RH frequency (%) by month based on hourly observations taken from 1950 to 1996
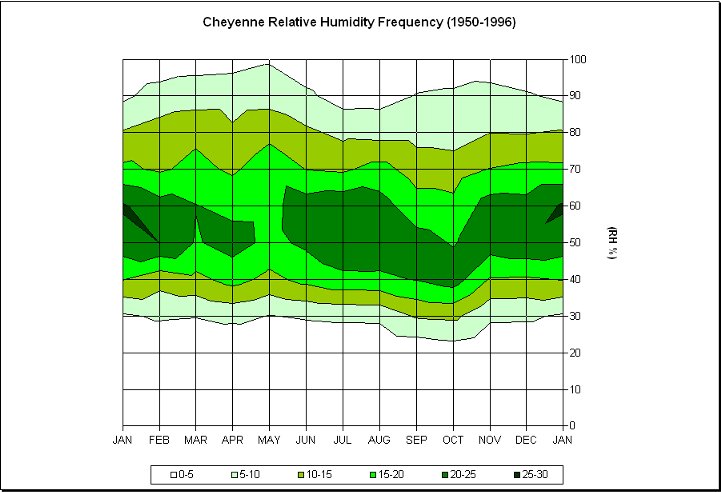
Figure 9.8. Same as Figure 9.7 except for Cheyenne
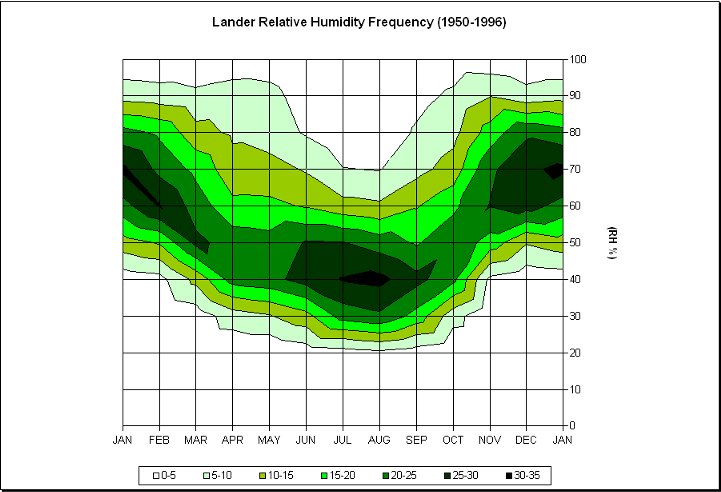
Figure 9.9. Same as Figure 9.7 except for Lander
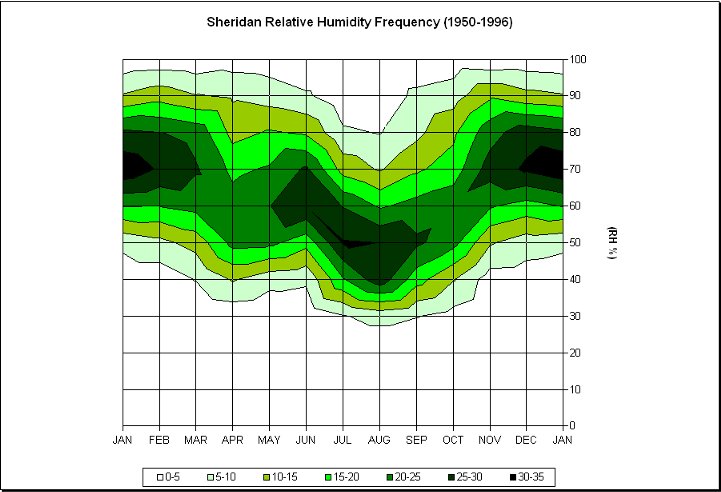
Figure 9.10. Same as Figure 9.7 except for Sheridan
In Figure 9.11, Figure 9.12, Figure 9.13, and Figure 9.14, mean dew point temperatures by month for Casper, Cheyenne, Lander, and Sheridan from hourly observations from 1961-1990 are characterized by generally constant values across the day for a given month and are highest during summer mornings (mid to upper 40s).
They are lowest during winter mornings (single digit � F). The importance of dew point temperatures, besides indicating at what temperature dew or frost will form (equating to 100% RH), is that other moisture calculations can be performed.81 Weather instruments cannot ecomonically measure all atmospheric elements. However, with a number that is directly measured, such as dew point, others can be derived accurately.
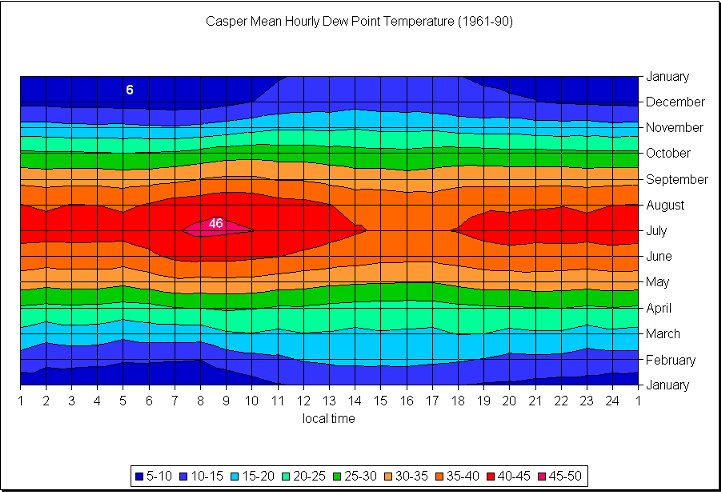
Figure 9.11. Casper average hourly dew point temperature (degree F) by month (1961-1990). Annual minimum and maximum values are denoted.
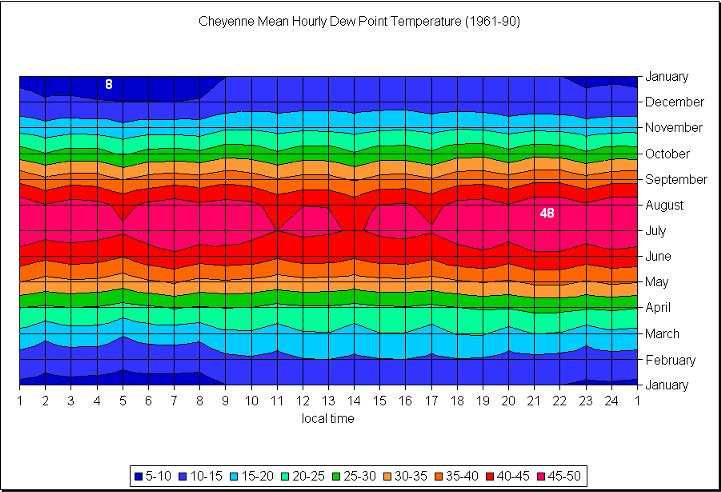
Figure 9.12. Same as Figure 9.11 except for Cheyenne
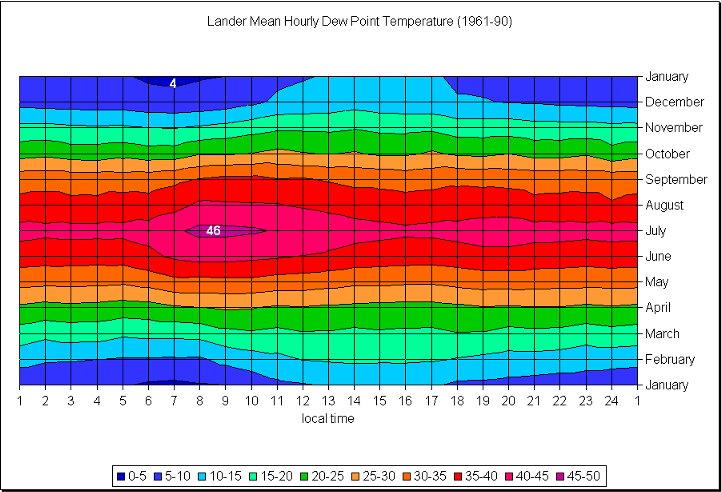
Figure 9.13. Same as Figure 9.11 except for Lander
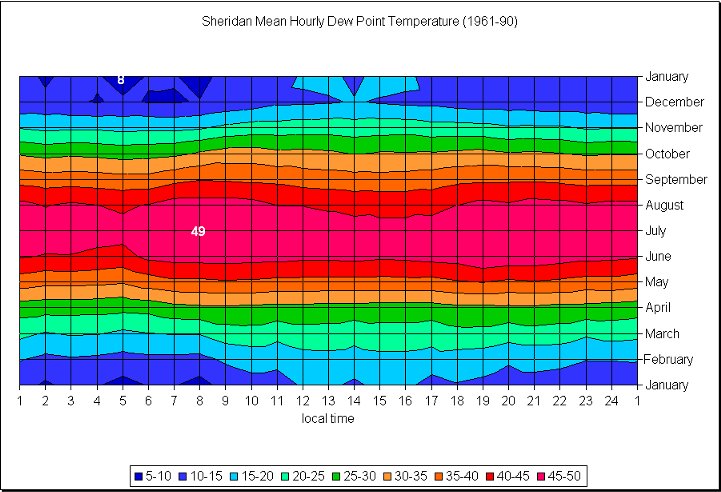
Figure 9.14. Same as Figure 9.11 except for Sheridan
In Figure 9.15, Figure 9.16, Figure 9.17, and Figure 9.18, dew point temperature frequencies by month for Casper, Cheyenne, Lander, and Sheridan are shown based on hourly observations from 1961-1990. Generally, the highest frequencies of occurrence are in spring, fall (20-30� F range), and summer (40-50� F range).
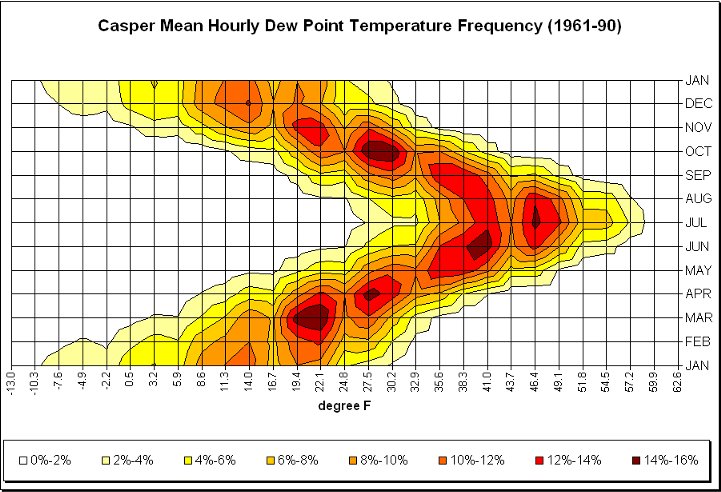
Figure 9.15.. Casper dew point temperature frequencies by month based on hourly observations taken from 1961-1990
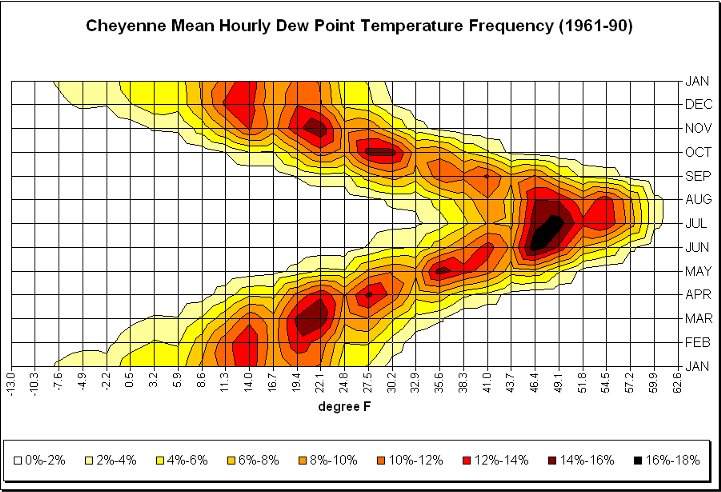
Figure 9.16. Same as Figure 9.15 except for Cheyenne
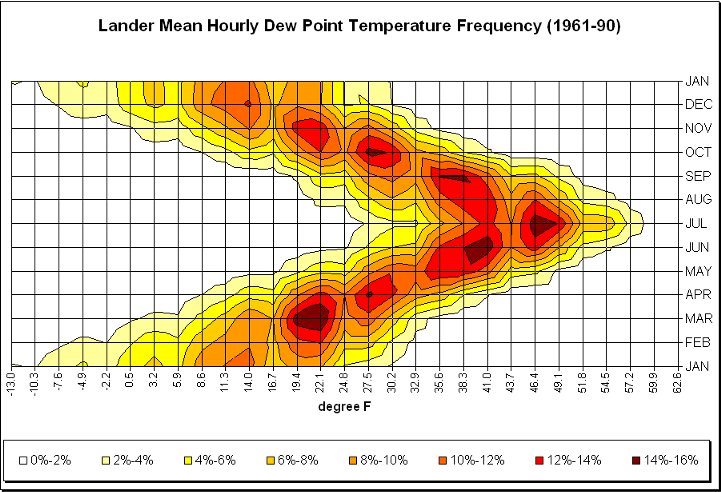
Figure 9.17. Same as Figure 9.15 except for Lander
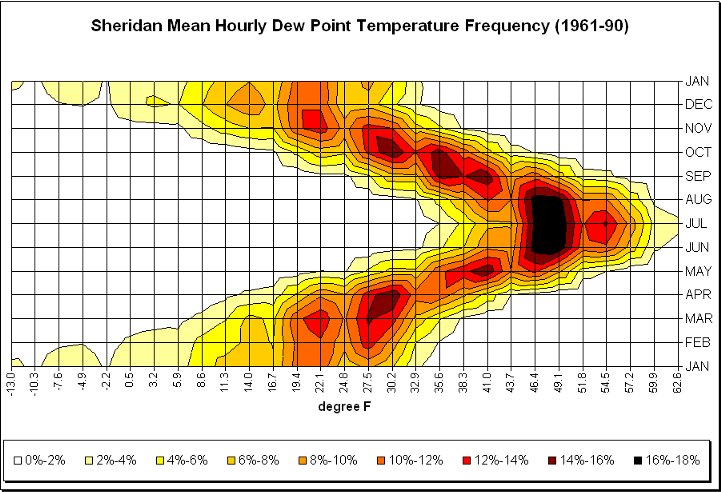
Figure 9.18. Same as Figure 9.15 except for Sheridan
Data in Table 9.A. and Table 9.B. are based on monthly averages of morning (5AM) and evening (5PM) local time observations. Average morning relative humidity values are based on early morning readings when the highest values generally occur.
Average afternoon relative humidity values are based on late afternoon readings when the lowest values generally occur. Wet bulb temperature (Table 9.C.) is defined as the lowest temperature that can be obtained by evaporating water into the air. Dew point (Table 9.D.) is the temperature in which air must be cooled (at constant pressure and constant water vapor content) for saturation to occur. When the dew point falls below freezing it is called the frost point.
|
Table 9.A. Mean monthly and annual percent RH (%) (morning) |
|
|
JAN |
FEB |
MAR |
APR |
MAY |
JUN |
JUL |
AUG |
SEP |
OCT |
NOV |
DEC |
ANN |
|
Casper |
68 |
70 |
73 |
75 |
77 |
75 |
69 |
66 |
68 |
67 |
69 |
68 |
70 |
|
Cheyenne |
57 |
61 |
65 |
68 |
71 |
71 |
70 |
69 |
67 |
61 |
60 |
58 |
65 |
|
Lander |
68 |
68 |
66 |
65 |
65 |
61 |
54 |
54 |
59 |
63 |
69 |
68 |
63 |
|
Sheridan |
69 |
72 |
73 |
73 |
76 |
77 |
72 |
68 |
71 |
70 |
73 |
70 |
72 |
|
Table 9.B. Mean monthly and annual percent RH (%) (afternoon) |
|
|
JAN |
FEB |
MAR |
APR |
MAY |
JUN |
JUL |
AUG |
SEP |
OCT |
NOV |
DEC |
ANN |
|
Casper |
60 |
57 |
48 |
41 |
39 |
32 |
26 |
24 |
30 |
40 |
56 |
62 |
43 |
|
Cheyenne |
49 |
48 |
47 |
42 |
44 |
41 |
38 |
38 |
38 |
41 |
50 |
52 |
44 |
|
Lander |
60 |
54 |
45 |
39 |
36 |
31 |
27 |
26 |
32 |
40 |
56 |
62 |
42 |
|
Sheridan |
64 |
60 |
50 |
43 |
46 |
44 |
33 |
30 |
38 |
45 |
61 |
65 |
48 |
|
Table 9.C. Mean monthly and annual wet bulb temperatures (�F) |
|
|
JAN |
FEB |
MAR |
APR |
MAY |
JUN |
JUL |
AUG |
SEP |
OCT |
NOV |
DEC |
ANN |
|
Casper |
21 |
23 |
30 |
36 |
45 |
52 |
56 |
54 |
47 |
35 |
28 |
22 |
37 |
|
Cheyenne |
23 |
24 |
29 |
35 |
45 |
52 |
52 |
52 |
44 |
35 |
26 |
21 |
36 |
|
Lander |
17 |
21 |
29 |
36 |
44 |
51 |
55 |
53 |
46 |
37 |
26 |
16 |
36 |
|
Sheridan |
21 |
23 |
31 |
38 |
47 |
55 |
55 |
63 |
46 |
36 |
26 |
19 |
37 |
|
Table 9.D. Mean Monthly and Annual Dew Point Temperatures (�F) |
|
|
JAN |
FEB |
MAR |
APR |
MAY |
JUN |
JUL |
AUG |
SEP |
OCT |
NOV |
DEC |
ANN |
|
Casper |
14 |
16 |
22 |
26 |
35 |
42 |
45 |
42 |
36 |
25 |
20 |
14 |
28 |
|
Cheyenne |
12 |
15 |
20 |
26 |
36 |
44 |
44 |
44 |
36 |
26 |
18 |
12 |
28 |
|
Lander |
10 |
13 |
19 |
25 |
33 |
39 |
42 |
40 |
34 |
26 |
17 |
9 |
26 |
|
Sheridan |
14 |
15 |
22 |
28 |
37 |
44 |
46 |
43 |
37 |
29 |
20 |
13 |
29 |
Although ASOS provides more frequent observations than once per hour, these data are often difficult to obtain. However, WYDOT's observations are generally available several times per hour and are more readily available.82 In Figure 9.19, the annual frequency of RH for Gillette is provided to illustrate the signatures of drought and moist years. As noted, bars for the drought years of 2000-2001 show a higher frequency of lower humidity values than the bars for the wetter years of 1996-1997 that show a higher frequency of higher humidity values.
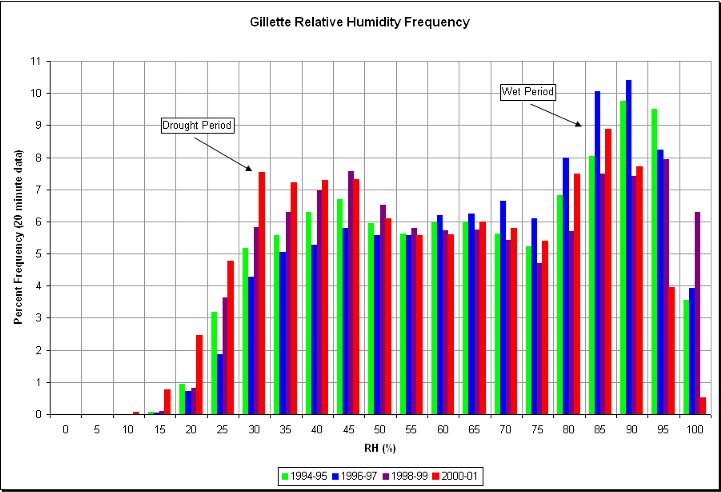
Figure 9.19. Relative Humidity from WYDOT's Gillette reporting station based on two-yearly, 20-minute observations from 1994 to 2001
82#. see CD, appendix_data, text, WYDOT folder
| ← Previous Chapter | | Table of Contents | | Next Chapter → |
State Climate Office | Water Resources Data System
Last Modified: Fri, 23 May 2025