Upper Bear River Basin (13)
January 2002

Snow
Snow water equivalent (SWE), at snow courses in the Bear River above the Idaho State line, is 93 percent of average (112 percent of last year). SWE for the Bear River in Utah is estimated to be 94 percent of average; that is about 103 percent of last year at this time. SWE in the Wyoming portion of the Bear River drainage (Smiths and Thomas Forks) is estimated at 94 percent of average (117 percent of last year at this time.). See the Basin Summary of Snow Course Data at the beginning of this report for more detailed information.

Precipitation
Precipitation for the month of December was 101 percent of average for the 2 reporting stations; this is 137 percent of the previous December. The year-to-date precipitation, for the basin, is 89 percent of average; this is 110 percent of last year's amount.

Reservoir
Woodruff Narrows reservoir had no report this month.

Streamflow
The following 50 percent chance stream flow yields are for the April through September period. Smiths Fork near Border is estimated to yield 100,000 acre-feet (85 percent of normal), and Thomas Fork drainage near the Idaho- Wyoming state line is below average. Bear River above the Utah-Wyoming State Line is expected to yield about 107,000 acre feet ( 86 percent of average), The Bear River near Woodruff is expected to yield about 130,000 acre-feet (about 84 percent of normal).

==================================================================================================================================
                                                      UPPER BEAR RIVER BASIN
                                               Streamflow Forecasts - January 1, 2002
==================================================================================================================================
                                              |  <<====== Drier ======  Future Conditions  =======  Wetter =====>>  |             
                                              |                                                                     |
  Forecast Point                     Forecast |  ==================== Chance Of Exceeding * ======================  |
                                      Period  |    90%       70%    |  50% (Most Probable)  |      30%       10%    |  30-Yr Avg.
                                              | (1000AF)  (1000AF)  |   (1000AF)  (% AVG.)  |    (1000AF)  (1000AF) |    (1000AF)
====================================================================|=======================|=====================================
SMITHS FK nr Border, WY              APR-SEP        60        81    |      100        85    |       123       167            118
                                                                    |                       |
THOMAS FK nr WY-ID State Line (Disc. APR-SEP      13.9        22    |       29        81    |        39        61             36
                                                                    |                       |
Bear R nr UT-WY State Line           APR-SEP        74        92    |      107        86    |       124       154            125
                                                                    |                       |
BEAR R nr Woodruff, UT               APR-SEP        64        98    |      130        84    |       173       264            154
                                                                    |                       |
==================================================================================================================================
                         UPPER BEAR RIVER BASIN                         |                 UPPER BEAR RIVER BASIN
             Reservoir Storage (1000 AF) - End of December              |        Watershed Snowpack Analysis - January 1, 2002
==================================================================================================================================
                                      Usable |  *** Usable Storage ***  |                            Number     This Year as % of
Reservoir                            Capacity|  This      Last          |   Watershed                  of       =================
                                             |  Year      Year     Avg  |                          Data Sites   Last Yr   Average
========================================================================|=========================================================
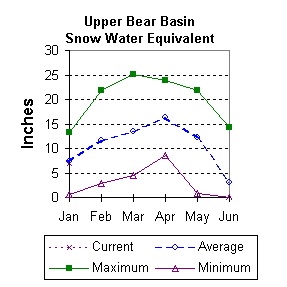
WOODRUFF NARROWS                                NO REPORT               |   UPPER BEAR RIVER in Utah    5       103        94
                                                                        |
                                                                        |   SMITHS & THOMAS FORKS       3       117        94
                                                                        |
                                                                        |   BEAR RIVER abv ID line      6       112        93
                                                                        |
                                                                        |   NORTHWEST                  57       122        80
                                                                        |
                                                                        |   NORTHEST                   11        85        73
                                                                        |
                                                                        |   SOUTHEAST                  20        71        66
                                                                        |
                                                                        |   SOUTHWEST                  25       101        85
                                                                        |
==================================================================================================================================
 * 90%, 70%, 30%, and 10% chances of exceeding are the probabilities that the actual volume will exceed the volumes in the table.

(1) - The values listed under the 10% and 90% Chance of Exceeding are actually 5% and 95% exceedance levels.                  
(2) - The value is natural volume - actual volume may be affected by upstream water management.

To January 2002 Basin Outlook Report Contents Page