==================================================================================================================================
BELLE FOURCHE & CHEYENNE RIVER BASINS
Streamflow Forecasts - March 1, 2001
==================================================================================================================================
| <<====== Drier ====== Future Conditions ======= Wetter =====>> |
| |
Forecast Point Forecast | ==================== Chance Of Exceeding * ====================== |
Period | 90% 70% | 50% (Most Probable) | 30% 10% | 30-Yr Avg.
| (1000AF) (1000AF) | (1000AF) (% AVG.) | (1000AF) (1000AF) | (1000AF)
====================================================================|=======================|=====================================
BELLE FOURCHE & CHEYEN|E RIVER BASINS
| |
==================================================================================================================================
BELLE FOURCHE & CHEYENNE RIVER BASINS | BELLE FOURCHE & CHEYENNE RIVER BASINS
Reservoir Storage (1000 AF) - End of February | Watershed Snowpack Analysis - March 1, 2001
==================================================================================================================================
Usable | *** Usable Storage *** | Number This Year as % of
Reservoir Capacity| This Last | Watershed of =================
| Year Year Avg | Data Sites Last Yr Average
========================================================================|=========================================================
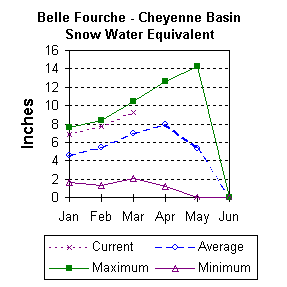
ANGOSTURA 122.1 90.9 113.6 101.7 | BELLE FOURCHE 6 223 132
|
BELLE FOURCHE 178.4 154.7 173.6 113.0 |
|
DEERFIELD 15.2 15.1 14.7 13.2 |
|
KEYHOLE 193.8 159.8 173.5 101.9 |
|
PACTOLA 55.0 54.1 54.1 46.0 |
|
SHADEHILL 81.4 39.6 53.5 50.0 |
|
==================================================================================================================================
* 90%, 70%, 30%, and 10% chances of exceeding are the probabilities that the actual volume will exceed the volumes in the table.
The average is computed for the 1961-1990 base period.
(1) - The values listed under the 10% and 90% Chance of Exceeding are actually 5% and 95% exceedance levels.
(2) - The value is natural volume - actual volume may be affected by upstream water management.
 To March 2001 Basin Outlook Report Contents Page