Upper Green River Basin
January 2000

Snow
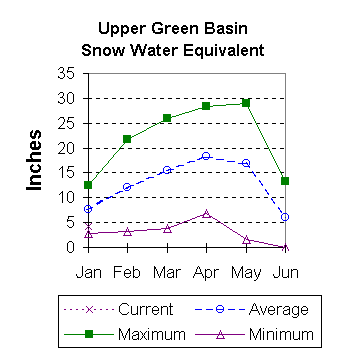
The Upper Green River Basin snow water equivalent (SWE), above Fontenelle Reservoir, is 58 percent of average (61 percent of last year). The Green River basin SWE above Warren Bridge is 55 percent of normal (56 percent of last year). SWE on the west side of the Upper Green River basin is about 60 percent of normal, 64 percent of this time last year. Newfork River SWE is now 60 percent of normal (59 percent of last year). Big Sandy-Eden Valley SWE is about 42 percent of average (36 percent of last year). For more information see the Basin Summary of Snow Courses at the beginning of this report.

Precipitation
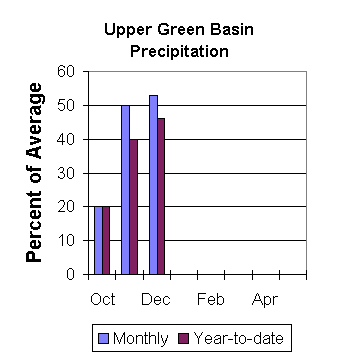
The 13 reporting precipitation sites in the basin were 53 percent of the December average (63 percent of last year at this time). December precipitation varied from 26 to 100 percent of average. Water year- to-date precipitation is about 46 percent of average (50 percent of last year). Year to date percentage of average ranges from 24 to 54 for the 13 reporting stations.

Reservoir
Data for Big Sandy Reservoir, Eden Reservoir, And Flaming Gorge Reservoir were not reported this month. Fontenelle Reservoir is storing 210,400 acre-feet (101 percent of average and 61 percent of the total capacity). Detailed reservoir data is shown on the following page and on the reservoir storage summary at the beginning of this report.

Streamflow
The fifty-percent chance April through July runoff in the Upper Green River basin is forecast below average. Green River at Warren Bridge is expected to yield about 190,000 acre-feet (71 percent of normal). Pine Creek above Fremont Lake is expected to yield 78,000 acre-feet (75 percent of normal). New Fork River near Big Piney is expected to yield about 235,000 acre-feet (61 percent of normal). Fontenelle Reservoir Inflow is estimated to be 525,000 acre-feet (62 percent of average), and Big Sandy near Farson is expected to be about 32,000 acre-feet (56 percent of normal).

==================================================================================================================================
                                                     UPPER GREEN RIVER BASIN
                                               Streamflow Forecasts - January 1, 2000
==================================================================================================================================
                                              |  <<====== Drier ======  Future Conditions  =======  Wetter =====>>  |             
                                              |                                                                     |
  Forecast Point                     Forecast |  ==================== Chance Of Exceeding * ======================  |
                                      Period  |    90%       70%    |  50% (Most Probable)  |      30%       10%    |  30-Yr Avg.
                                              | (1000AF)  (1000AF)  |   (1000AF)  (% AVG.)  |    (1000AF)  (1000AF) |    (1000AF)
====================================================================|=======================|=====================================
Green River at Warren Bridge         APR-JUL       125       156    |      190        71    |       224       279            266
                                                                    |                       |
Pine Creek abv Fremont Lake          APR-JUL        47        68    |       78        75    |        88       109            104
                                                                    |                       |
New Fork River nr Big Piney          APR-JUL       112       176    |      235        61    |       294       431            385
                                                                    |                       |
Fontenelle Reservoir Inflow          APR-JUL       204       442    |      525        62    |       615       976            849
                                                                    |                       |
Big Sandy River nr Farson            APR-JUL        20        23    |       32        56    |        41        58             57
                                                                    |                       |
==================================================================================================================================
                         UPPER GREEN RIVER BASIN                        |                 UPPER GREEN RIVER BASIN
             Reservoir Storage (1000 AF) - End of December              |        Watershed Snowpack Analysis - January 1, 2000
==================================================================================================================================
                                      Usable |  *** Usable Storage ***  |                            Number     This Year as % of
Reservoir                            Capacity|  This      Last          |   Watershed                  of       =================
                                             |  Year      Year     Avg  |                          Data Sites   Last Yr   Average
========================================================================|=========================================================
BIG SANDY                                       NO REPORT               |   GREEN above Warren Bridge   4        58        55
                                                                        |
EDEN                                            NO REPORT               |   UPPER GREEN (West Side)     5        64        60
                                                                        |
FLAMING GORGE                         3749.0   3269.0   3401.0      --- |   NEWFORK RIVER               2        59        60
                                                                        |
FONTENELLE                             344.8    210.4    226.9    208.3 |   BIG SANDY/EDEN VALLEY       1        36        42
                                                                        |
                                                                        |   GREEN above Fontenelle     11        62        58
                                                                        |
==================================================================================================================================
 * 90%, 70%, 30%, and 10% chances of exceeding are the probabilities that the actual volume will exceed the volumes in the 
table.

The average is computed for the 1961-1990 base period.

(1) - The values listed under the 10% and 90% Chance of Exceeding are actually 5% and 95% exceedance levels.                  
(2) - The value is natural volume - actual volume may be affected by upstream water management.
(3) - Forecasts produced in cooperation with Alberta Forecasting Staff Canada


To January 2000 Basin Outlook Report Contents Page