Little Snake River Basin (10)
February 2000

Snow
Snowfall has been well below average across the basin this year. Currently, snow water equivalent (SWE) in the Little Snake River drainage is 79 percent of average (86 percent of last year at this time). For more information see Basin Summary of Snow Courses at beginning of this report.

Precipitation
Precipitation across the basin was near average this past month. January precipitation was 101 percent of average (90 percent of last year) for the 5 reporting stations. The Little Snake River basin water-year-to-date precipitation is currently 74 percent of average (65 percent of last year). Year-to-date percentages range from 58 to 85 percent of average.

Streamflow
Runoff yield in the Little Snake River drainage is expected to be below normal this year. Stream yield is based on the 50 percent probability for the April through July forecast period. The Little Snake River near Slater should yield about 115,000 acre-feet (74 percent of normal). Little Snake River near Dixon is estimated to yield 240,000 acre-feet (73 percent of normal).

==================================================================================================================================
                                                     LITTLE SNAKE RIVER BASIN
                                               Streamflow Forecasts - February 1, 2000
==================================================================================================================================
                                              |  <<====== Drier ======  Future Conditions  =======  Wetter =====>>  |             
                                              |                                                                     |
  Forecast Point                     Forecast |  ==================== Chance Of Exceeding * ======================  |
                                      Period  |    90%       70%    |  50% (Most Probable)  |      30%       10%    |  30-Yr Avg.
                                              | (1000AF)  (1000AF)  |   (1000AF)  (% AVG.)  |    (1000AF)  (1000AF) |    (1000AF)
====================================================================|=======================|=====================================
Little Snake River nr Slater         APR-JUL        76        98    |      115        74    |       133       162            155
                                                                    |                       |
LITTLE SNAKE R nr Dixon              APR-JUL       119       191    |      240        73    |       289       361            329
                                                                    |                       |
==================================================================================================================================
                        LITTLE SNAKE RIVER BASIN                        |                LITTLE SNAKE RIVER BASIN
             Reservoir Storage (1000 AF) - End of January               |        Watershed Snowpack Analysis - February 1, 2000
==================================================================================================================================
                                      Usable |  *** Usable Storage ***  |                            Number     This Year as % of
Reservoir                            Capacity|  This      Last          |   Watershed                  of       =================
                                             |  Year      Year     Avg  |                          Data Sites   Last Yr   Average
========================================================================|=========================================================
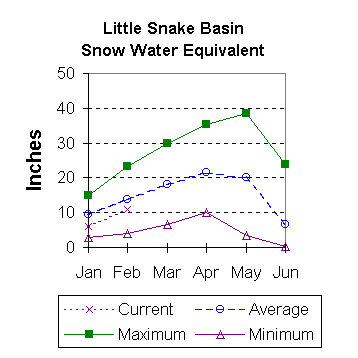
                                                                        |   LITTLE SNAKE RIVER          8        86        79
                                                                        |
==================================================================================================================================
 * 90%, 70%, 30%, and 10% chances of exceeding are the probabilities that the actual volume will exceed the volumes in the table.

The average is computed for the 1961-1990 base period.

(1) - The values listed under the 10% and 90% Chance of Exceeding are actually 5% and 95% exceedance levels.                  
(2) - The value is natural volume - actual volume may be affected by upstream water management.


To February 2000 Basin Outlook Report Contents Page