Lower Green River Basin (12)
January 1999

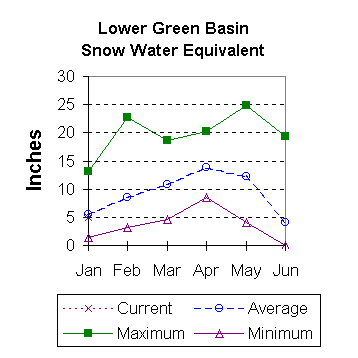
Snow
The Blacks Fork drainage snow water equivalent (SWE) is 73 percent of average (78% of last year). SWE in the Hams Fork, as of January 1, is 88 percent of average (151% of last year). Henry's Fork is 106 percent of average (55 percent of last year). The basin as a whole is 94 percent of average (143 % of last year). For more information see Basin Summary of Snow Courses at beginning of this report.

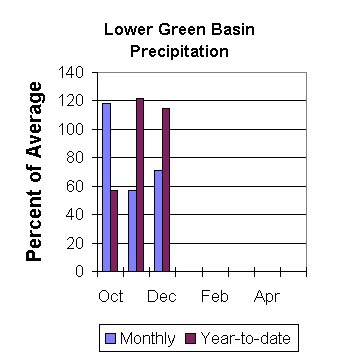
Precipitation
Precipitation was below average for the 4 reporting stations during December. Precipitation ranged from 25 to 97 percent of average for the month. The entire basin received 71 percent of average for the month (158 percent of last year). The basin year-to-date precipitation is currently 75 percent of average (149 percent of last year). Year to date percentages range from 70 to 89.

Reservoir
Fontenelle Reservoir is currently storing 226,900 acre feet; this is 109 percent of average (102 % of last year). Flaming Gorge did not report, (no average established). Flaming Gorge has a maximum capacity of 3,749,000 acre feet. Viva Naughton did not report.

Streamflow
Expected yields vary from 73 to 89 percent of average across the basin. The following forecast values are based on a 50 percent chance probability for the April through July forecast period. Green River near Green River is forecast to yield 800,000-acre feet (89 percent of average). The estimated yield for Hams Fork near Frontier is 50,000- acre feet (76 percent of average). Viva Naughton Reservoir inflow will be about 65,000-acre feet (73 percent of average).

==================================================================================================================================
                                                     LOWER GREEN RIVER BASIN
                                               Streamflow Forecasts - June 1, 1998
==================================================================================================================================
                                              |  <<====== Drier ======  Future Conditions  =======  Wetter =====>>  |             
                                              |                                                                     |
  Forecast Point                     Forecast |  ==================== Chance Of Exceeding * ======================  |
                                      Period  |    90%       70%    |  50% (Most Probable)  |      30%       10%    |  30-Yr Avg.
                                              | (1000AF)  (1000AF)  |   (1000AF)  (% AVG.)  |    (1000AF)  (1000AF) |    (1000AF)
====================================================================|=======================|=====================================
GREEN R nr Green River, WY           APR-JUL       647       717    |      765        85    |       813       883            899
                                                                    |                       |
MEEKS CABIN RESERVOIR Inflow         APR-JUL        90        98    |      103       107    |       108       116             96
                                                                    |                       |
STATE LINE RESERVOIR INFLOW          APR-JUL        28        31    |       33       110    |        35        38             30
                                                                    |                       |
HAMS FORK nr Frontier                APR-JUL        38        46    |       51        77    |        56        64             66
                                                                    |                       |
VIVA NAUGHTON RES inflow             APR-JUL        47        58    |       66        71    |        74        85             93
                                                                    |                       |
FLAMING GORGE RES INFLOW             APR-JUL                        |     1100        92    |                               1196
                                                                    |                       |
==================================================================================================================================
                         LOWER GREEN RIVER BASIN                        |                 LOWER GREEN RIVER BASIN
             Reservoir Storage (1000 AF) - End of May                   |        Watershed Snowpack Analysis - June 1, 1998
==================================================================================================================================
                                      Usable |  *** Usable Storage ***  |                            Number     This Year as % of
Reservoir                            Capacity|  This      Last          |   Watershed                  of       =================
                                             |  Year      Year     Avg  |                          Data Sites   Last Yr   Average
========================================================================|=========================================================
FONTENELLE                             344.8    180.8    212.9    195.5 |   HAMS FORK RIVER             3        70        87
                                                                        |
FLAMING GORGE                                   NO REPORT               |   BLACKS FORK                 2       159       122
                                                                        |
VIVA NAUGHTON RES                               NO REPORT               |   HENRYS FORK                 2         0         0
                                                                        |
                                                                        |   GREEN above Flaming Gorge  17        65        77
                                                                        |
==================================================================================================================================
 * 90%, 70%, 30%, and 10% chances of exceeding are the probabilities that the actual volume will exceed the volumes in the table.

The average is computed for the 1961-1990 base period.

(1) - The values listed under the 10% and 90% Chance of Exceeding are actually 5% and 95% exceedance levels.                  
(2) - The value is natural volume - actual volume may be affected by upstream water management.


To January 1999 Basin Outlook Report Contents Page