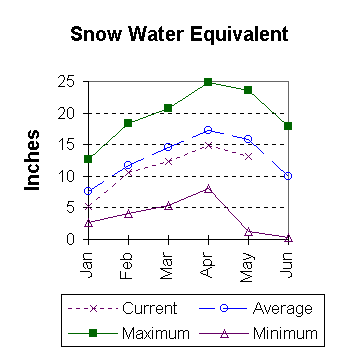
Streamflow
The 50 percent chance runoff is expected to be 84 to 88 percent of average for
the May through September runoff period. Yellowstone at Lake Outlet has is
expected to yield about 655,000 acre feet (87 percent of normal). Yellowstone
at Corwin Springs will yield about 1,620,00 acre feet (88 percent of normal).
Yellowstone near Livingston will yield about 1,860,000 acre feet (88 percent
of normal). Madison River near Grayling has a 50 percent chance of yielding
about 360,000 acre feet (84 percent of normal). See the following page for
detailed runoff volumes.
==================================================================================================================================
                                             UPPER YELLOWSTONE & MADISON RIVER BASINS
                                               Streamflow Forecasts - May 1, 1998
==================================================================================================================================
                                              |  <<====== Drier ======  Future Conditions  =======  Wetter =====>>  |
                                              |                                                                     |
  Forecast Point                     Forecast |  ==================== Chance Of Exceeding * ======================  |
                                      Period  |    90%       70%    |  50% (Most Probable)  |      30%       10%    |  30-Yr Avg.
                                              | (1000AF)  (1000AF)  |   (1000AF)  (% AVG.)  |    (1000AF)  (1000AF) |    (1000AF)
====================================================================|=======================|=====================================
YELLOWSTONE at Lake Outlet           MAY-SEP       553       614    |      655        87    |       696       757            756
                                                                    |                       |
YELLOWSTONE RIVER at Corwin Springs  MAY-SEP      1448      1550    |     1620        88    |      1690      1792           1844
                                                                    |                       |
YELLOWSTONE RIVER near Livingston    MAY-SEP      1631      1767    |     1860        88    |      1953      2089           2123
                                                                    |                       |
MADISON RIVER near Grayling  (2)     MAY-SEP       302       337    |      360        84    |       383       418            428
                                                                    |                       |
==================================================================================================================================
                UPPER YELLOWSTONE & MADISON RIVER BASINS                |        UPPER YELLOWSTONE & MADISON RIVER BASINS
             Reservoir Storage (1000 AF) - End of April                 |        Watershed Snowpack Analysis - May 1, 1998
==================================================================================================================================
                                      Usable |  *** Usable Storage ***  |                            Number     This Year as % of
Reservoir                            Capacity|  This      Last          |   Watershed                  of       =================
                                             |  Year      Year     Avg  |                          Data Sites   Last Yr   Average
========================================================================|=========================================================
ENNIS LAKE                              41.0     32.8     32.8     35.1 |   MADISON RIVER in WY         8        54        91
                                                                        |
HEBGEN LAKE                            377.5    264.5    237.6    246.1 |   YELLOWSTONE RIVER in WY     8        51        82
                                                                        |
==================================================================================================================================
 * 90%, 70%, 30%, and 10% chances of exceeding are the probabilities that the actual volume will exceed the volumes in the table.

The average is computed for the 1961-1990 base period.

(1) - The values listed under the 10% and 90% Chance of Exceeding are actually 5% and 95% exceedance levels.
(2) - The value is natural volume - actual volume may be affected by upstream water management.
 To May 1998 Basin Outlook Report Contents Page