Belle Fourche and Cheyenne River Basins (7)
April 1998

Snow.
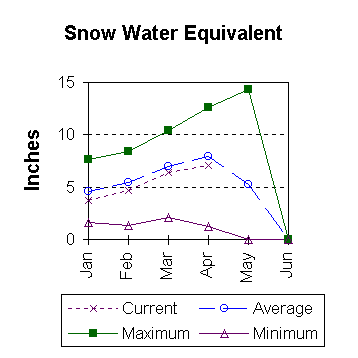
As of March 1, snow water equivalent (SWE) in the Black Hills is 92 percent of average. SWE in the Belle Fourche and Cheyenne River basins is 92 percent of last year. Measured snow depths ranged from 2 inches at Bearlodge Divide to 26 inches at Mallo. See Basin summary of Snow Course Data at the beginning of this report for a detailed listing.

Precipitation.
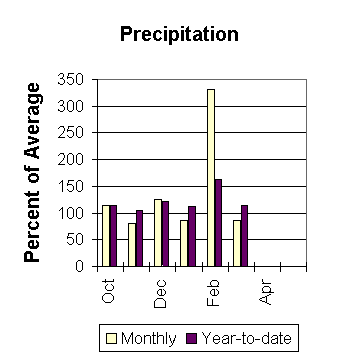
Precipitation, for the month of March was 86 percent of average in the Black Hills; March precipitation was 113 percent of the same month last year. Of the four reporting sites in the basin, New Castle had the highest percentage of average for February (318 percent of average). The site with the lowest percentage of average was Blind Park (79 percent of average for the month). Year-to-date precipitation is 114 percent of average and 73 percent of last year's amount.

Reservoir.
Reservoir storage is in good shape. Angostura is currently storing 109 percent of average (120,300 acre feet). Belle Fourche reservoir is storing 137 percent of average (179,300 acre feet). Deerfield reservoir is storing 113 percent of average (15,300 acre feet). Keyhole reservoir is storing 170 percent of average (183,100 acre feet). Pactola reservoir is storing 115 percent of average (53,900 acre feet), and Shadehill reservoir is storing 101 percent of average (63,700 acre feet).

Streamflow
Black Hills water users should see below average runoff during the March through July forecast period. The 50 percent chance runoff for Castle Creek below Deerfield Dam is about 87 percent of average (3,650 acre feet). The 50 percent chance runoff for Rapid Creek below Pactola Dam should be 16,500 acre feet (87 percent of average). Drainages relying on direct diversion for their water supply could be experience irrigation water shortages

==================================================================================================================================
                                              BELLE FOURCHE & CHEYENNE RIVER BASINS
                                               Streamflow Forecasts - April 1, 1998
==================================================================================================================================
                                              |  <<====== Drier ======  Future Conditions  =======  Wetter =====>>  |             
                                              |                                                                     |
  Forecast Point                     Forecast |  ==================== Chance Of Exceeding * ======================  |
                                      Period  |    90%       70%    |  50% (Most Probable)  |      30%       10%    |  30-Yr Avg.
                                              | (1000AF)  (1000AF)  |   (1000AF)  (% AVG.)  |    (1000AF)  (1000AF) |    (1000AF)
====================================================================|=======================|=====================================
CASTLE CREEK blw Deerfield Dam (2)   APR-JUL      2.42      3.15    |     3.65        87    |      4.15      4.88           4.20
                                                                    |                       |
RAPID CREEK blw Pactola Dam (2)      APR-JUL       7.2      12.7    |     16.5        87    |        20        26           18.9
                                                                    |                       |
==================================================================================================================================
                  BELLE FOURCHE & CHEYENNE RIVER BASINS                 |          BELLE FOURCHE & CHEYENNE RIVER BASINS
             Reservoir Storage (1000 AF) - End of March                 |        Watershed Snowpack Analysis - April 1, 1998
==================================================================================================================================
                                      Usable |  *** Usable Storage ***  |                            Number     This Year as % of
Reservoir                            Capacity|  This      Last          |   Watershed                  of       =================
                                             |  Year      Year     Avg  |                          Data Sites   Last Yr   Average
========================================================================|=========================================================
ANGOSTURA                              122.1    120.3    120.7    110.1 |   BELLE FOURCHE               7        71        92
                                                                        |
BELLE FOURCHE                          178.4    179.3    172.1    130.9 |
                                                                        |
DEERFIELD                               15.2     15.3     14.6     13.5 |
                                                                        |
KEYHOLE                                193.8    183.1    181.9    107.6 |
                                                                        |
PACTOLA                                 55.0     53.9     53.5     46.8 |
                                                                        |
SHADEHILL                               81.4     63.7     83.5     63.1 |
                                                                        |
==================================================================================================================================
 * 90%, 70%, 30%, and 10% chances of exceeding are the probabilities that the actual volume will exceed the volumes in the table.

The average is computed for the 1961-1990 base period.


To April 1998 Basin Outlook Report Contents Page