

==================================================================================================================================
                                                     LITTLE SNAKE RIVER BASIN
                                               Streamflow Forecasts - June 1, 1997
==================================================================================================================================
                                              |  <<====== Drier ======  Future Conditions  =======  Wetter =====>>  |
                                              |                                                                     |
  Forecast Point                     Forecast |  ==================== Chance Of Exceeding * ======================  |
                                      Period  |    90%       70%    |  50% (Most Probable)  |      30%       10%    |  30-Yr Avg.
                                              | (1000AF)  (1000AF)  |   (1000AF)  (% AVG.)  |    (1000AF)  (1000AF) |    (1000AF)
====================================================================|=======================|=====================================
LITTLE SNAKE R nr Slater             APR-JUL       210       228    |      240       155    |       252       270            155
                                                                    |                       |
LITTLE SNAKE R nr Dixon              APR-JUL       416       478    |      520       158    |       562       624            329
                                                                    |                       |
==================================================================================================================================
                        LITTLE SNAKE RIVER BASIN                        |                LITTLE SNAKE RIVER BASIN
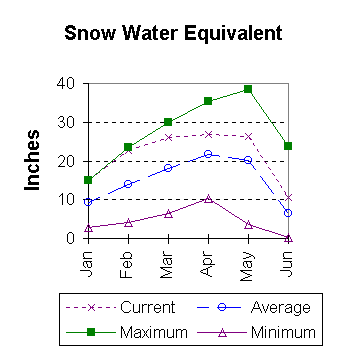
             Reservoir Storage (1000 AF) - End of May                   |        Watershed Snowpack Analysis - June 1, 1997
==================================================================================================================================
                                      Usable |  *** Usable Storage ***  |                            Number     This Year as % of
Reservoir                            Capacity|  This      Last          |   Watershed                  of       =================
                                             |  Year      Year     Avg  |                          Data Sites   Last Yr   Average
========================================================================|=========================================================
                                                                        |   LITTLE SNAKE RIVER          6       118       163
                                                                        |
==================================================================================================================================
 * 90%, 70%, 30%, and 10% chances of exceeding are the probabilities that the actual volume will exceed the volumes in the table.

The average is computed for the 1961-1990 base period.

(1) - The values listed under the 10% and 90% Chance of Exceeding are actually 5% and 95% exceedance levels.
(2) - The value is natural volume - actual volume may be affected by upstream water management.
 To June 1997 Basin Outlook Report Contents Page